What I'm looking at - ISM PMI, 60/40 portfolio, XLU, gold:silver ratio
The S&P 500 remains stuck in the 2930-2940 range. Here's what I'm looking at.
ISM manufacturing PMI
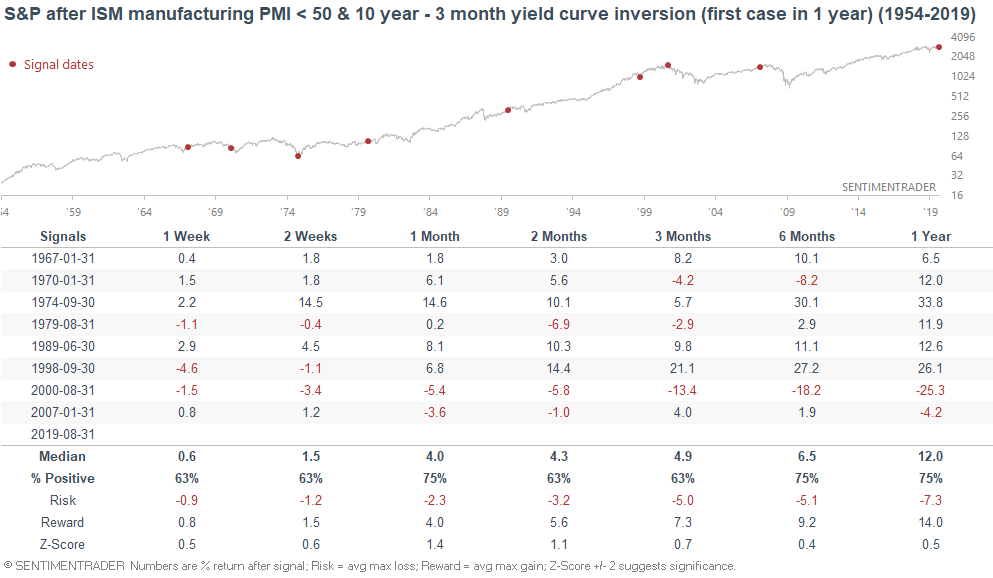
As Jason noted yesterday, the widely followed ISM manufacturing PMI has fallen below 50. This means that it will be a bearish factor for the Macro Index starting on October 1. Both the WSJ and Bloomberg noted that this should not be taken lightly, since the yield curve is also inverted right now.
The following table illustrates what happens next to the S&P 500 when the ISM manufacturing PMI falls below 50 (i.e. contraction) and the 10 year - 3 month Treasury yield curve is inverted.
As you can see, the signals are erratic. Sometimes this occurs towards the end of a recession and bear market (e.g. 1970, 1974). Sometimes this occurs 6-12 months before a recession and bear market begins (e.g. 2007, 1989, 1979). And sometimes this is a late-cycle false alarm (e.g. 1967 and 1998).
Overall, a weakening manufacturing sector + inverted yield curve is a late-cycle sign for the economic expansion. It is not a guaranteed bearish signal. Looking at the ISM Report for August, it's clear that the trade war is taking its toll.
"Of the 18 manufacturing industries, nine reported growth in August, in the following order: Textile Mills; Furniture & Related Products; Food, Beverage & Tobacco Products; Wood Products; Petroleum & Coal Products; Nonmetallic Mineral Products; Machinery; Miscellaneous Manufacturing; and Chemical Products. The seven industries reporting contraction in August — in the following order — are: Apparel, Leather & Allied Products; Fabricated Metal Products; Transportation Equipment; Primary Metals; Plastics & Rubber Products; Paper Products; and Electrical Equipment, Appliances & Components. "
As I've said over the past few weeks, the main points of macro weakness revolve around trade, manufacturing, and the yield curve. Housing is semi-weak. Other macro factors are ok.
60/40 portfolio
While the traditional 60/40 portfolio is flawed in many ways, it remains popular. One of the benefits is that a 60/40 portfolio will be less volatile than a 100% equities portfolio, since bonds often perform well when stocks perform poorly.
While the stock market performed poorly in August, bonds surged, causing a 60/40 portfolio to maintain its value. Here's the Bloomberg Barclays U.S. Aggregate Bond Index vs. the S&P 500
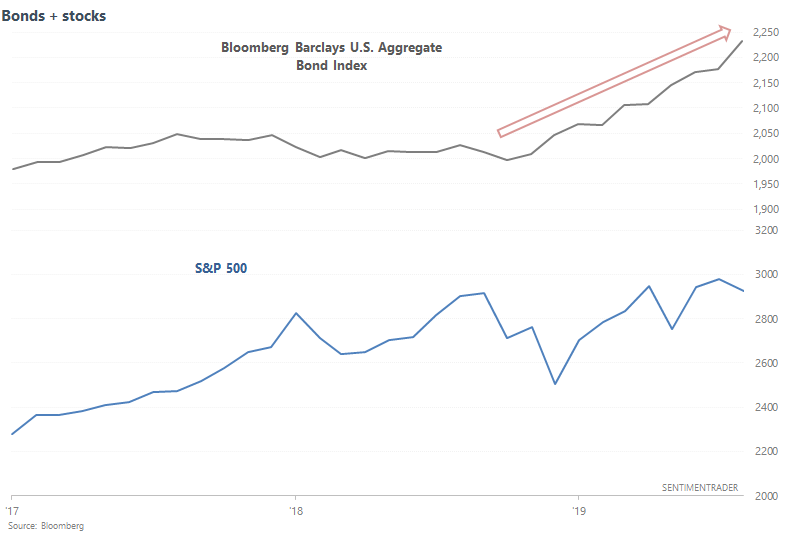
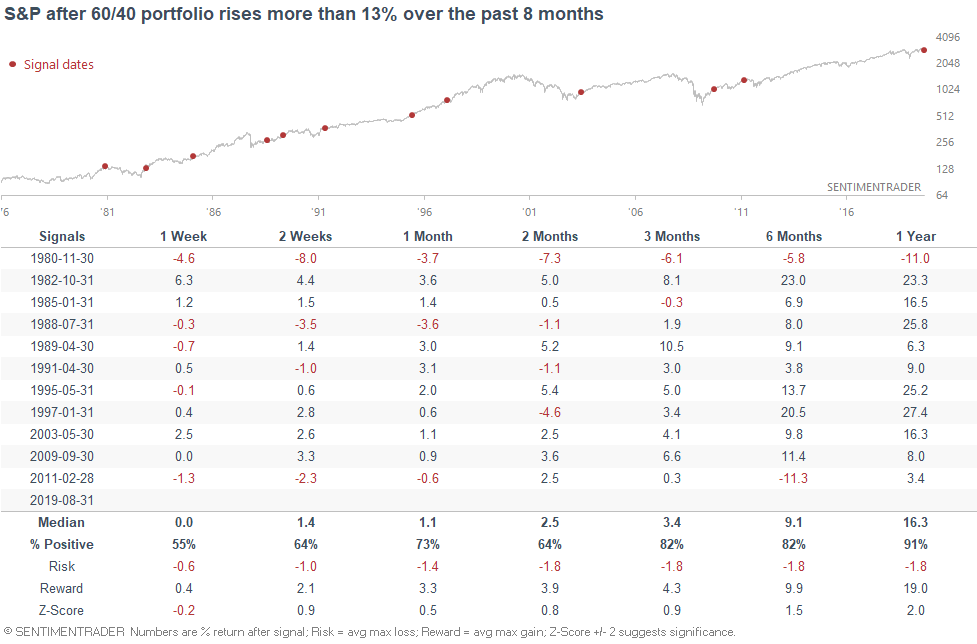
The 60/40 portfolio has surged 13% over the past 8 months. From a momentum perspective, this has been mostly bullish for stocks over the next year. The one exception was November 1980, just as the S&P 500 began a bear market.
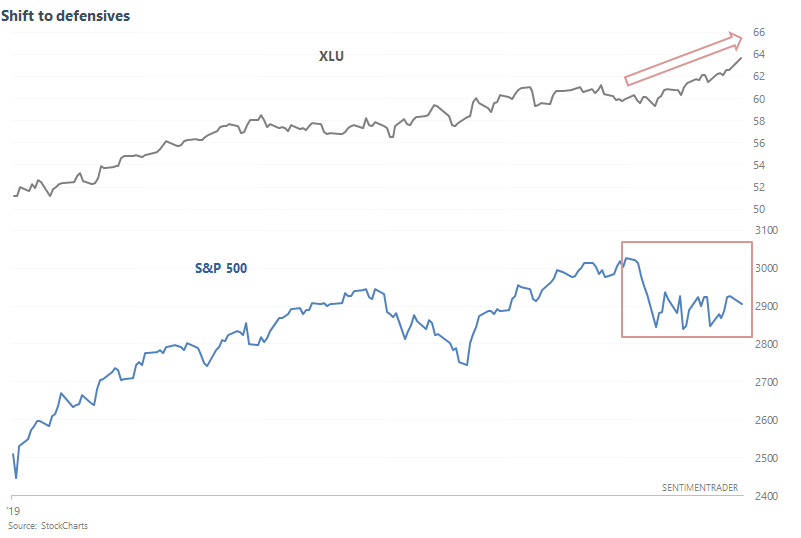
Shift to defensives
As the stock market remains in a rut and recessionary fears linger, investors and traders have shifted into defensive sectors. XLU (utilities ETF) continues to make new highs while the S&P 500 bounces around.
The XLU:S&P ratio and XLU have rallied more than 5% over the past month, while the S&P 500 is down more than -1%. In the past, this was slightly more bullish than random over the next 3 months.
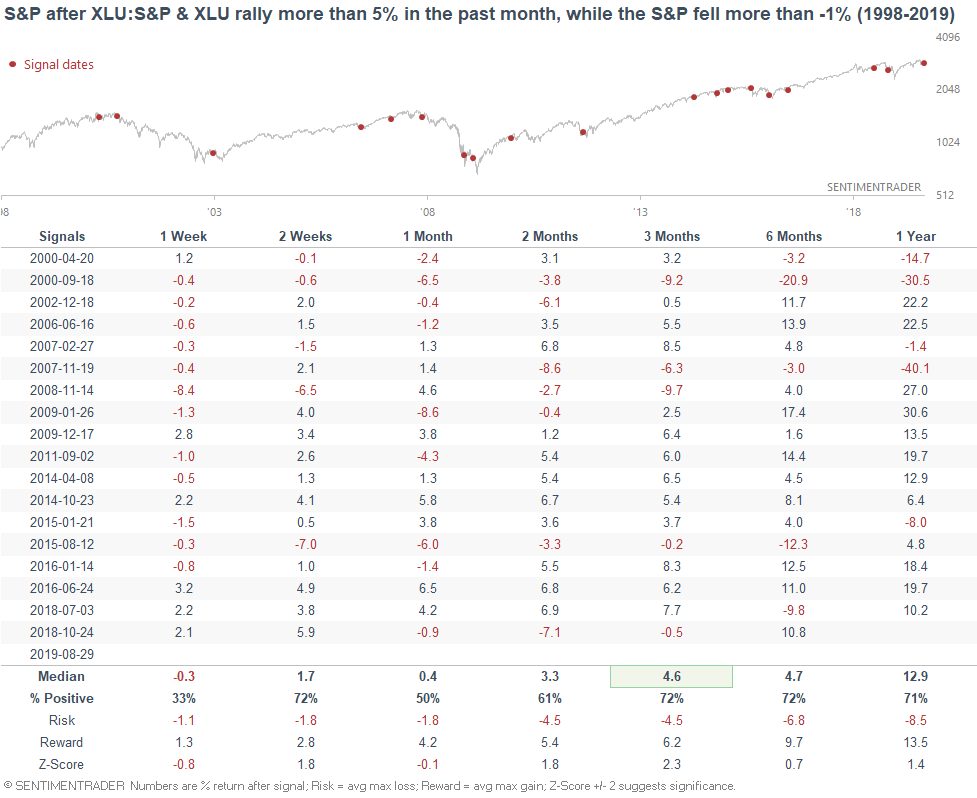
However, this was not extremely more bullish than random. It's common for XLU to outperform during a correction, and sometimes -6% corrections morph into -10% or -20% corrections (e.g. October 2018).
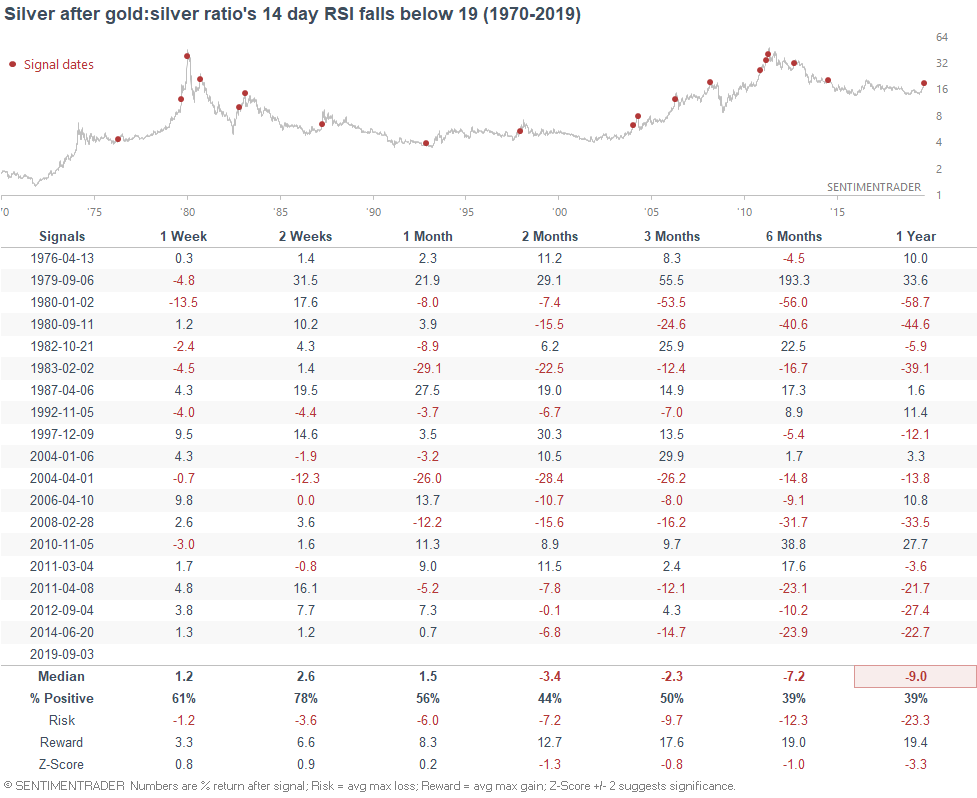
Gold:silver
And lastly, silver continues to play catchup to gold's rally. Silver surged yesterday, causing the gold:silver ratio to tank.
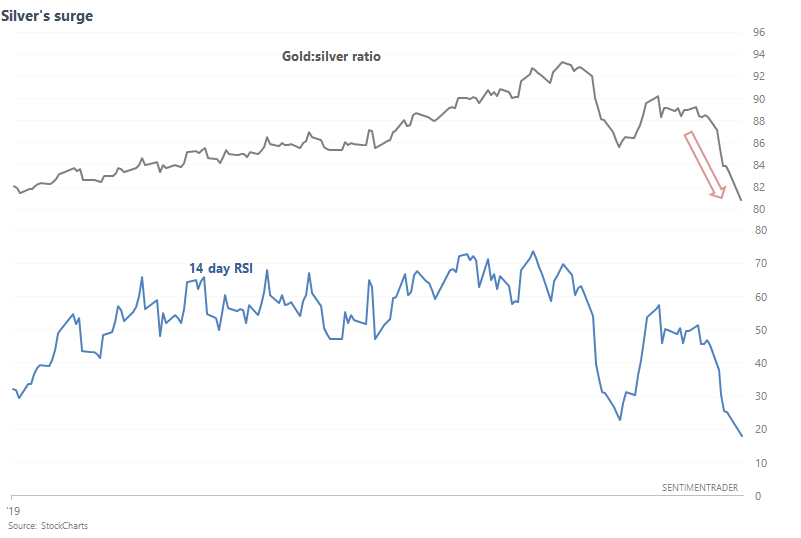
As a result, the gold:silver ratio's 14 day RSI has fallen to 18, which is extremely low. In the past, this wasn't too good for silver over the next 6-12 months.