Data &
Technology
Research
Reports
Report Solutions
Reports Library
Actionable
Strategies
Free
Resources
Simple Backtest Calculator
Simple Seasonality Calculator
The Kelly Criterion Calculator
Sentiment Geo Map
Public Research Reports
Free Webinar
Pricing
Company
About
Meet Our Team
In the News
Testimonials
Client Success Stories
Contact
Log inLoginSign up
< BACK TO ALL REPORTS

What I'm looking at - Industrial Production, housing's comeback, VVIX, U.S. Dollar drop, loans

Troy Bombardia
2019-10-18
null

Here's what I'm looking at:


Industrial Production

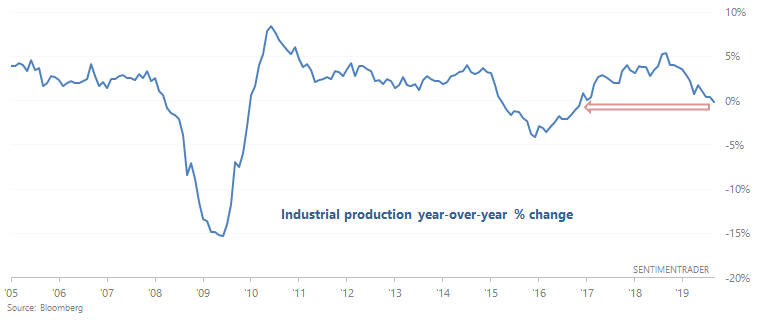
The latest reading for Industrial Production fell -0.14% year-over-year. By now, most manufacturing-related indicators are in contraction-mode:

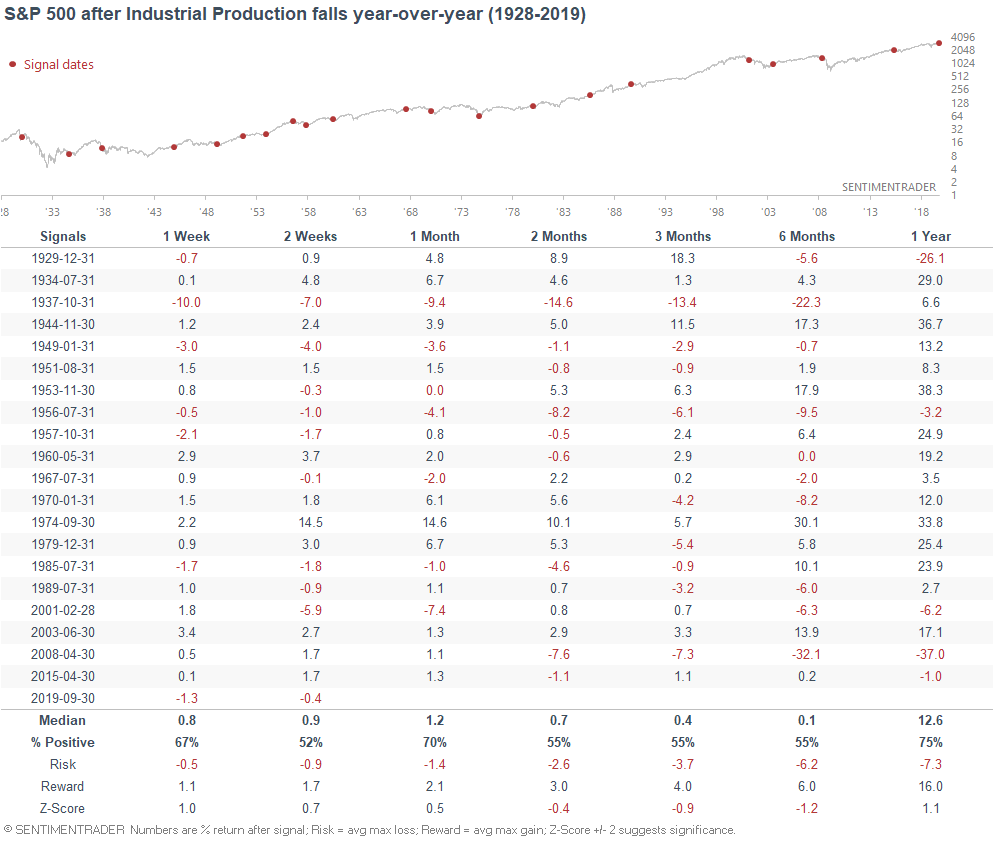
When this happened in the past (YoY Industrial Production turned negative), the S&P's returns over the next 6 months were worse than random, with large downside risk (primarily because many of these signals occurred in a recession).

And if you isolate for the late-cycle cases (i.e. Unemployment is also under 5%), the S&P's 3-6 month forward returns were more bearish:

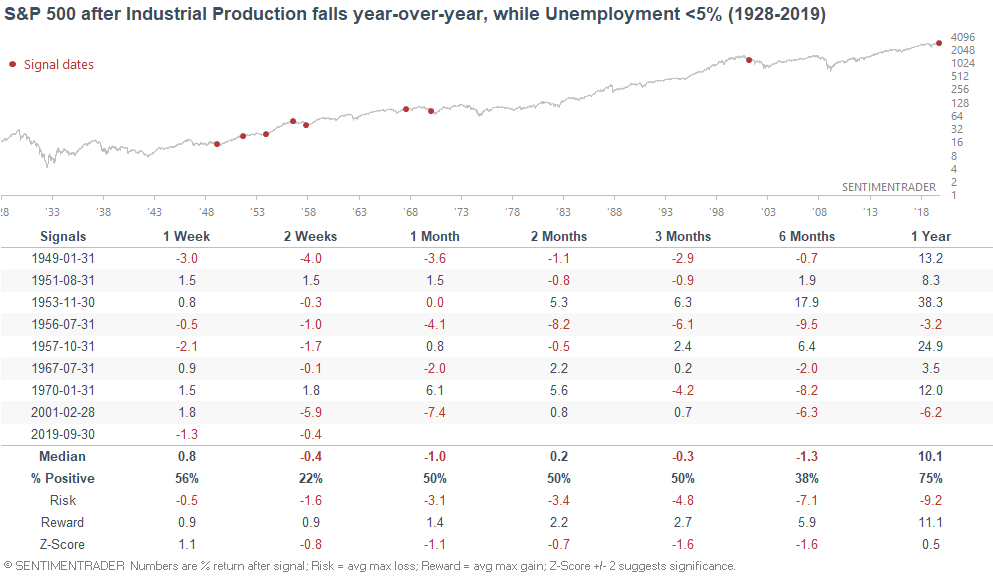
Overall, manufacturing remains a bearish factor for macro. However, no data point (especially a fundamental data point) should be taken in isolation. The weakness in macro right now coincides with strength in housing and the labor market.


Housing's comeback

While much is said about the yield curve, trade war, and manufacturing, macro watchers generally are not looking at the rebound in housing. And right now, housing continues to improve. The NAHB Housing Market index has increased to a 20 month high:

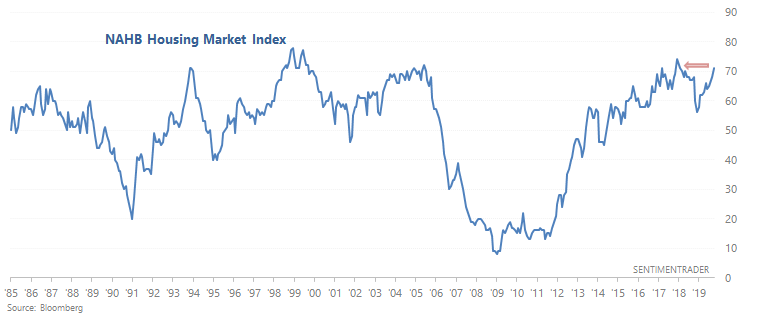
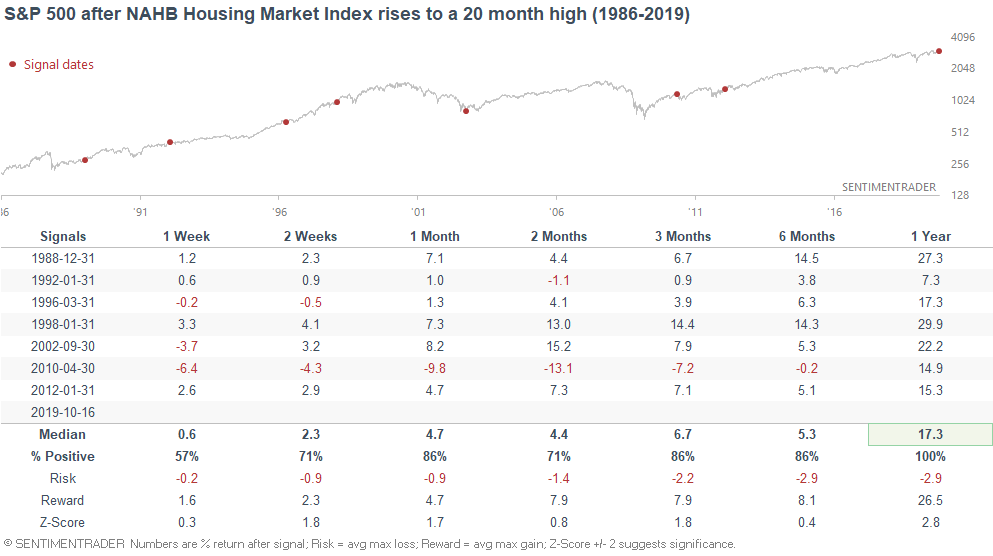
Housing indicators are extremely useful as leading indicators for the U.S. economy. For example, they were weakening in the 2nd half of 2018 (before the December crash), and have been strengthening since the very start of 2019. When the NAHB Housing Market Index rose to a 20 month high in the past, the S&P's returns over the next year were extremely bullish.


VVIX

The VIX of VIX Index has fallen below its 200 day moving average for the first time since July as stock market volatility subsides:

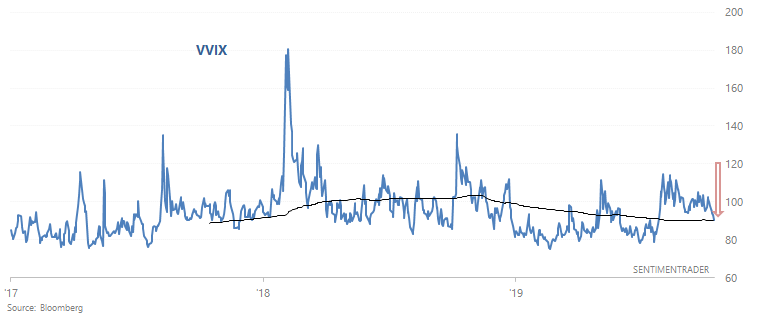
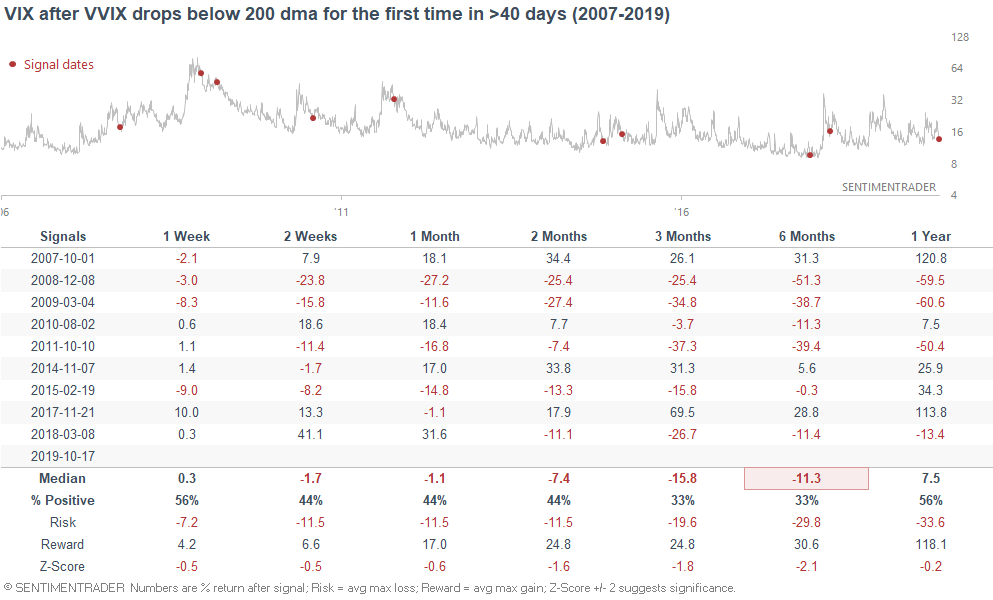
When it did so in the past, the S&P's forward returns were no different from random, but VIX's returns over the next 3-6 months were more bearish than random:


Dollar's reversal

The U.S. Dollar Index reached a multi-year high in late-September, and since then has dropped like a stone.

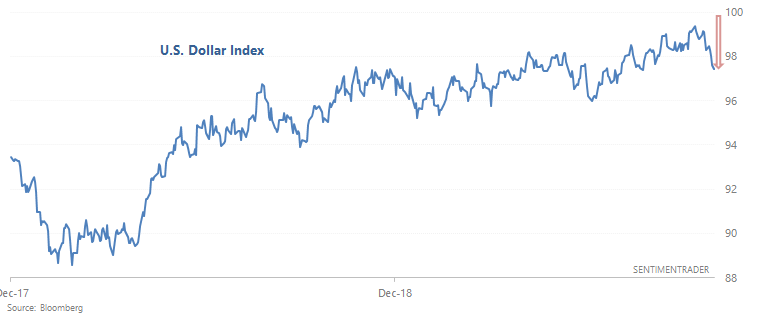
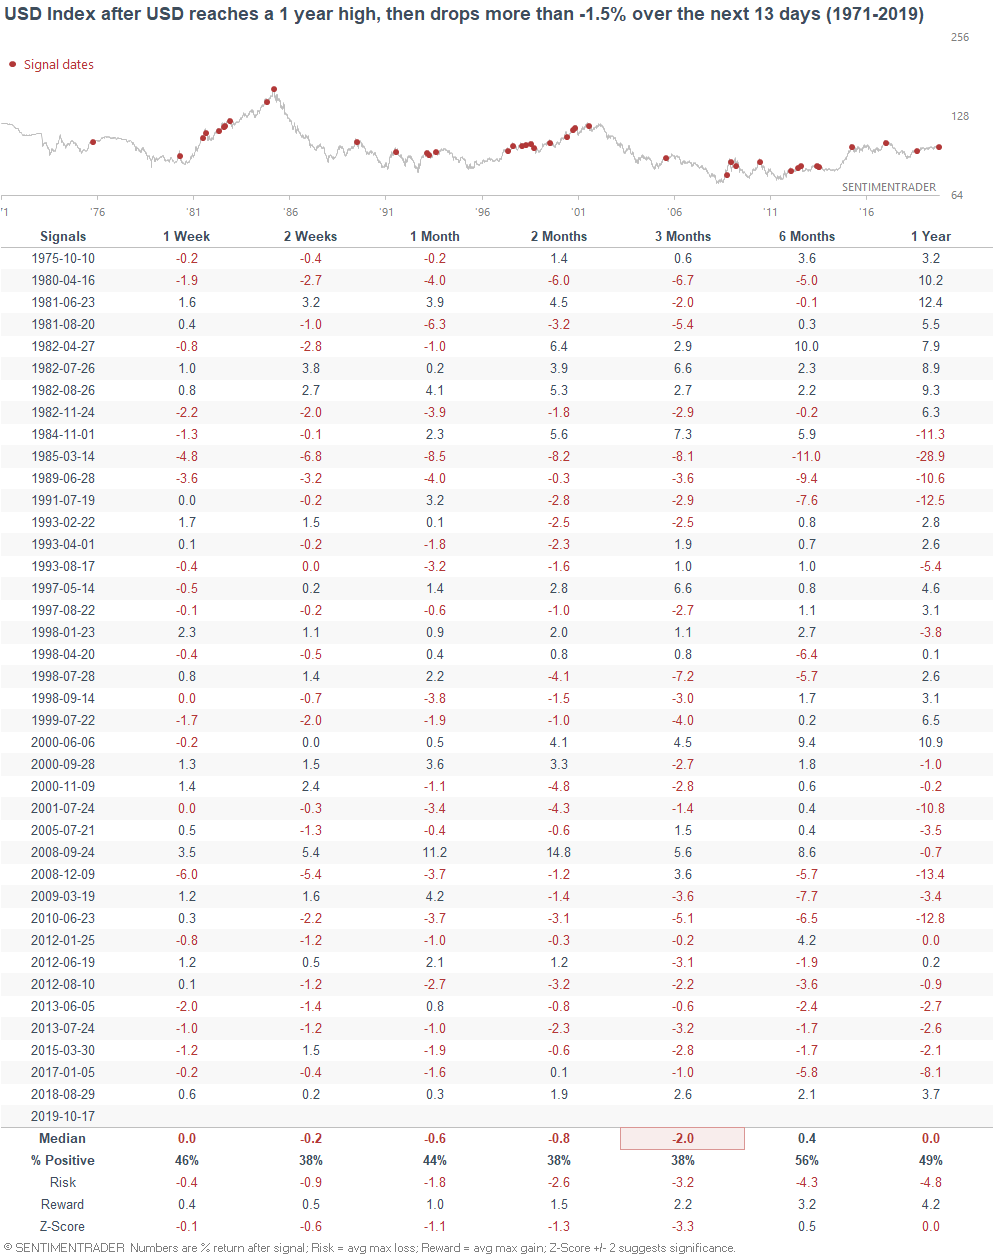
Such rapid reversal patterns are rather common, and aren't great for the U.S. Dollar Index. When this happened in the past, it typically led to continued weakness for the dollar over the next few months. This pattern has been especially bearish for the dollar over the past 10 years, leading to losses for the Dollar almost every time over the next 3 months:


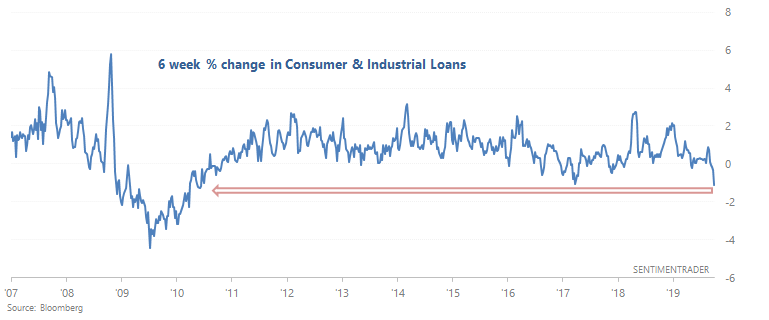
Commercial & industrial loans

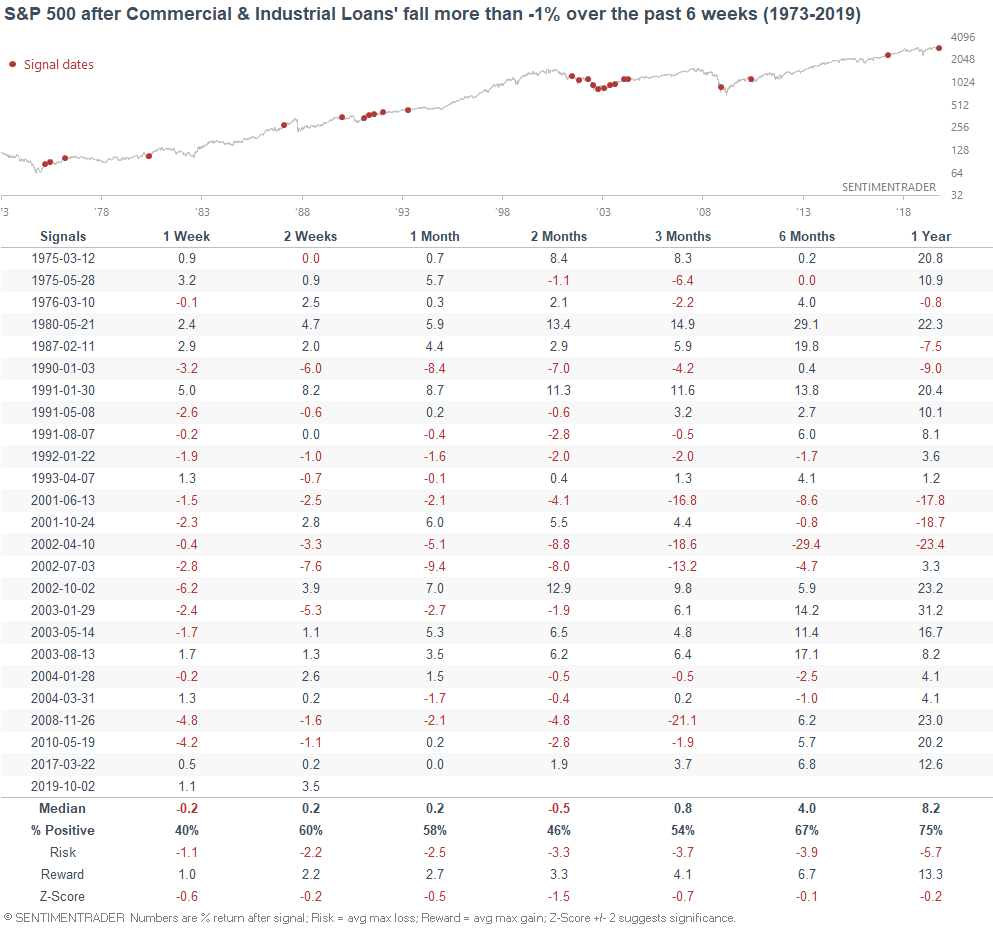
As popular analyst Otavi Costa noted, commercial and industrial loans declined by the most since 2008. This was a pretty popular complaint in 2017, when analysts and media firms were asking "if the economy is so good, then how can commercial and industrial loans be falling?"

But if we look at a longer chart, it's clear that this can also happen during economic expansions. It is not exclusive to bear markets and recessions:

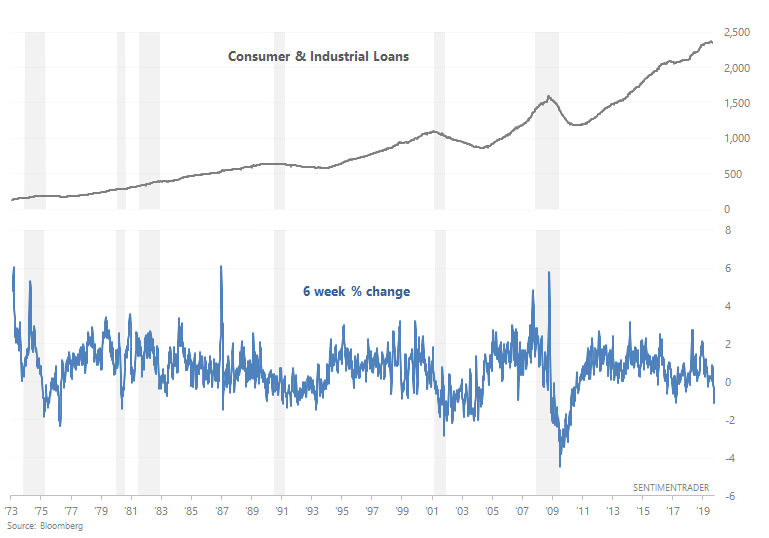
When this happened in the past, the S&P's forward returns were more bearish than random, but it wasn't a particularly strong and consistently bearish factor for stocks:

Sorry, you don't have access to this report

Upgrade your subscription plan to get access
Go to Dasboard
DATA &
TECHnologies
IndicatorEdge
‍
BackTestEdge
‍
Other Tools
‍
DataEdge API
RESEARCH
reports
Research Solution
‍
Reports Library
‍
actionable
Strategies
Trading Strategies
‍
Smart Stock Scanner
‍
FREE
RESOUrCES
Simple Backtest
Calculator
Simple Seasonality
Calculator
The Kelly Criterion
Calculator
Sentiment Geo Map
‍
Public Research Reports
‍
Free Webinar
COMPANY
‍
About
‍
Meet our Team
‍
In the News
‍
Testimonials
‍
Client Success Stories
Pricing
Bundle pricing
‍
Announcements
‍
FAQ
© 2024 Sundial Capital Research Inc. All rights reserved.
Setsail Marketing
TermsPrivacyAffiliate Program
Risk Disclosure: Futures and forex trading contains substantial risk and is not for every investor. An investor could potentially lose all or more than the initial investment. Risk capital is money that can be lost without jeopardizing ones’ financial security or life style. Only risk capital should be used for trading and only those with sufficient risk capital should consider trading. Past performance is not necessarily indicative of future results.

Hypothetical Performance Disclosure: Hypothetical performance results have many inherent limitations, some of which are described below. No representation is being made that any account will or is likely to achieve profits or losses similar to those shown; in fact, there are frequently sharp differences between hypothetical performance results and the actual results subsequently achieved by any particular trading program. One of the limitations of hypothetical performance results is that they are generally prepared with the benefit of hindsight. In addition, hypothetical trading does not involve financial risk, and no hypothetical trading record can completely account for the impact of financial risk of actual trading. for example, the ability to withstand losses or to adhere to a particular trading program in spite of trading losses are material points which can also adversely affect actual trading results. There are numerous other factors related to the markets in general or to the implementation of any specific trading program which cannot be fully accounted for in the preparation of hypothetical performance results and all which can adversely affect trading results.

Testimonial Disclosure: Testimonials appearing on this website may not be representative of other clients or customers and is not a guarantee of future performance or success.