
What I'm looking at - HiLo, coffee, Sweden PMI, AAII and blow-off top
As stocks bounce around all-time highs, here's what I'm looking at:
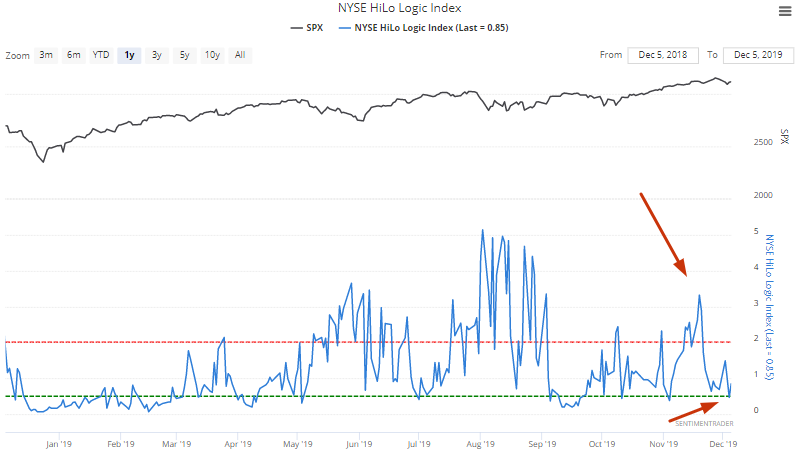
NYSE HiLo Logic Index
The NYSE HiLo Logic Index, which looks for split market conditions in terms of breadth, is a very useful indicator when applied to trading models. The HiLo Index was quite high a few weeks ago (bearish for stocks). But given the recent small pullback in stocks, the HiLo Index has declined back to 0.5
Is this the all-clear sign for stocks?
Here's what happened next to the S&P when the HiLo Index went from greater than 3.3 to less than 0.5 within 3 weeks:
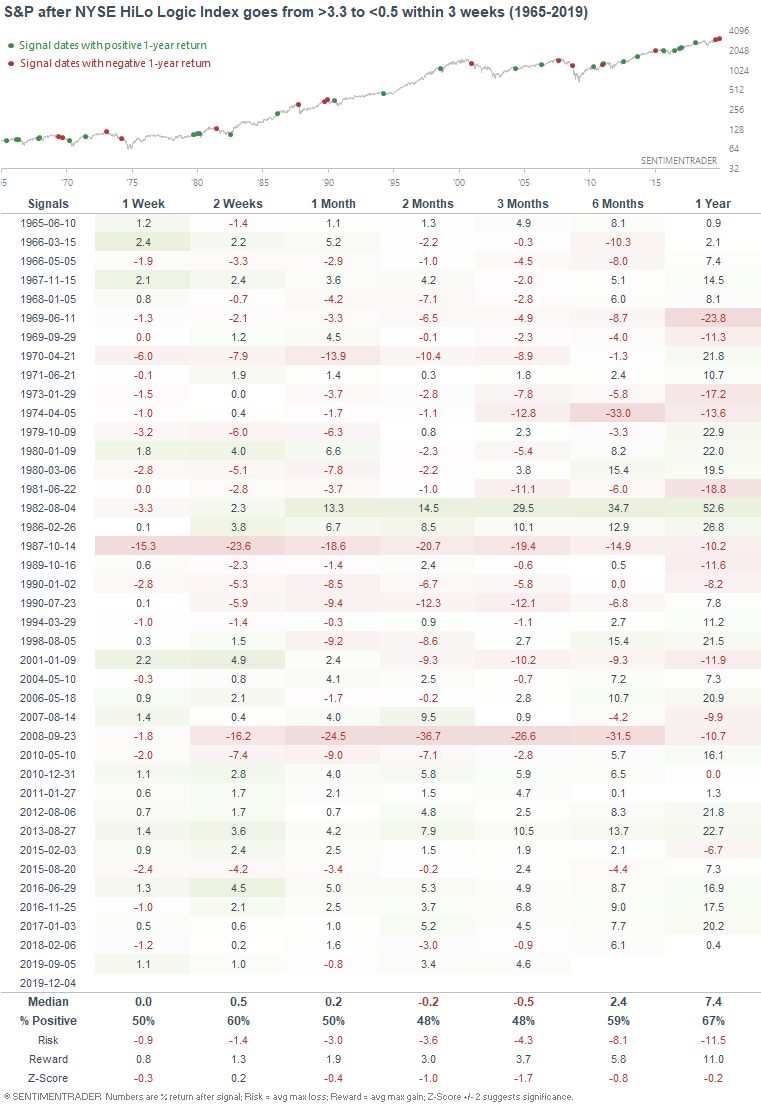
As you can see, stocks usually continued to struggle over the next 2-3 months. From a probability point of view, choppy markets are to be expected in the weeks and months ahead.
Coffee
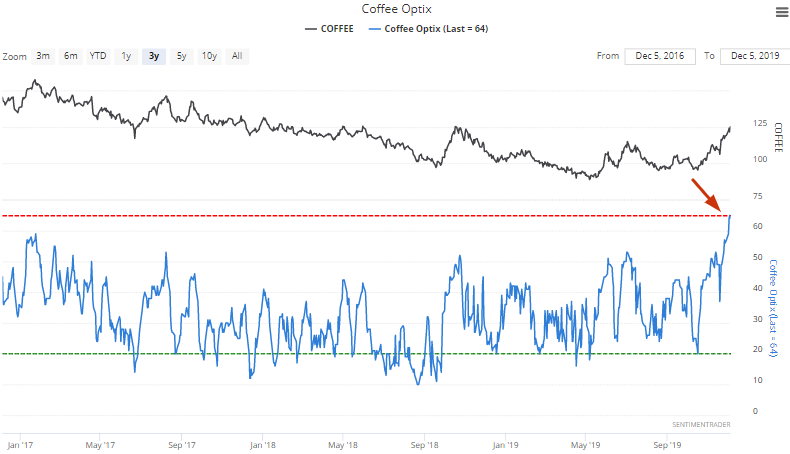
After the recent runup in coffee, coffee's sentiment has become excessively optimistic (Optix at 65).
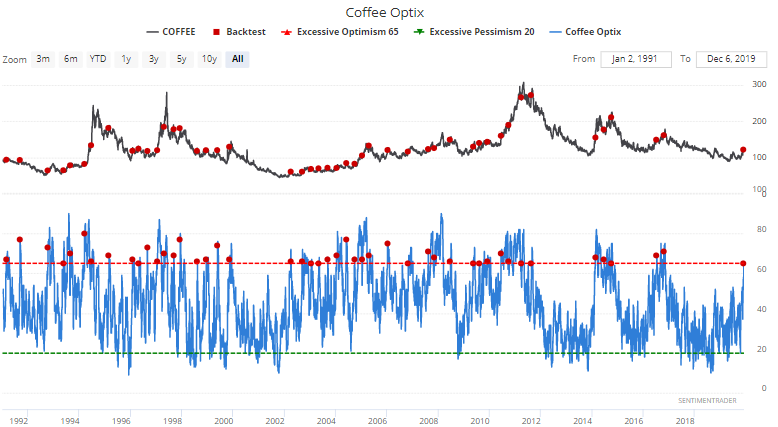
When coffee's Optix rose to 65 for the first time in 3 months, coffee often struggled over the next several months:
Sweden PMI
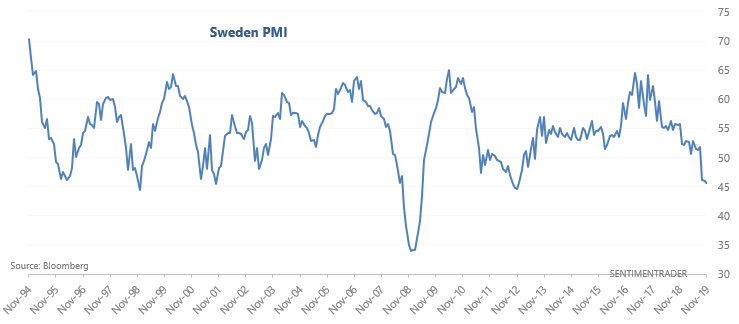
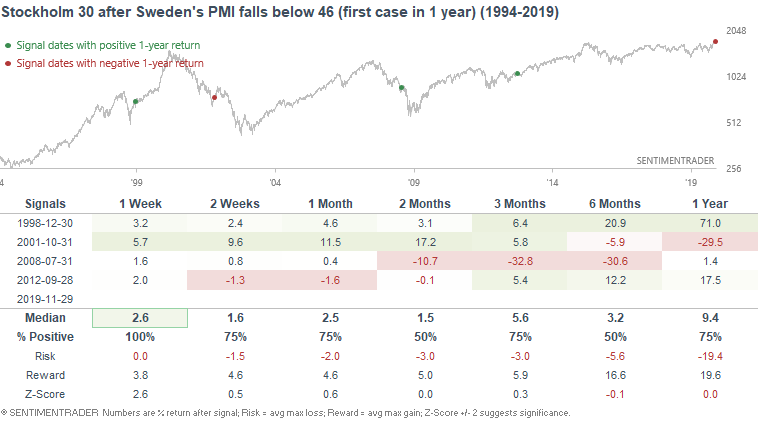
With the European economy and much of global manufacturing slowing down, Sweden's manufacturing PMI is solidly in contraction mode. The latest manufacturing PMI reading came in at 45.4 (readings <50 = contraction), the lowest in 7 years:
While this may sound scary, it wasn't quite a consistent bearish factor for Swedish stocks. Sure, this did happen in 2001 and 2008, both cases which saw more losses over the next several months. But it also happened in 1998 and 2012, as global equity markets left a major correction .
AAII
As Jason mentioned, there has been talk in the media about blow-off tops recently. This may not be the case, at least according to AAII. After peaking last October, AAII Bullish % has not spent a single week above 45% despite this year's big rally.
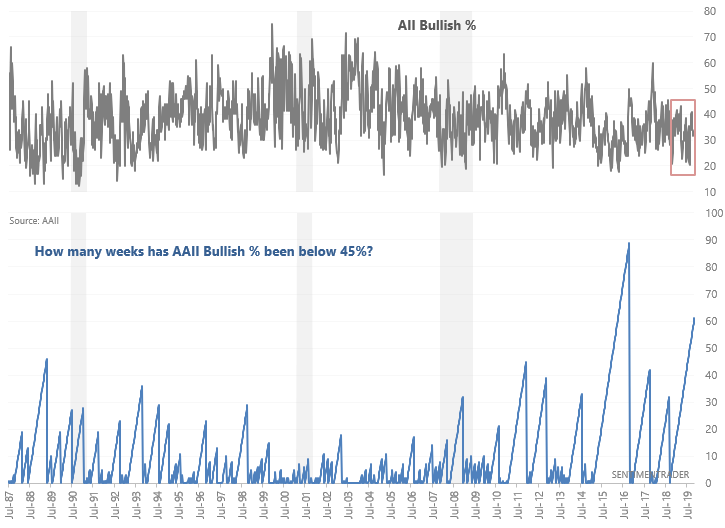
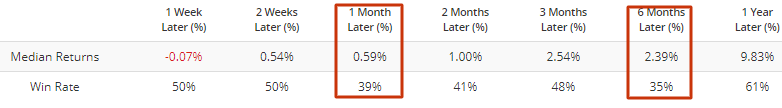
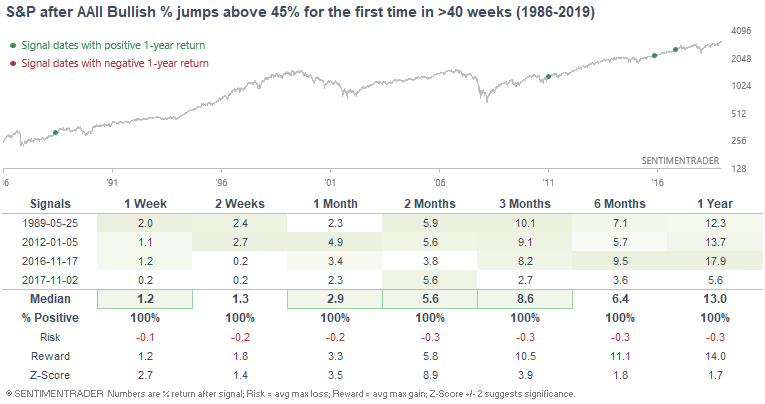
So when sentiment according to AAII does finally jump, it's typically not the final blow-off top to a bull market. The following table demonstrates what the S&P did next after AAII Bullish % jumped above 45% for the first time in more than 40 weeks:
The sample size is small, so let's relax the parameters:
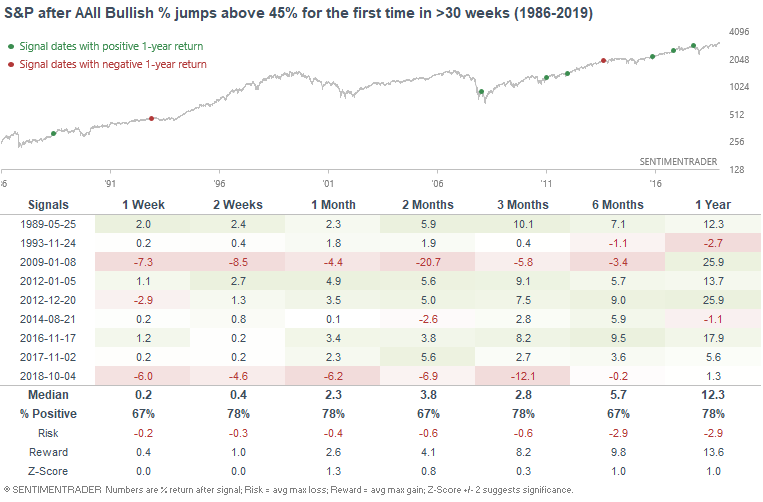
While forward returns are less bullish, the S&P's returns over the next year are still more bullish than random. Overall, I wouldn't consider the recent rally a blow-off top.
My trading portfolio
I've been moving countries and changing residencies over the past half year, so I haven't done much trading up until a month ago. Now that I've settled down, I've reopened trading accounts. In the interest of transparency, I'm going to show you what my own trading portfolio is doing, similar to what Jason does.
From October 25 (when I started to trade again) - present:
- My account is up 2.78%
- Currently 100% in bonds
I don't place discretionary trades - these are purely based on my quantitative models.