
Applying sentiment indicators to different models
2 months ago I looked at what would happen if you applied 8 different sentiment indicators to the unemployment rate model. This post takes that 1 step further.
2 sentiment indicators
I whittled down the 8 indicators and focused on the ones that have data from the 1960s-present.
Going through various combinations of these indicators demonstrates that combining the Stock/Bond ratio and NYSE HiLo Logic Index adds the most additional alpha and increases risk-adjusted returns.
So with that being said, here's what happens when you apply the Stock/Bond ratio and NYSE HiLo Logic Index to the following models:
- Simple Trading Model With Fundamentals
- Macro Index Model
- Conference Board LEI Model
- Dual Trend Model With Fundamentals
Here's how we apply these 2 sentiment indicators:
- If the original model says SELL stocks, then sell stocks and buy the Bloomberg Barclays U.S. Aggregate Bonds Index.
- If the original model says BUY stocks, and neither "Stock/Bond ratio was >2.5 sometime over the past 2 months", nor "NYSE HiLo Logic Index's 10 dma was >3 sometime over the past 2 months", BUY stocks.
- If the original model says BUY stocks, and "Stock/Bond ratio was >2.5 sometime over the past 2 months", or "NYSE HiLo Logic Index's 10 dma was >3 sometime over the past 2 months", SELL stocks and buy the Bloomberg Barclays U.S. Aggregate Bonds Index.
In a nutshell, follow the original model, but sell stocks and buy bonds if either of these 2 sentiment signals sent a bearish signal sometime over the past 2 months.
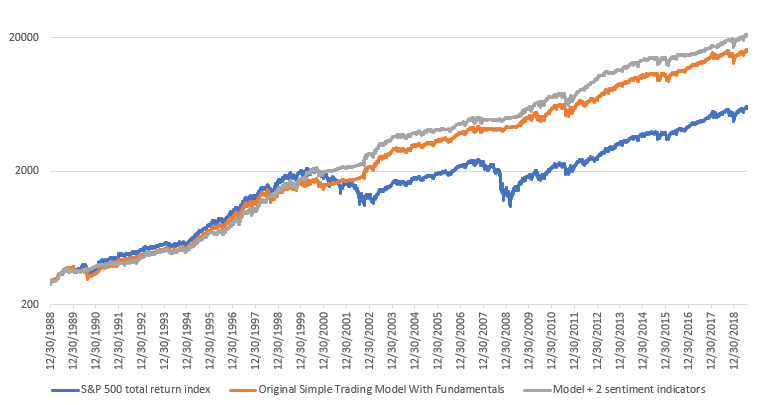
Simple Trading Model With Fundamentals + 2 sentiment indicators
Average annual returns
From December 30, 1988 - August 1, 2019:
- The original Simple Trading Model With Fundamentals has an average annual return of 11.87% per year
- Simple Trading Model With Fundamentals (+Stock/Bond ratio and NYSE HiLo Logic Index) has an average annual return of 13.44% per year
*These returns do not include the S&P 500's dividends reinvested. Including dividends reinvested, average annual returns would be higher.
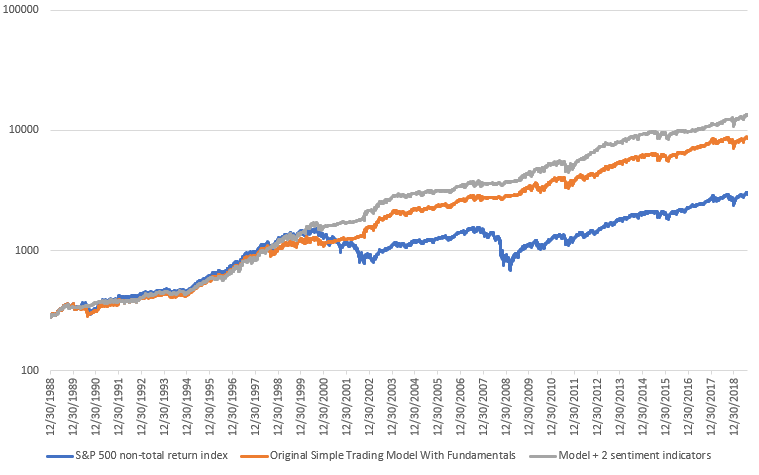
Sharpe ratio
From December 30, 1988 - August 1, 2019:
- The original Simple Trading Model With Fundamentals has a Sharpe ratio of 0.67
- Simple Trading Model With Fundamentals (+Stock/Bond ratio and NYSE HiLo Logic Index) has a Sharpe ratio of 0.88
*These Sharpe ratios are lower than what you might expect, since they do not include the S&P 500's dividends reinvested. Including dividends reinvested, Sharpe would be higher.
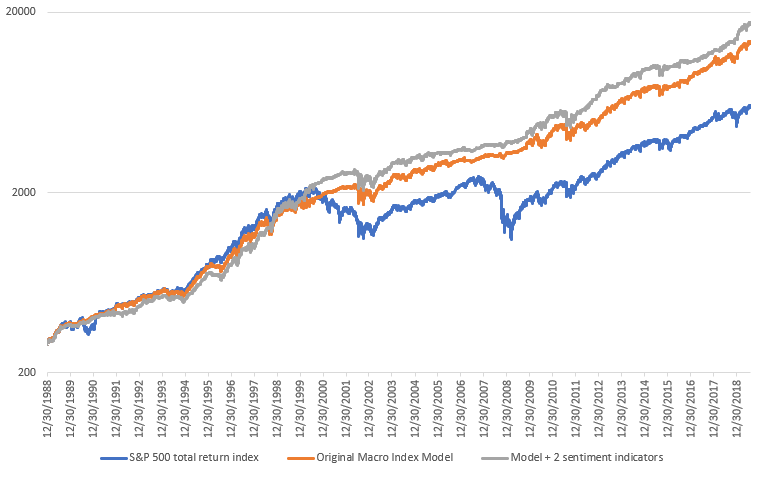
Macro Index Model + 2 sentiment indicators
Average annual returns
From December 30, 1988 - August 1, 2019:
- The original Macro Index Model has an average annual return of 11.65% per year
- Macro Index Model (+Stock/Bond ratio and NYSE HiLo Logic Index) has an average annual return of 12.99% per year
*These returns do not include the S&P 500's dividends reinvested. Including dividends reinvested, average annual returns would be higher.
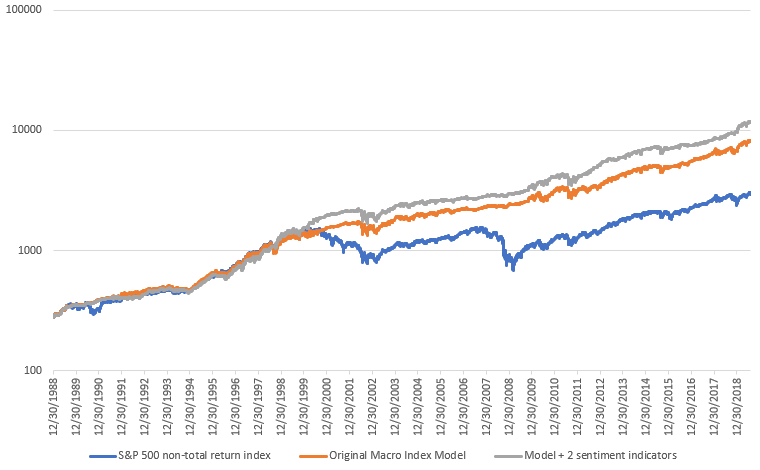
Sharpe ratio
From December 30, 1988 - August 1, 2019:
- The original Macro Index Model has a Sharpe ratio of 0.69
- Simple Trading Model With Fundamentals (+Stock/Bond ratio and NYSE HiLo Logic Index) has a Sharpe ratio of 0.87
*These Sharpe ratios are lower than what you might expect, since they do not include the S&P 500's dividends reinvested. Including dividends reinvested, Sharpe would be higher.
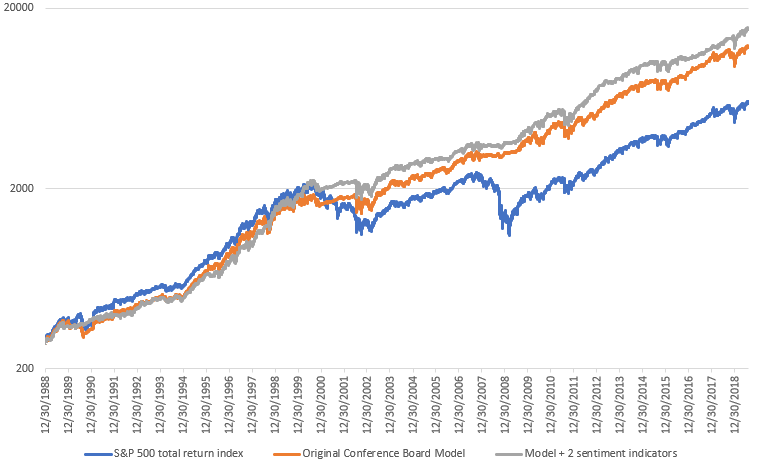
Conference Board LEI Model + 2 sentiment indicators
*This Conference Board LEI Model is a little different from what I described here. In the following version of the Conference Board LEI Model, the rules are as follows:
*Thank you to Daniel - one of our subscribers - who emailed me about this
- Buy and hold the S&P 500, unless...
- The Conference Board LEI's 6 month rate-of-change is negative, AND the S&P is below its 12 month moving average.
Average annual returns
From December 30, 1988 - August 1, 2019:
- The original Conference Board LEI Model has an average annual return of 10.99% per year
- Conference Board LEI Model (+Stock/Bond ratio and NYSE HiLo Logic Index) has an average annual return of 12.4% per year
*These returns do not include the S&P 500's dividends reinvested. Including dividends reinvested, average annual returns would be higher.
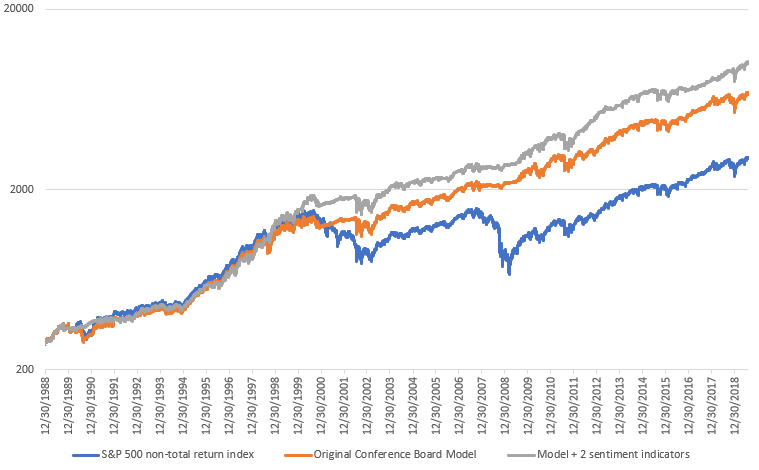
Sharpe ratio
From December 30, 1988 - August 1, 2019:
- The original Conference Board LEI Model has a Sharpe ratio of 0.6
- Conference Board LEI Model (+Stock/Bond ratio and NYSE HiLo Logic Index) has a Sharpe ratio of 0.77
*These Sharpe ratios are lower than what you might expect, since they do not include the S&P 500's dividends reinvested. Including dividends reinvested, Sharpe would be higher.
Dual Trend Model With Fundamentals + 2 sentiment indicators
Average annual returns
From December 30, 1988 - August 1, 2019:
- The original Dual Trend Model With Fundamentals has an average annual return of 18.53% per year
- Dual Trend Model With Fundamentals (+Stock/Bond ratio and NYSE HiLo Logic Index) has an average annual return of 18.4% per year
*These returns do not include the S&P 500's dividends reinvested. Including dividends reinvested, average annual returns would be higher.
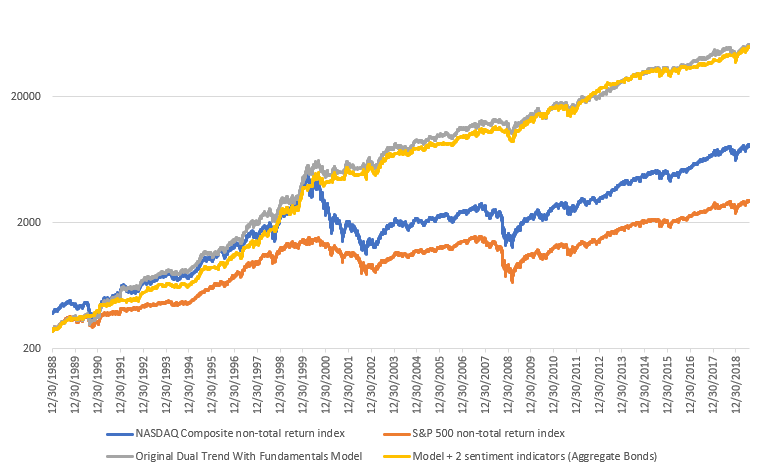
Sharpe ratio
From December 30, 1988 - August 1, 2019:
- The original Dual Trend Model With Fundamentals has a Sharpe ratio of 0.92
- Dual Trend Model With Fundamentals (+Stock/Bond ratio and NYSE HiLo Logic Index) has a Sharpe ratio of 1.02
*These Sharpe ratios are lower than what you might expect, since they do not include the S&P 500's dividends reinvested. Including dividends reinvested, Sharpe would be higher.
Now what if we used the S&P 500's total return data?
Simple Trading Model With Fundamentals + 2 sentiment indicators
Average annual returns
From December 30, 1988 - August 1, 2019:
- The original Simple Trading Model With Fundamentals has an average annual return of 13.98% per year
- Simple Trading Model With Fundamentals (+Stock/Bond ratio and NYSE HiLo Logic Index) has an average annual return of 14.97% per year
Sharpe ratio
From December 30, 1988 - August 1, 2019:
- The original Simple Trading Model With Fundamentals has a Sharpe ratio of 0.81
- Simple Trading Model With Fundamentals (+Stock/Bond ratio and NYSE HiLo Logic Index) has a Sharpe ratio of 0.99
Macro Index Model + 2 sentiment indicators
Average annual returns
From December 30, 1988 - August 1, 2019:
- The original Macro Index Model has an average annual return of 13.38% per year
- Macro Index Model (+Stock/Bond ratio and NYSE HiLo Logic Index) has an average annual return of 14.28% per year
Sharpe ratio
From December 30, 1988 - August 1, 2019:
- The original Macro Index Model has a Sharpe ratio of 0.81
- Simple Trading Model With Fundamentals (+Stock/Bond ratio and NYSE HiLo Logic Index) has a Sharpe ratio of 0.97
Conference Board LEI Model + 2 sentiment indicators
Average annual returns
From December 30, 1988 - August 1, 2019:
- The original Conference Board LEI Model has an average annual return of 13.11% per year
- Conference Board LEI Model (+Stock/Bond ratio and NYSE HiLo Logic Index) has an average annual return of 13.96% per year
Sharpe ratio
From December 30, 1988 - August 1, 2019:
- The original Conference Board LEI Model has a Sharpe ratio of 0.74
- Conference Board LEI Model (+Stock/Bond ratio and NYSE HiLo Logic Index) has a Sharpe ratio of 0.88
*I'm unable to backtest the Dual Trend Model With Fundamentals using total return data since the NASDAQ's total return data history is limited.
Conclusion
Incorporating the Stock/Bond ratio and NYSE HiLo Logic Index adds significant alpha to trading models and increases their Sharpe ratios. These aren't the only sentiment indicators that add alpha - this post seeks to demonstrate that combining several sentiment indicators to different models adds alpha and increases risk-adjusted returns, regardless of which model you apply these sentiment indicators to.