
What I'm looking at - Germany, Smart Money Index, volume-based breadth, oil spike, Equity Put/Call
With the stock market hovering near an all-time high, here's what I'm looking at:
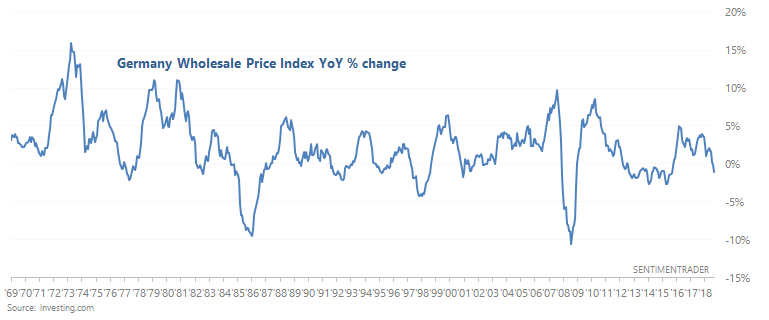
Germany
Germany's economy remains weak. Germany Whole Prices, which measures the value of sales from German wholesalers, have fallen -1.1% year-over-year.
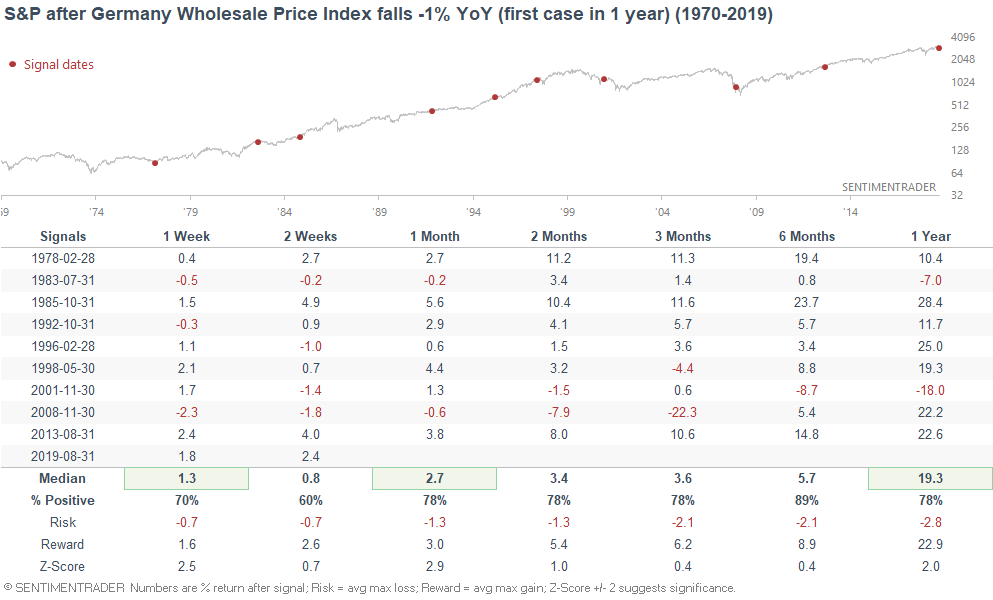
On the surface this may seem bearish for for the German stock market, but it has not always been the case. Here's what happened next to DAX when the Wholesale Price Index fell more than -1% YoY:

This is not consistently bearish for German stocks because there were some false alarms, and sometimes this happened towards the end of a recession and bear market.
For what it's worth, this hasn't been consistently bearish for U.S. stocks either. (In case "contagion" fears arise).
Smart Money Index
As Babak pointed out, the Smart Money Flow Index appears to be making a "divergence" with the stock market. This happened in 2018 as well, before stocks cratered.
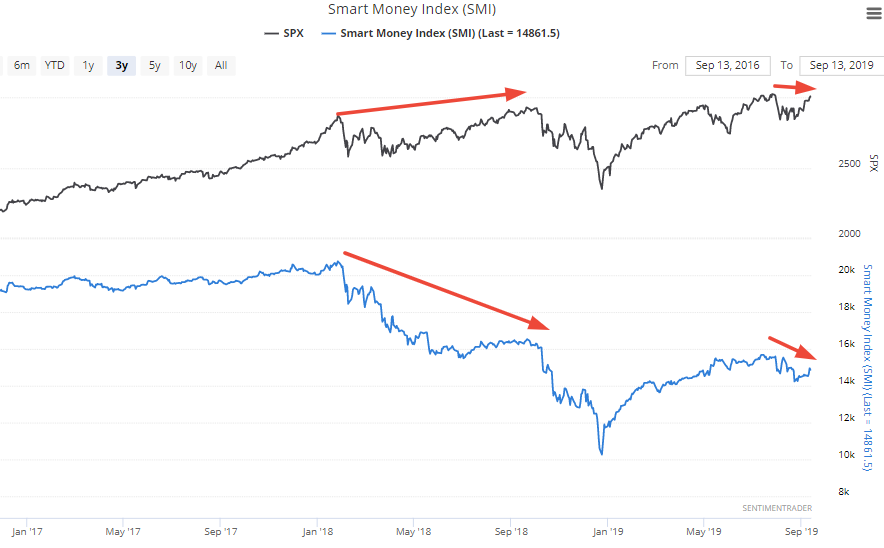
*The Smart Money Flow Index assumes that the "smart money" trades in the last hour of each session and the "dumb money" trades in the first half hour of each session. This assumption is flawed, especially due to the increasing popularity of ETFs. Nevertheless, the Smart Money Flow Index remains popular.
The following chart illustrates what happened next to the S&P after the Smart Money Index fell over the past month while the S&P rallied more than +5%:
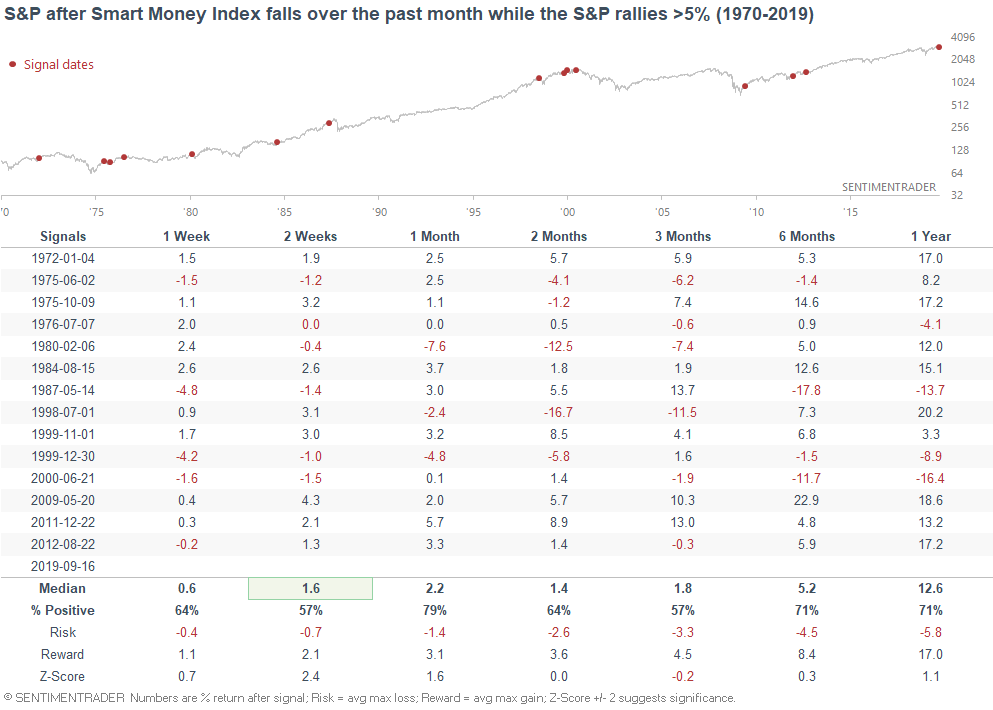
This wasn't incredibly bullish or bearish on any time frame, although the 2 month forward returns were more bullish than random.
Volume & breadth
With the S&P trading near all-time highs after a slump in August, the NYSE Up Volume ratio's 15 day average has gone from under 0.4 to above 0.63. Whereas volume once mostly flowed into issues that were falling, volume is not mostly flowing issues that are rising.
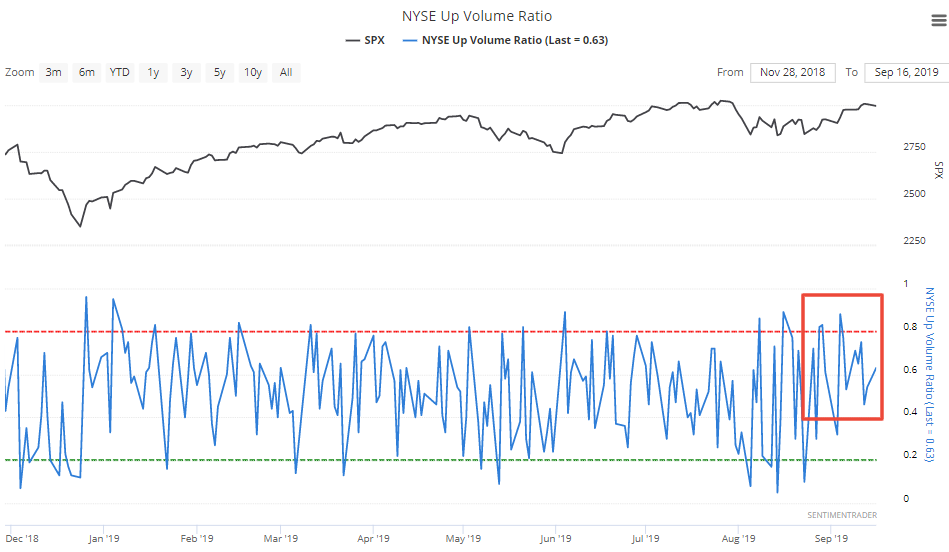
When this happened in the past, the S&P often rallied significantly over the next 6-12 months. Over the past 10 years, this exclusively happened after large stock market declines (e.g. 2009 bear market, 2011/2016/2018 stock market crashes)
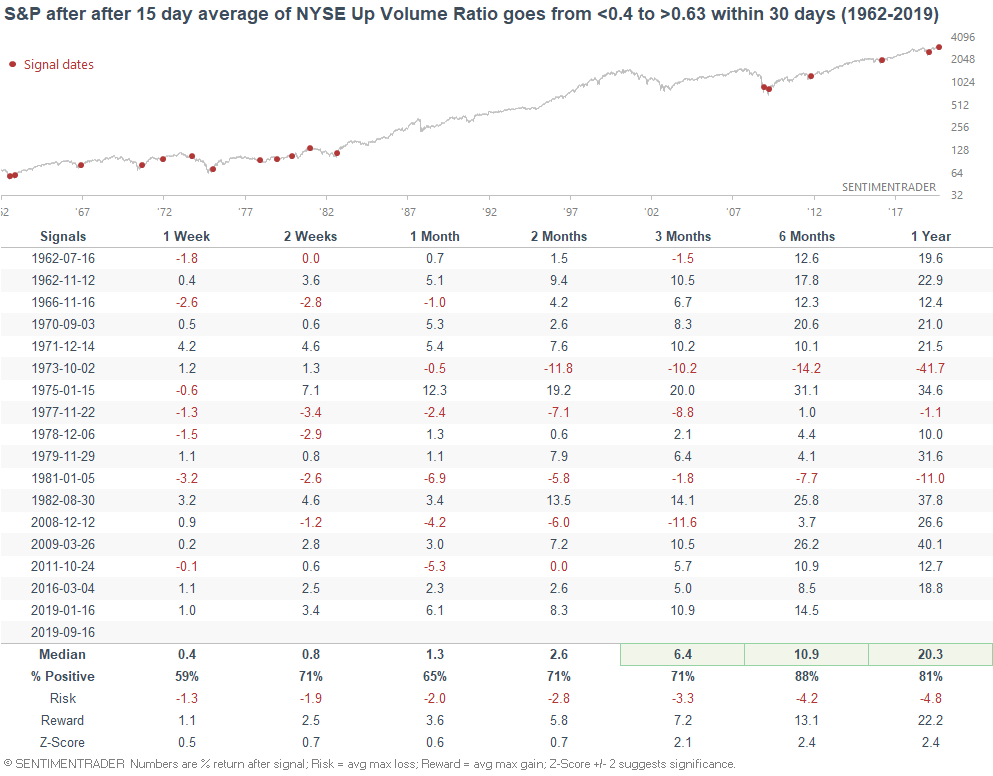
The only 2 historical cases that saw big losses (1973 and 1981) occurred when the economy was about to tip into a recession, which caused inflation-adjusted corporate earnings to slump.
Oil
Oil spiked today, and many commentators said that the spike is not a long term concern for the U.S. economy and stock market. But as usual, there are some commentators who see things in a different light.
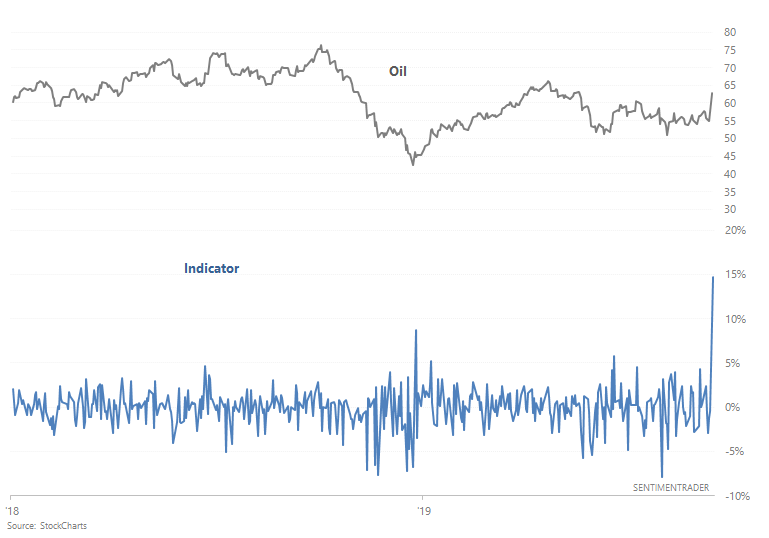
For some, it may be surprising that oil spiked so much but stocks barely fell. So for starters, here's what happened next to the S&P and oil when oil spiked more than 10% in one day:
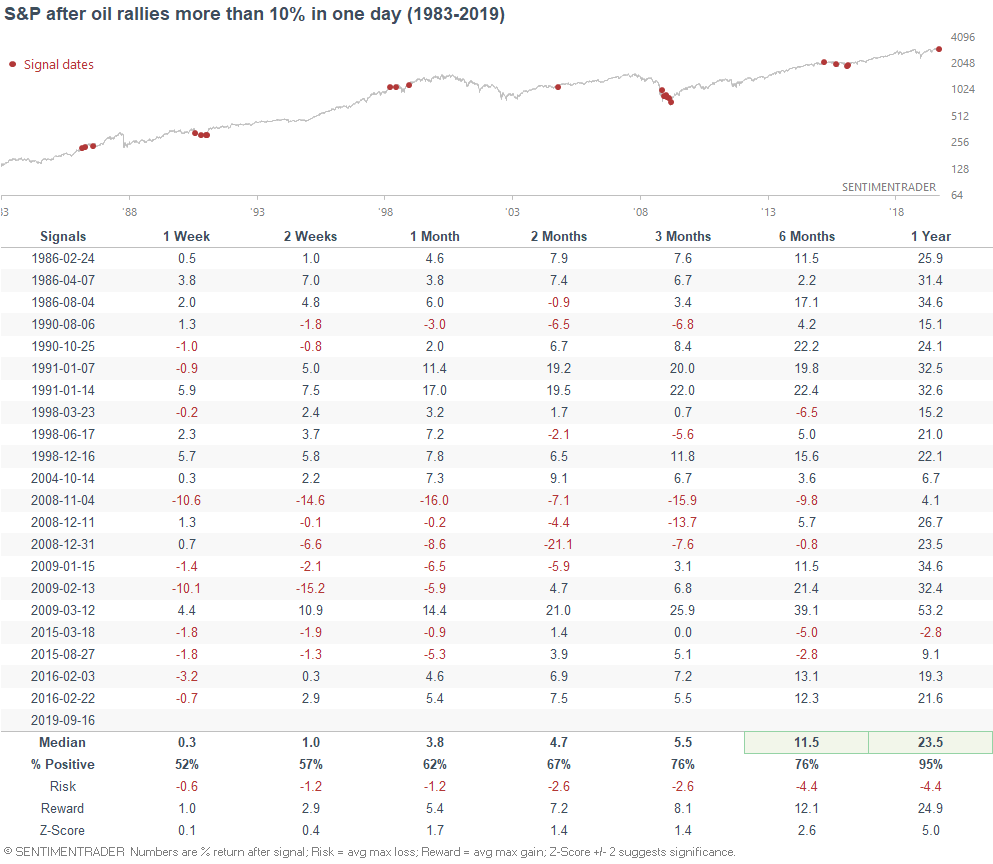
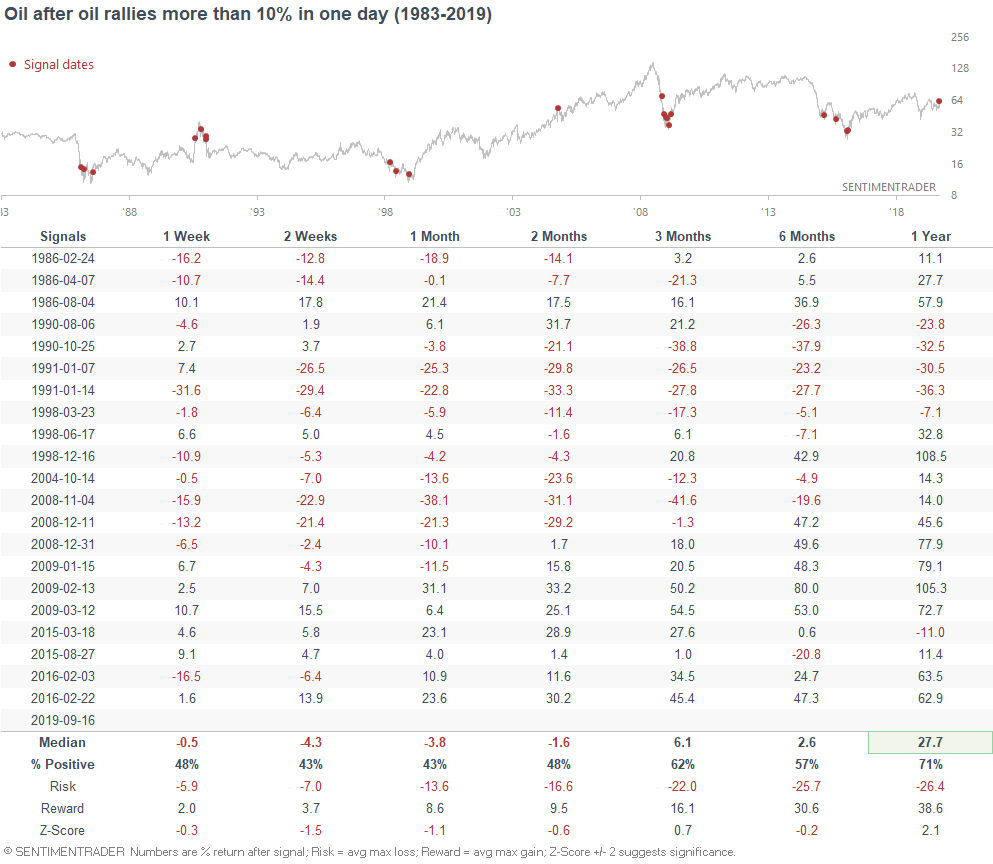
As you can see, a big one-day oil spike has not been consistently bearish for oil over the next 6-12 months. Moreover, it's not particularly rare for oil to spike and stocks to have a muted reaction. 14 of the past 21 historical cases saw oil spike and the S&P move >-0.5% that day.
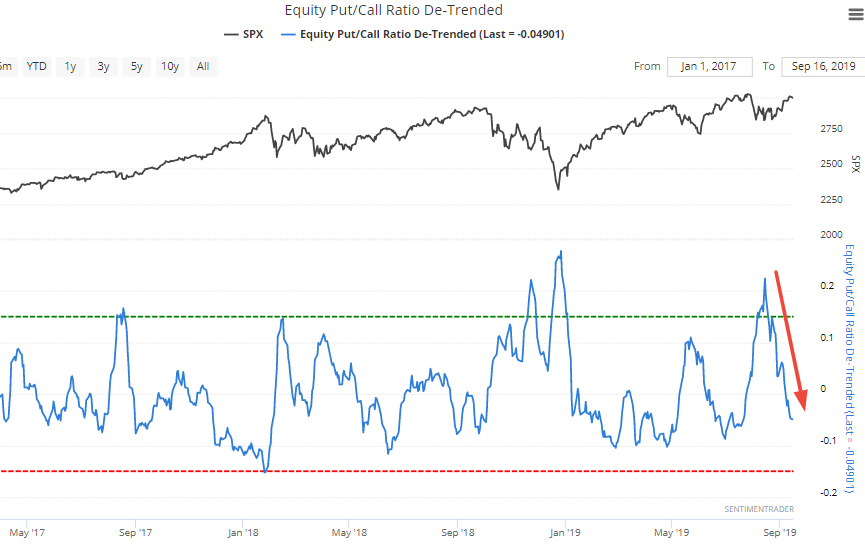
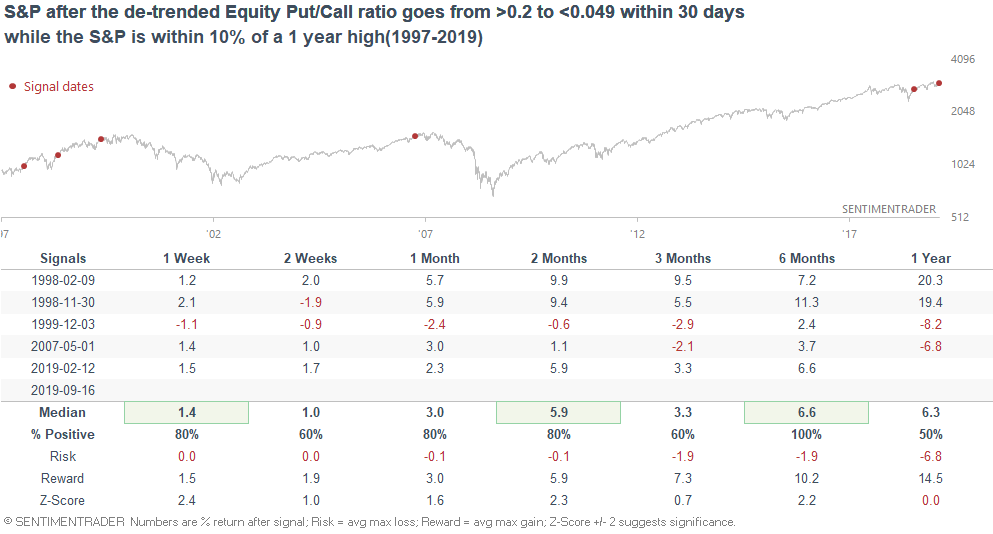
Put/Call
Our stats in August were mostly bullish for the S&P 500 over the next 2-3 months. With the stock market near all-time highs, our 2-3 month forward stats are still mostly bullish, but there are now a few bearish stats in the mix.
The Equity Put/Call ratio (de-trended) has fallen from above 0.2 to below -0.049 in less than 30 days.
Such a quick change in sentiment (at least per the Put/Call ratio) was more bearish than random over the next 3 months for stocks. But this is mostly because many of the historical cases occurred when stocks were in a clear downtrend (e.g. 2001-2002, 2008).
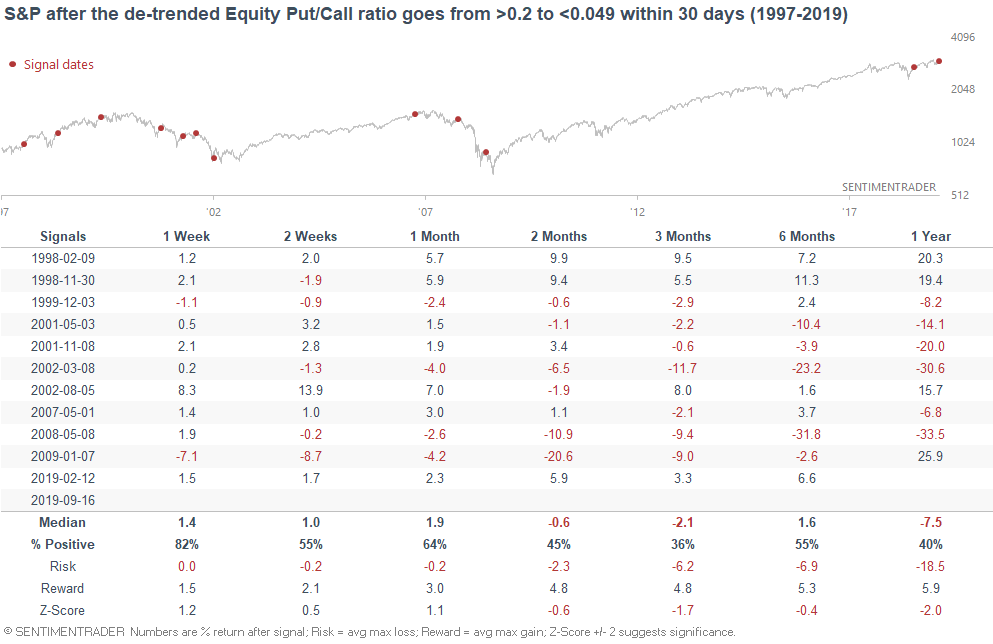
If we only examine the cases that occurred while the S&P is within 10% of a 1 year high, the S&P's forward returns are not as bearish.
Conclusion
From my weekend market overview:
- Long term risk:reward doesn’t favor bulls. Valuations are high, but valuations can remain high for years.
- Fundamentals (6-12 months): still bullish because there is no significant U.S. macro deterioration, but this could change IF macro data deteriorates significantly over the next few months
- Technicals (3-6 months): mostly bullish
- Technicals (1-2 months): no clear edge in either direction