Data &
Technology
Research
Reports
Report Solutions
Reports Library
Actionable
Strategies
Free
Resources
Simple Backtest Calculator
Simple Seasonality Calculator
The Kelly Criterion Calculator
Sentiment Geo Map
Public Research Reports
Free Webinar
Pricing
Company
About
Meet Our Team
In the News
Testimonials
Client Success Stories
Contact
Log inLoginSign up
< BACK TO ALL REPORTS

What I'm looking at - ex U.S. breakouts, Europe, CNN Fear & Greed, commodities, high yield bonds, breadth, put/call

Troy Bombardia
2019-12-18
null

Here's what I'm looking at:


ex-U.S.

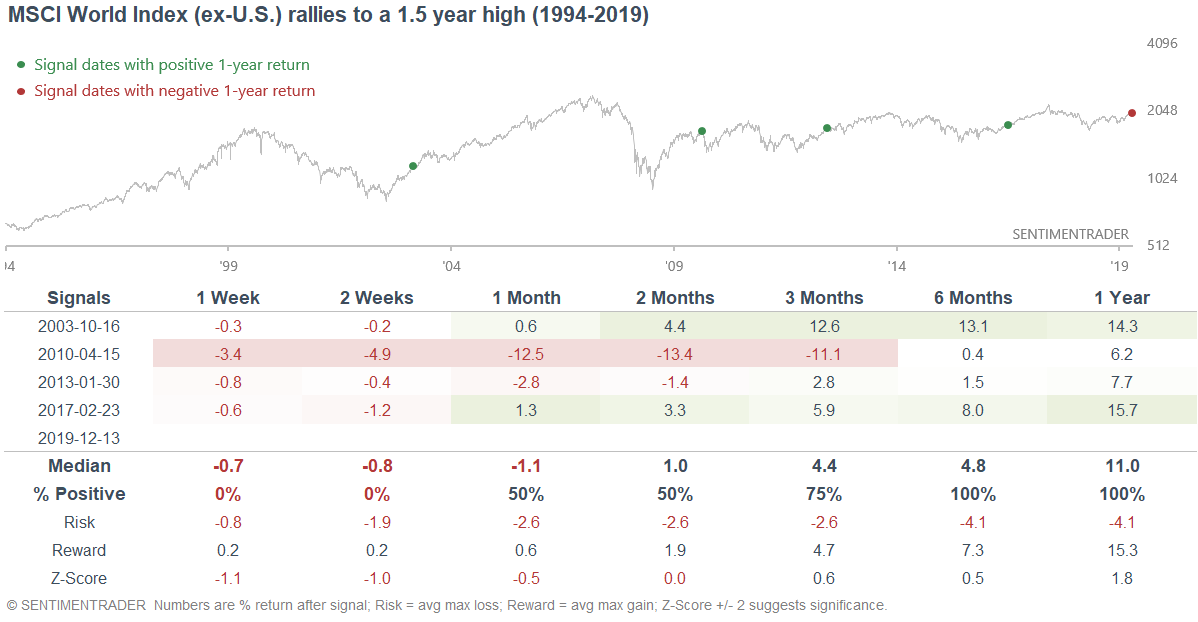
With stocks rallying around the world, various indices continue to breakout above prior resistances. One of these is the MSCI World Index (ex-U.S.), which has just made a 1.5 year high:

When it did so in the past, this index may have faced short term losses, but typically rallied over the next 6-12 months:

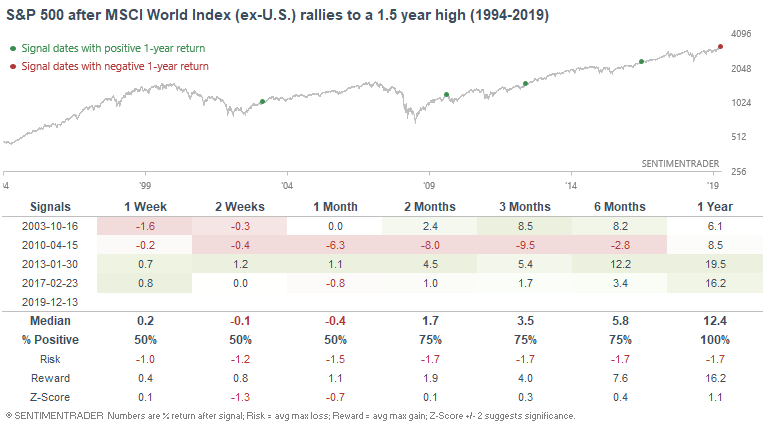
Here's what the S&P 500 did next:


Europe

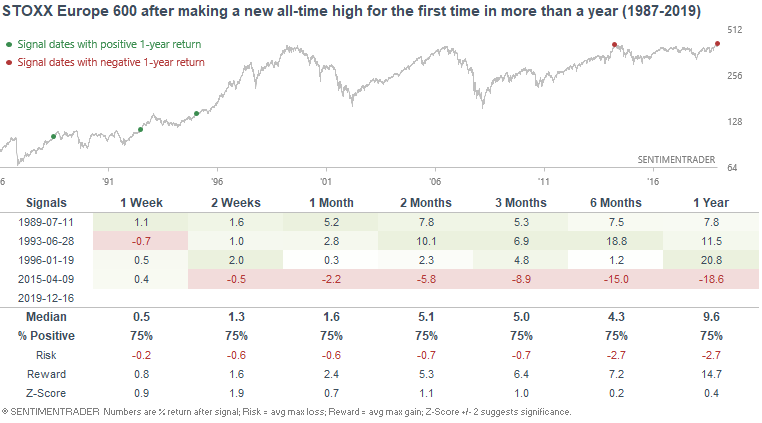
The STOXX Europe 600, which encompasses 90% of European stock market's market cap, recently made a new all-time high for the first time since 2015:

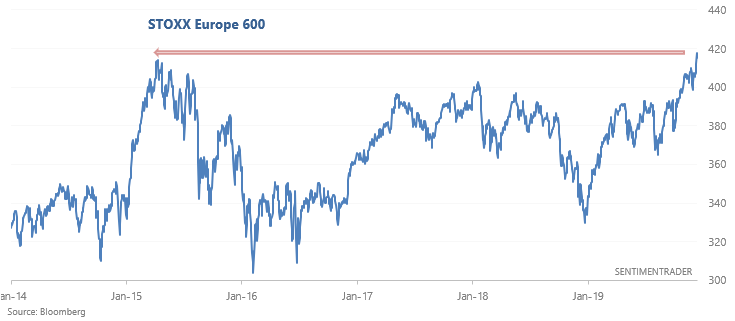
However, breakouts haven't always worked for the STOXX Europe 600. The last all-time high breakout failed miserably, with global stock markets swinging sideways amidst massive corrections over the next 9 months:


Sentiment

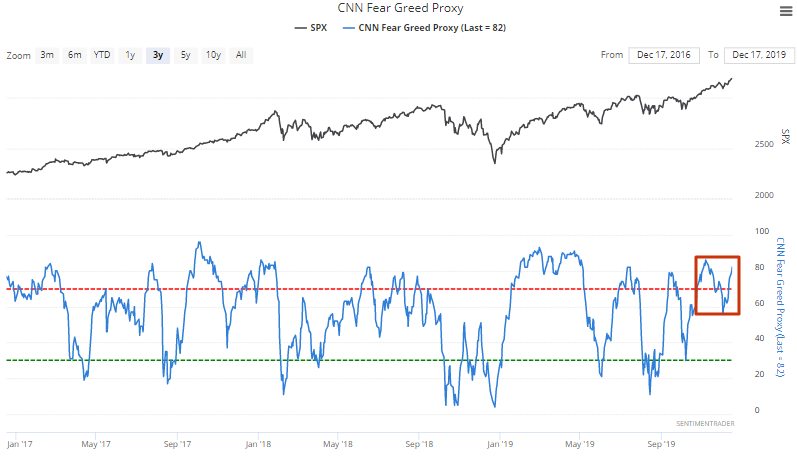
The popular CNN Fear & Greed Index remains elevated with the stock market's recent rally, and has now spent 46 days above 50 (center-line). Sentiment remains excessively optimistic, which is a feature of year-long bull markets but is short term bearish for stocks:

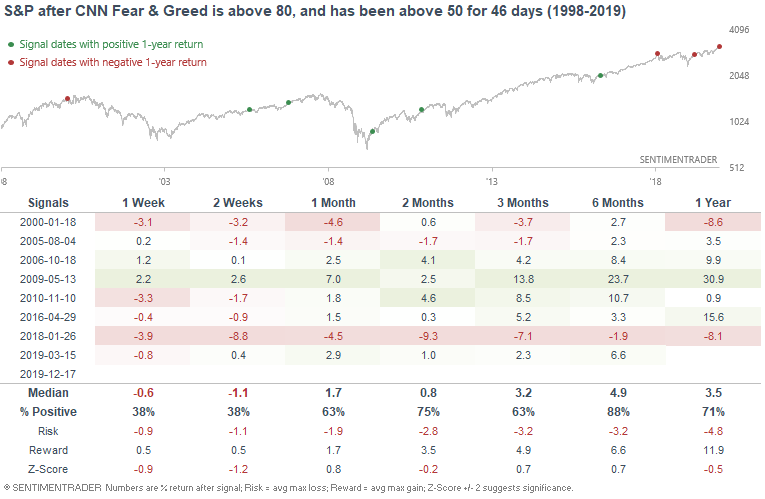
When sentiment was elevated for a long time according to the Fear & Greed Index, the S&P's returns over the next 2 weeks were below average:


Commodities

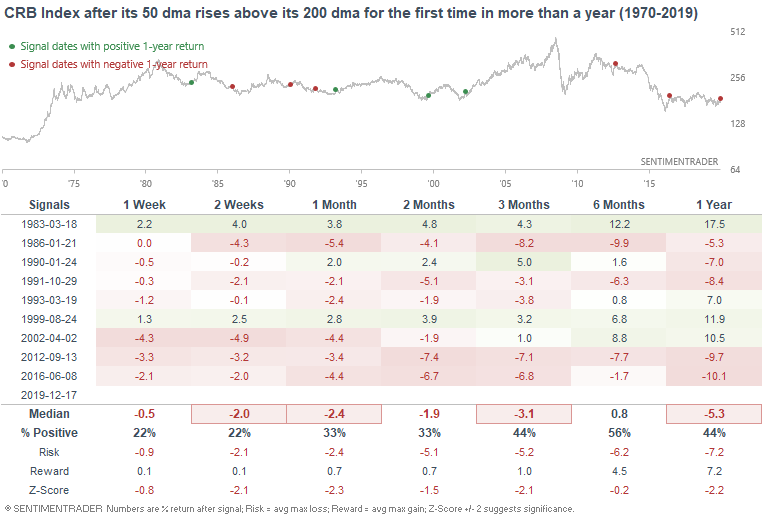
After trending downwards throughout much of 2018 and 2019, commodities are finally starting to turn around. The CRB Index has broken out to multi-month highs, and its 50 dma has crossed its 200 dma for the first time in more than 1 year:

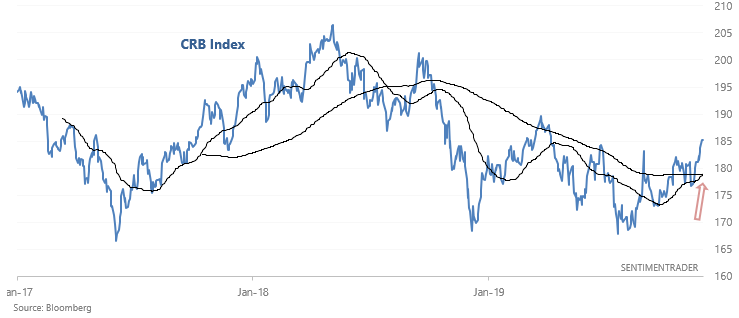
But when long downtrends in commodities first appeared to "end", that wasn't usually the end. The first "golden cross" in more than a year was typically followed by weakness in commodities over the next few weeks and months:


High yield bonds

High yield bonds have surged recently, pushing HYG's (High Yield Corporate Bond ETF) 14 day RSI above 78:


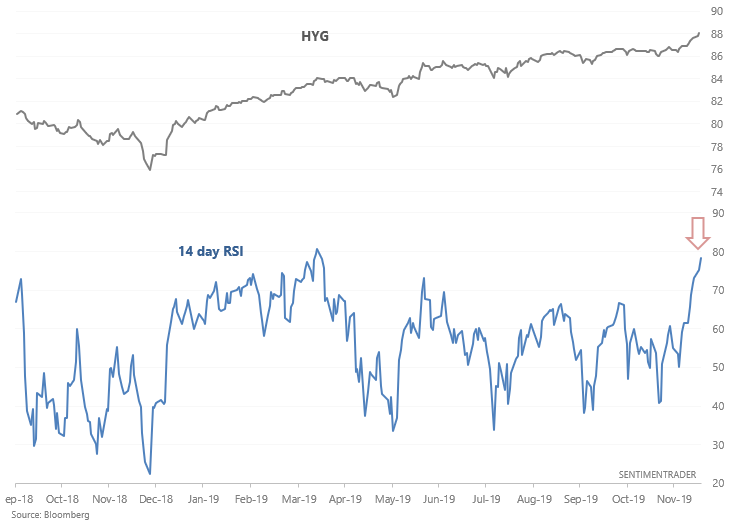
When HYG's momentum was this high, it almost always struggled over the next few weeks. And since high yield corporate bonds sometimes move inline with the stock market, this wasn't too good for stocks over the next few weeks either:

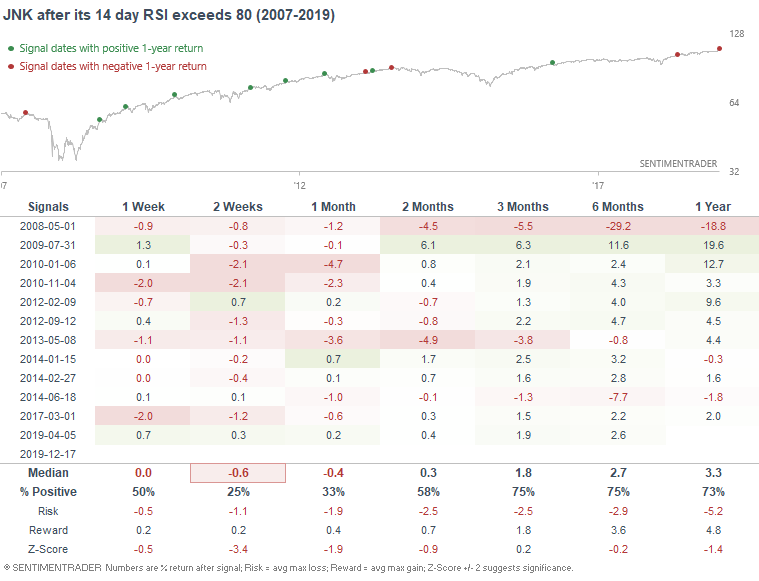
Similarly, JNK's RSI is extremely high:

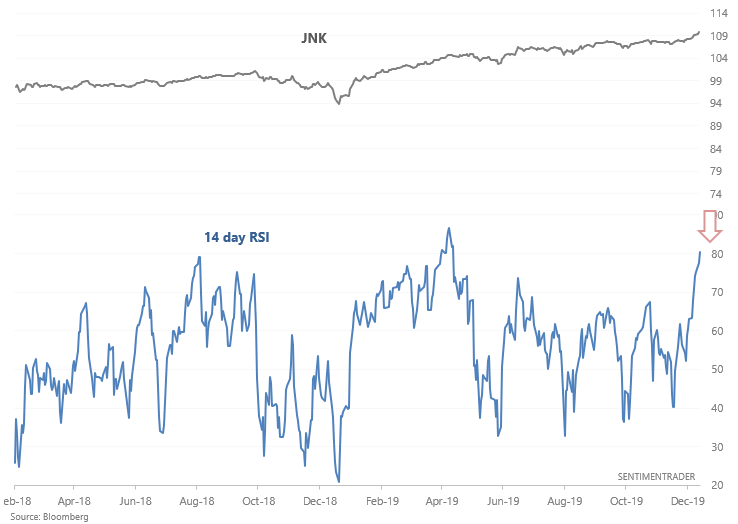
This was bearish for JNK over the next 2-4 weeks:


Breadth

The U.S. stock market continues to rally relentlessly, pushing the % of its components that are above their 200 dma's (in a long term uptrend) to more than 80%:

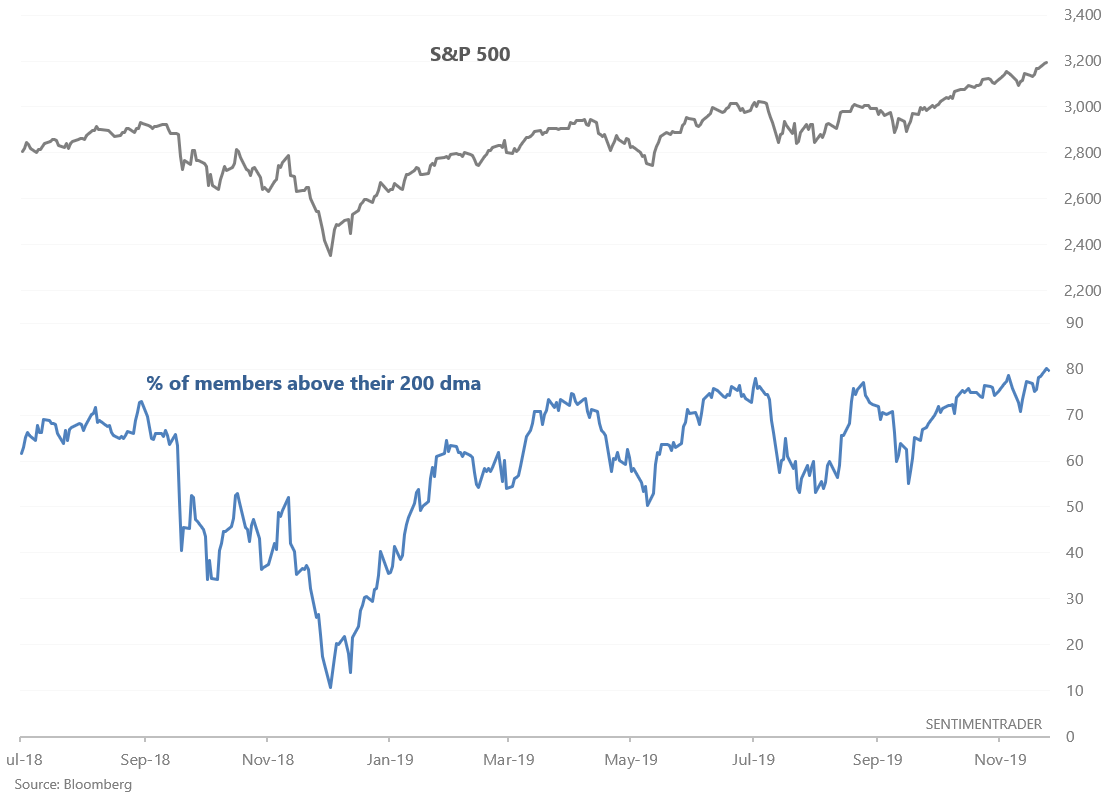
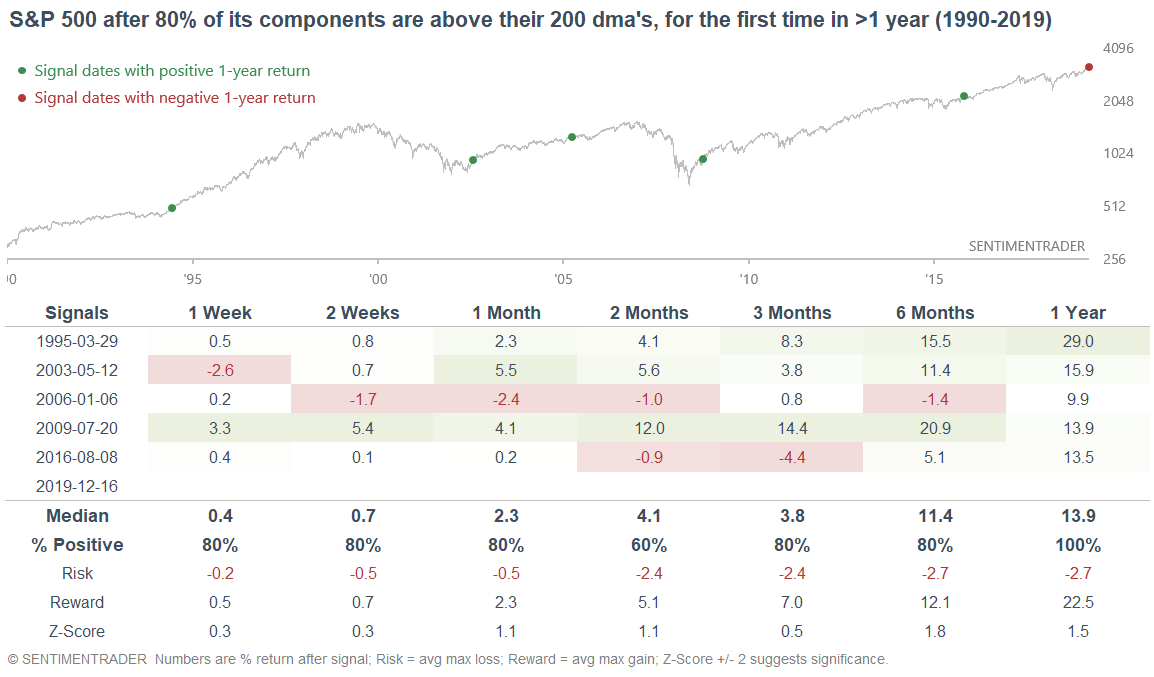
When the vast majority of its components were in an uptrend for the first time in more than a year, the S&P's gains over the next year were almost double of their historical average:
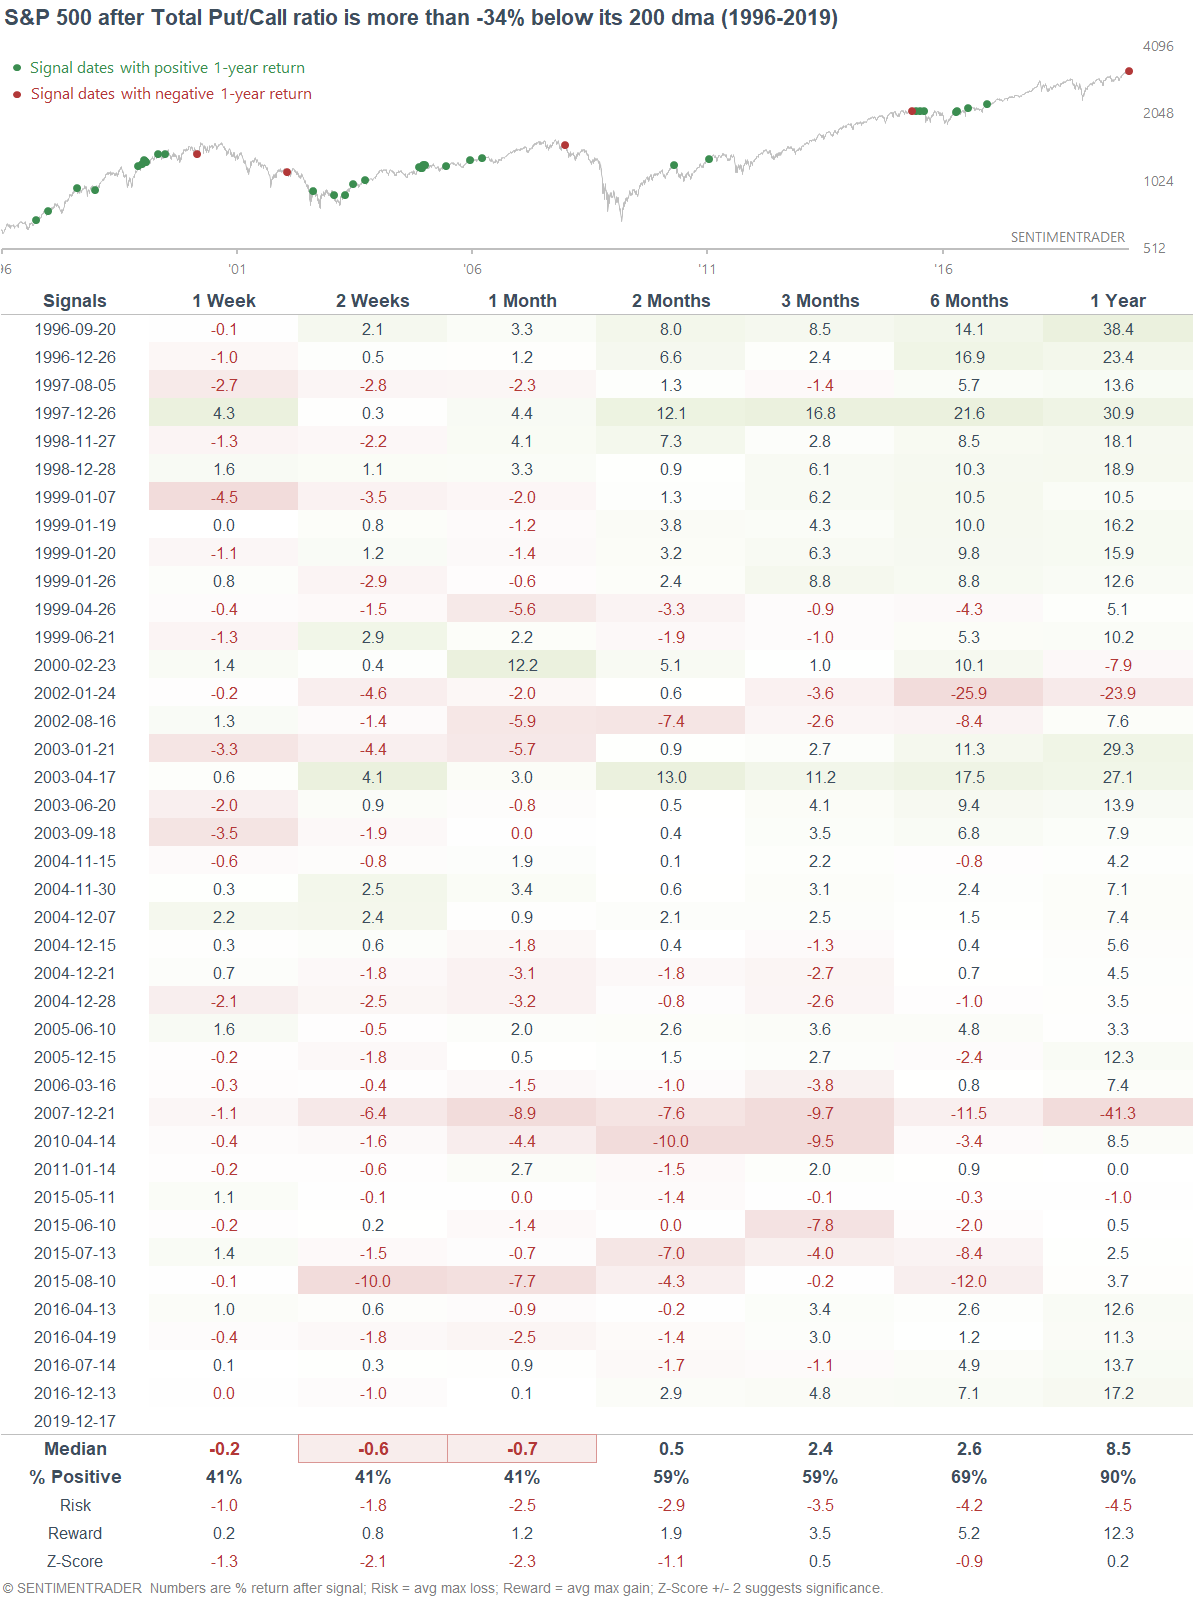

Put/Call

And lastly, the Put/Call ratio tanked yesterday:

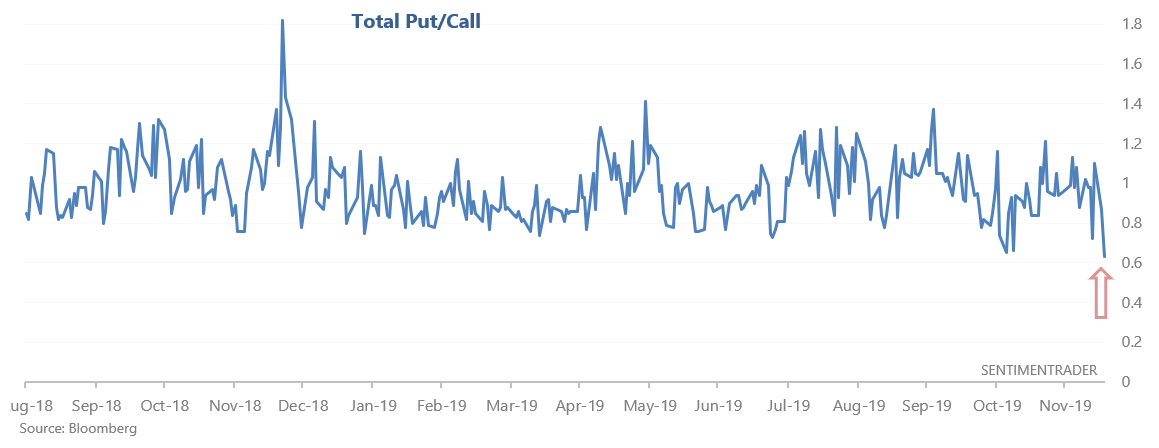
Extremely low readings were typically followed by weakness in the S&P 500 over the next 2-4 weeks:

Sorry, you don't have access to this report

Upgrade your subscription plan to get access
Go to Dasboard
DATA &
TECHnologies
IndicatorEdge
‍
BackTestEdge
‍
Other Tools
‍
DataEdge API
RESEARCH
reports
Research Solution
‍
Reports Library
‍
actionable
Strategies
Trading Strategies
‍
Smart Stock Scanner
‍
FREE
RESOUrCES
Simple Backtest
Calculator
Simple Seasonality
Calculator
The Kelly Criterion
Calculator
Sentiment Geo Map
‍
Public Research Reports
‍
Free Webinar
COMPANY
‍
About
‍
Meet our Team
‍
In the News
‍
Testimonials
‍
Client Success Stories
Pricing
Bundle pricing
‍
Announcements
‍
FAQ
© 2024 Sundial Capital Research Inc. All rights reserved.
Setsail Marketing
TermsPrivacyAffiliate Program
Risk Disclosure: Futures and forex trading contains substantial risk and is not for every investor. An investor could potentially lose all or more than the initial investment. Risk capital is money that can be lost without jeopardizing ones’ financial security or life style. Only risk capital should be used for trading and only those with sufficient risk capital should consider trading. Past performance is not necessarily indicative of future results.

Hypothetical Performance Disclosure: Hypothetical performance results have many inherent limitations, some of which are described below. No representation is being made that any account will or is likely to achieve profits or losses similar to those shown; in fact, there are frequently sharp differences between hypothetical performance results and the actual results subsequently achieved by any particular trading program. One of the limitations of hypothetical performance results is that they are generally prepared with the benefit of hindsight. In addition, hypothetical trading does not involve financial risk, and no hypothetical trading record can completely account for the impact of financial risk of actual trading. for example, the ability to withstand losses or to adhere to a particular trading program in spite of trading losses are material points which can also adversely affect actual trading results. There are numerous other factors related to the markets in general or to the implementation of any specific trading program which cannot be fully accounted for in the preparation of hypothetical performance results and all which can adversely affect trading results.

Testimonial Disclosure: Testimonials appearing on this website may not be representative of other clients or customers and is not a guarantee of future performance or success.