What I'm looking at - equity Put/Call, low volatility, relentless momentum, low volume, Brazil
Here's what I'm looking at:
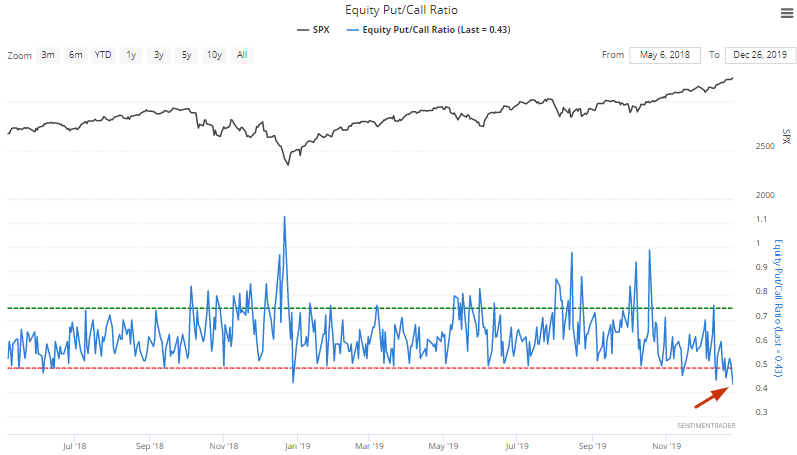
Equity Put/Call
With stocks rallying day after day, the Equity Put/Call ratio has been pushed to its lowest level since June 2014:
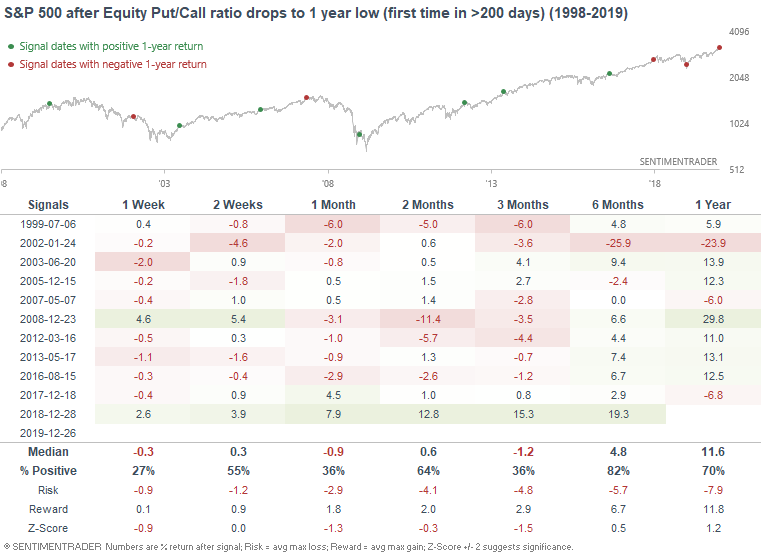
When the equity Put/Call ratio made a 1 year low, the S&P's returns over the next 1-3 months were quite poor. The only real bullish case came last year as stocks began a massive rally. But it's hard to compare today's market vs. that of vs. late-December 2018, so I don't think that historical case applies to today. Stocks were extremely oversold last year, so a powerful mean-reversion spike was to be expected. The opposite is true today with equity markets have already surged.
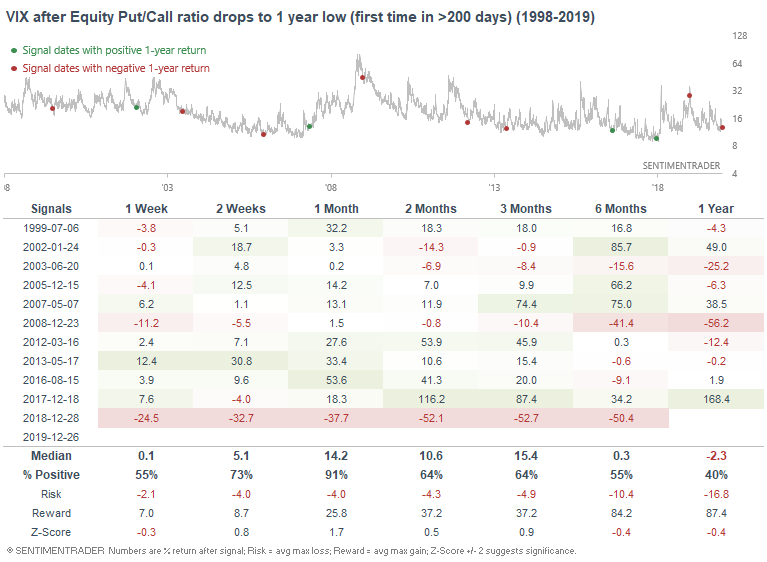
As one would expect, VIX almost always spiked 1 month after these events. Once again, the only case in which VIX did not spike was last December, after VIX had already surged. Today, volatility has been subdued for a long time:
Low volatility
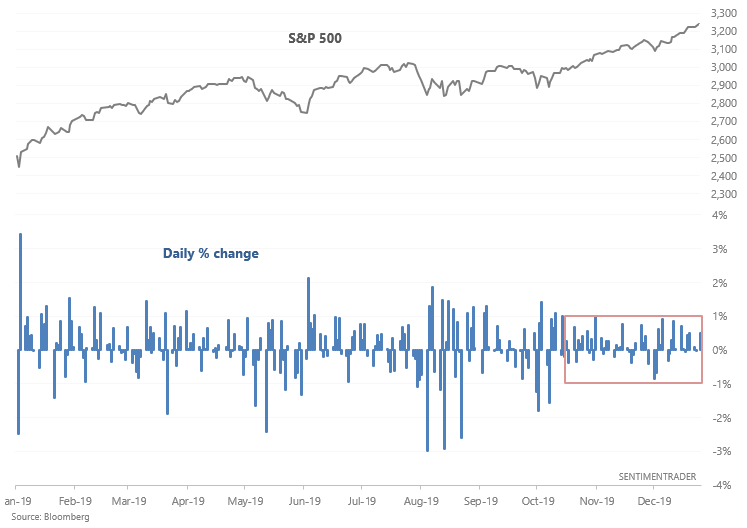
Q4 2019 has been exceptionally quiet, which stands in stark contrast with Q4 2018. What a difference 1 year can make. The S&P has thusfar gone 52 day without a +/- 1% daily move.
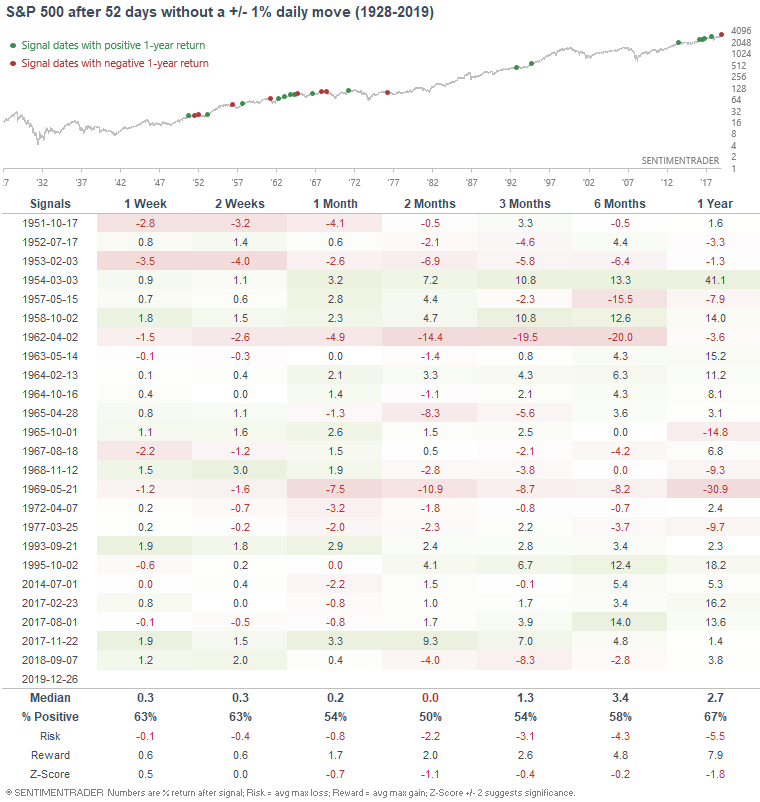
When these streaks of low volatility became this long, the S&P's returns over the next 2 months were worse than average.
Relentless momentum
We've covered quite a few short term negatives for the stock market, but the one thing that goes against this is momentum. And thusfar, the momentum has been relentless. This is truly a battle between sentiment extremes and momentum. Sentiment wins more often than not, but not always (see 2017).
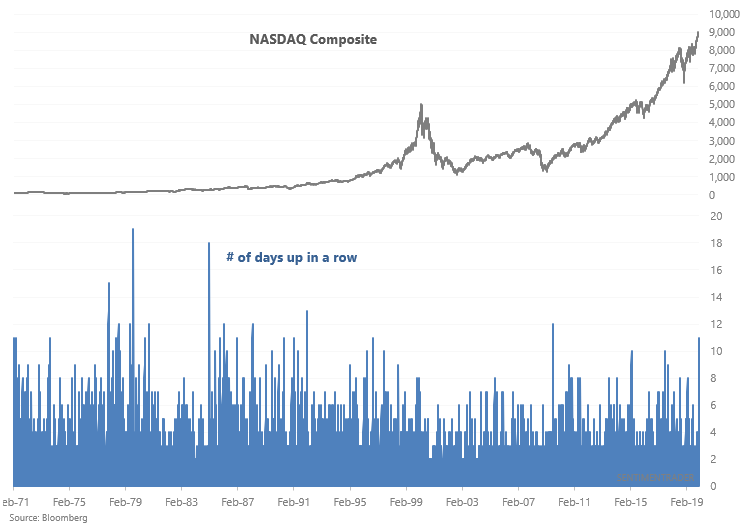
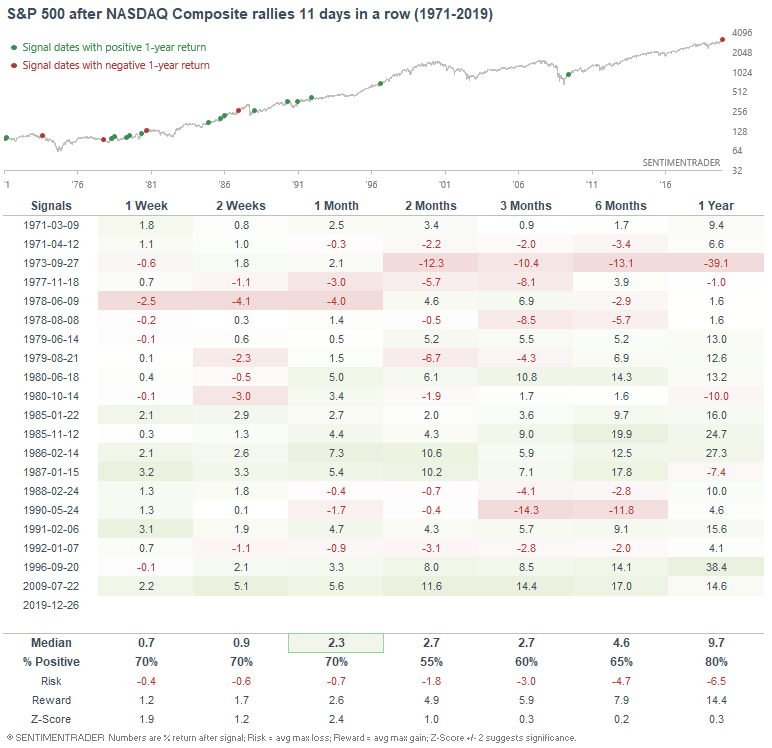
For example, the NASDAQ Composite is now up 11 days in a row. This is the longest streak in years, and to find historical cases besides the most recent case, you'd have to go back more than 2 decades:
The following table illustrates what happened next to the NASDAQ Composite after it rallied 11 days in a row:
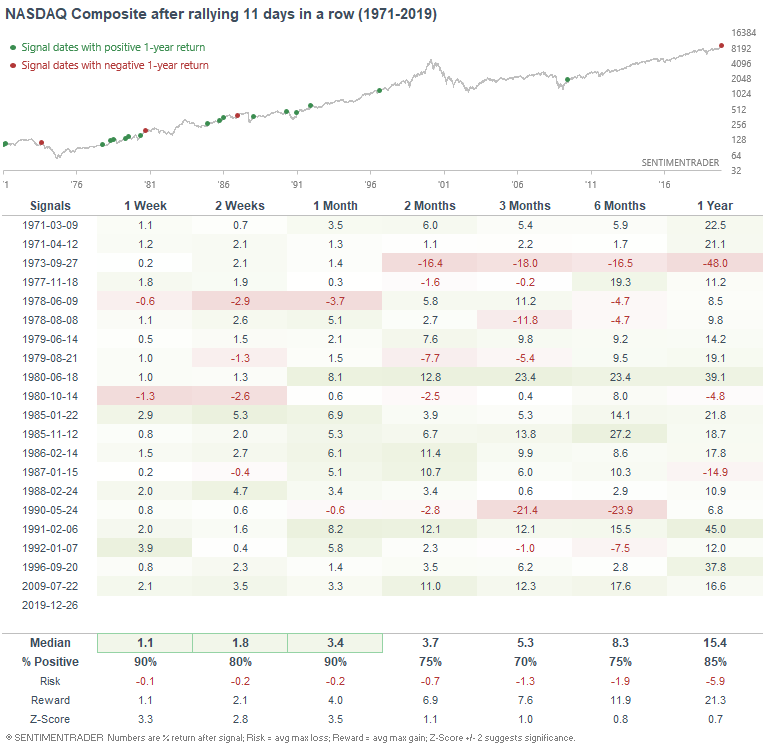
The NASDAQ had a strong tendency to rally over the next month. Granted, most of these historical cases occurred decades ago, so perhaps this signal is less valid than it used to be. Here's what the S&P did next:
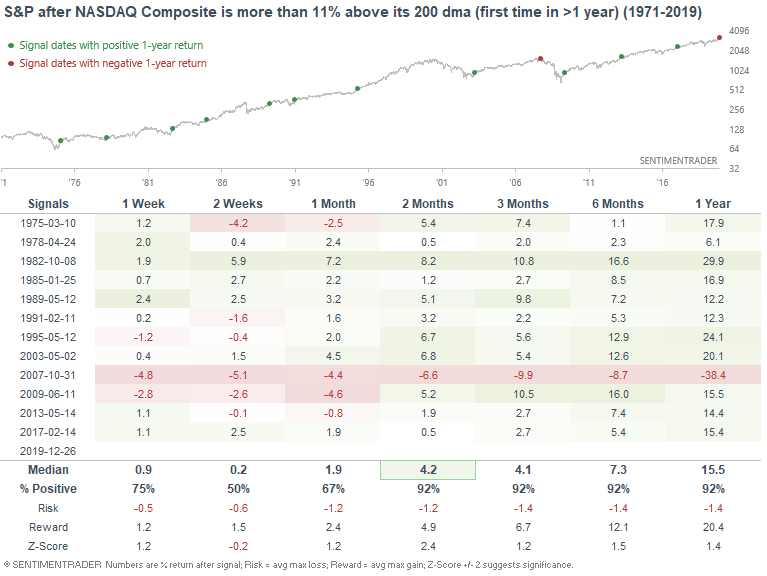
And as Zerohedge noted, the NASDAQ Composite is now more than 11% above its 200 dma.
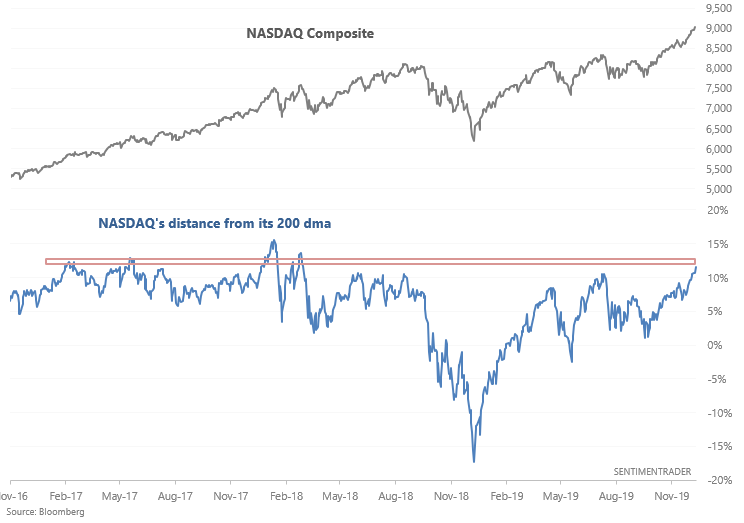
But this isn't terribly extreme if you look at a longer term chart. The NASDAQ can deviate far more from its 200 dma before it makes a significant correction.
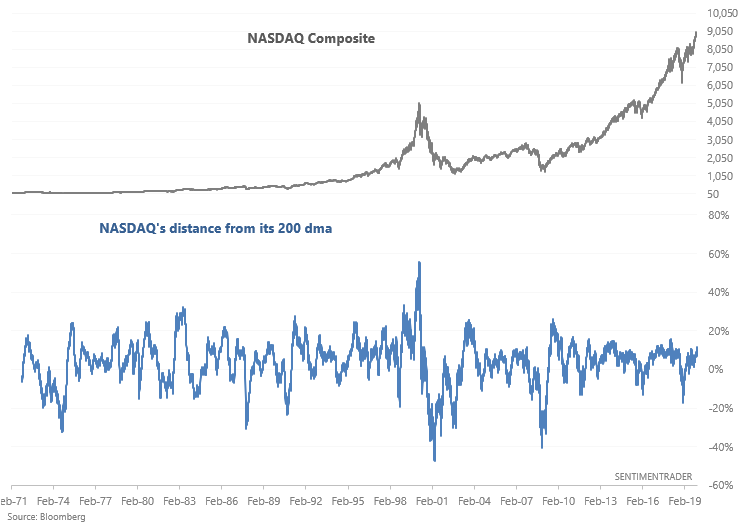
If we look at cases in which the NASDAQ Composite became more than 11% above its 200 dma for the first time in >1 year, the NASDAQ Composite almost always rallied over the next few months and year. Granted, the single failure was quite extreme (at the 2007 top).
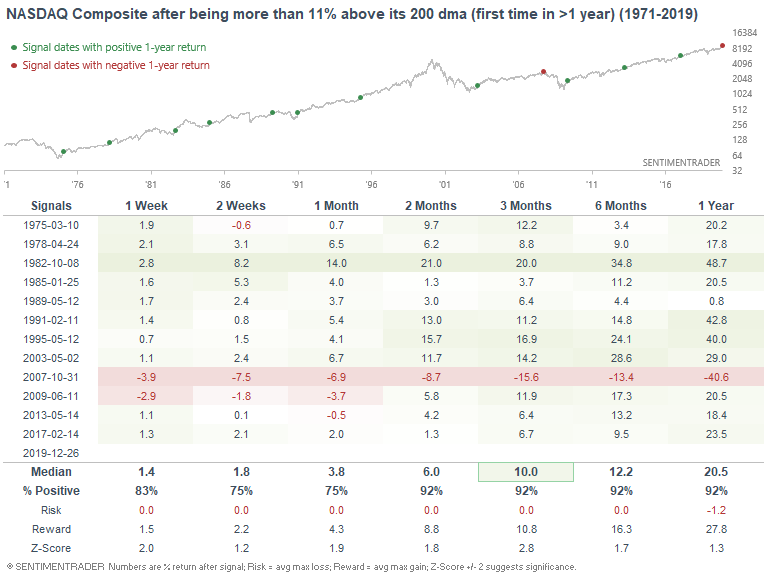
Here's what the S&P did next:
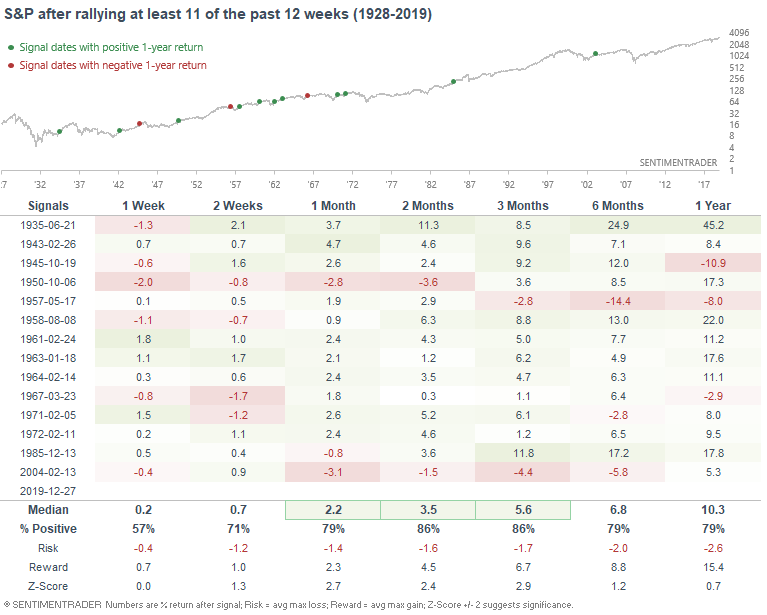
And continuing on a note from last week, the S&P is on track to have rallied 11 of the past 12 weeks. When it did so in the past, it had a strong tendency to rally over the next 1-3 months. But then again, most of these historical cases occurred long ago, so perhaps they aren't as valid anymore.
Low volume
Traders usually look at volume for clues as to what price will do next. Personally, I have not been able to incorporate volume into S&P 500 models in a manner that generates additional alpha. Jason also noted this 2 months ago, and concluded "Low volume is just not a consistently negative influence on future returns."
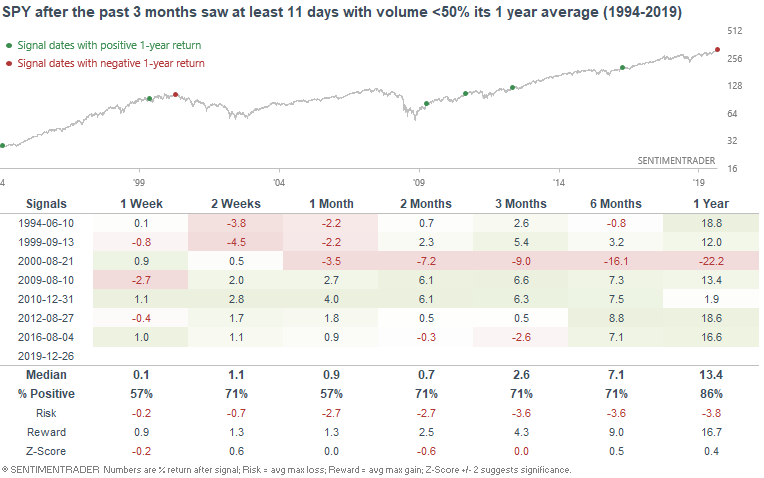
With that being said, there have been quite a few days with extremely low volume recently. 11 days in the past 3 months have seen SPY volume more than 50% below its 1 year average.
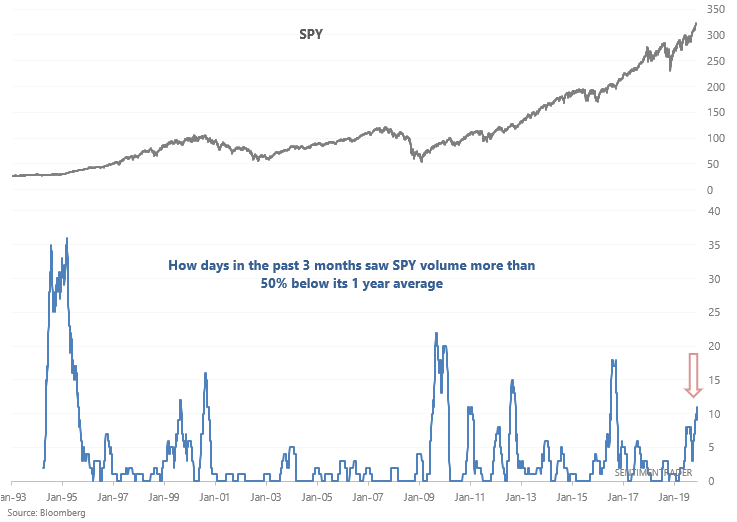
Is this a consistently bearish factor for stocks? Not quite. Moreso it tends to just occur around summer or the holiday season.
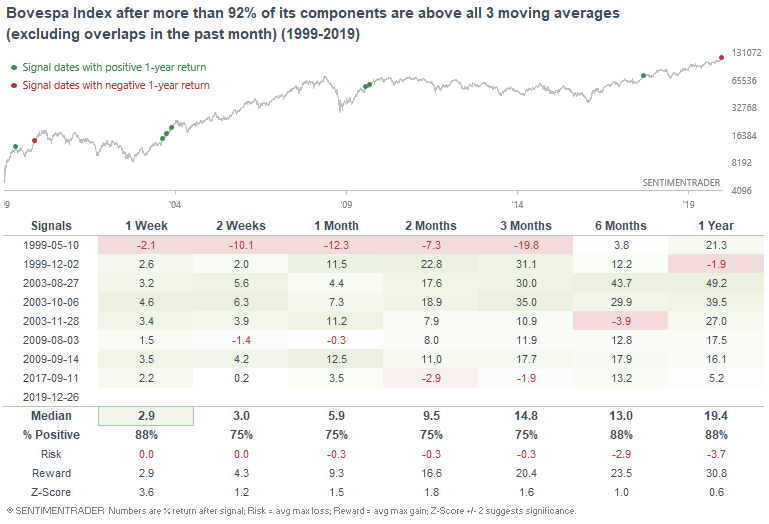
Brazil
Emerging markets have been on fire recently. More than 92% of Brazil's Bovespa Index's components are above their 10 dma, 50 dma, and 200 dma. When this happened in the past, the Bovespa Index had a strong tendency to rally further over the next week.