What I'm looking at - down days, cyclicals vs. defensives, NAAIM, Russia
Here’s what I’m looking at:
Down days
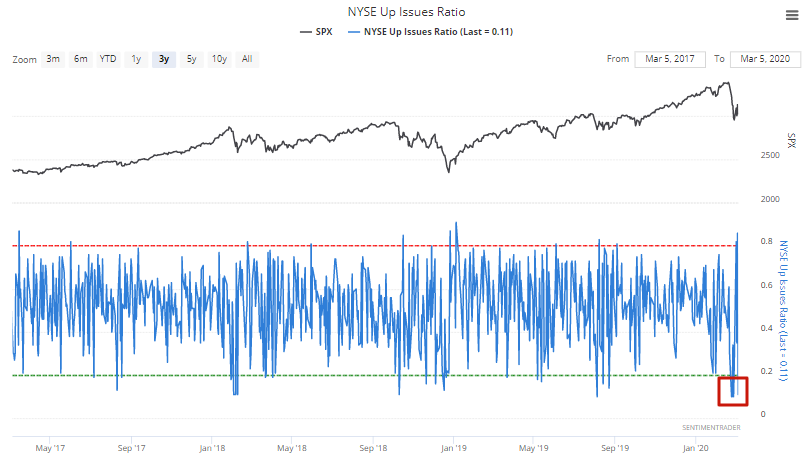
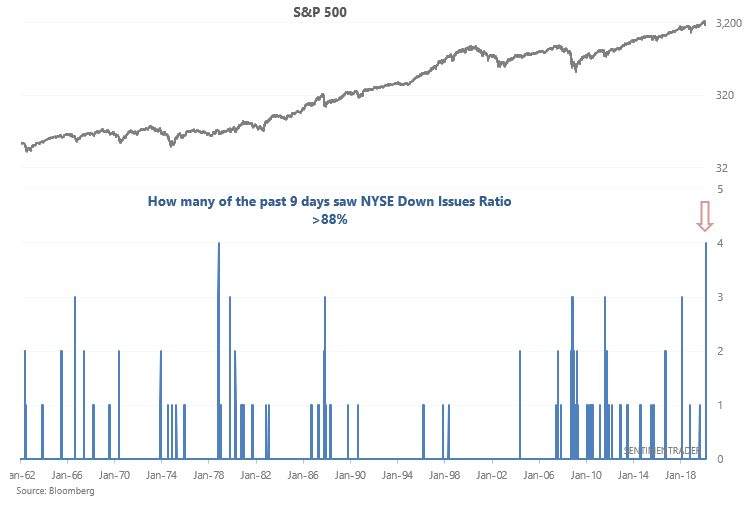
The past few sessions have seen many all-or-nothing days, with no overall clear direction. If we just look at days on which the S&P 500 fell, we can see that 4 of the past 9 days have seen more than 88% of NYSE volume flowing into issues that fell:
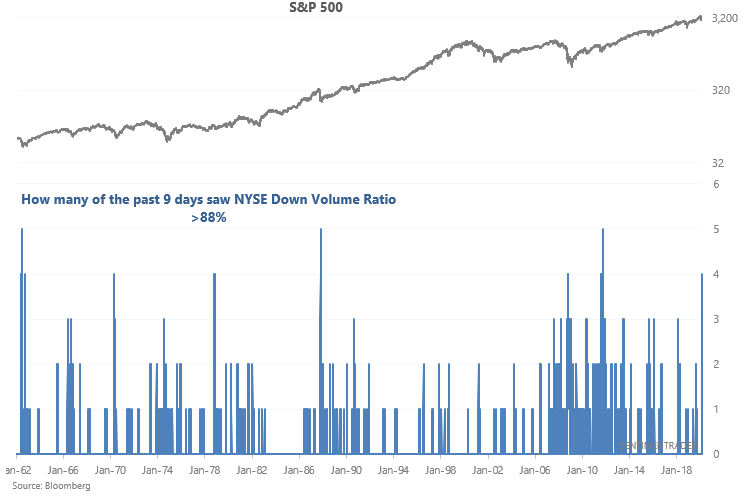
Such extreme anxiety in the markets has only been matched several other times from 1962-present. Perhaps the anxiety is "due to coronavirus". Personally, I find the media's attribution of the market's daily movements to "coronavirus" to be a little silly. Headlines over the past few days have been on a loop:
- "Market falls on renewed coronavirus fears"
- "Market rallies on easing coronavirus fears"
- "Market falls on renewed coronavirus fears"
- "Market rallies on easing coronavirus fears"
- "Market falls on renewed coronavirus fears"
- "Market rallies on easing coronavirus fears"
When the market saw this many days of extreme selling in the past, it wasn't a clear short term bullish sign. Sometimes the market fell more over the next few weeks, and sometimes the market bottomed immediately. Predicting exact tops and bottoms is difficult, particularly during periods of market panic. But overall, this was clearly bullish for equities over the next 6-12 months.
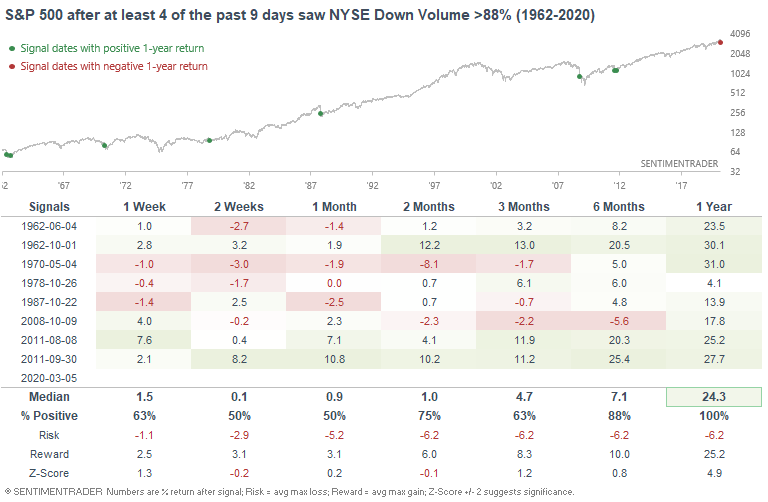
The case could be made that since more and more individual issues tend to move together due to the rising popularity of ETFs, what counts as "extreme" today is not the same as what was "extreme" 50 years ago (when this signal marked bear market bottoms). Perhaps that's true. But if that's the case, then such extreme selling should at least mark a medium term bottom this time, even if the market eventually rolls over into a bear market.
Similarly, 4 of the past 9 days have seen at least 88% of NYSE Issues fall. Hard to find many precedents in history:
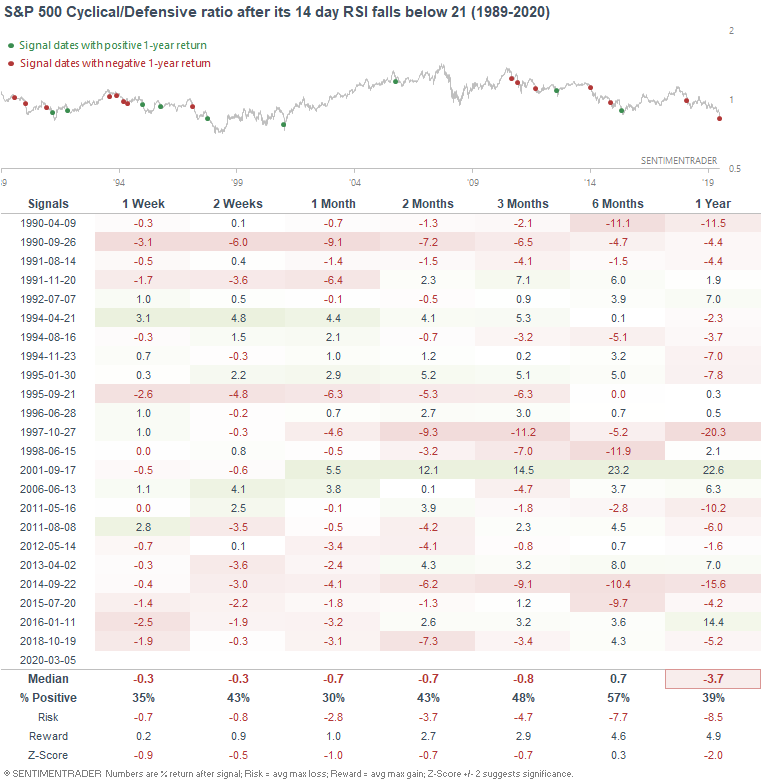
Cyclicals vs. defensives
As Eric Basmajian noted, cyclical sectors have crashed relative to defensive sectors during the current stock market correction. Part of this is due to the stock market's crash 2 weeks ago. But as the overall stock market stabilized over the past week (despite enormous volatility), defensive sectors have rallied much more than cyclical sectors. This has caused the S&P 500 Cyclical:Defensive sector ratio to keep falling.
- Cyclical sectors = consumer discretionary, materials, industrials, financials
- Defensive = healthcare, consumer staples, utilities, real estate
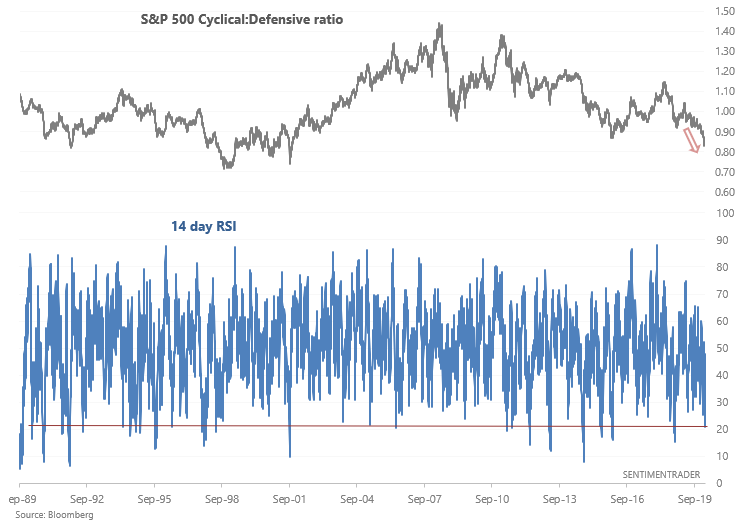
The cyclical vs. defensive ratio's 14 day RSI is quite low right now. When this happened in the past, the S&P 500's short term returns were mixed (and recent cases haven't been bullish either!). But from a longer term perspective (6-12 months), this usually led to more gains for the S&P 500.
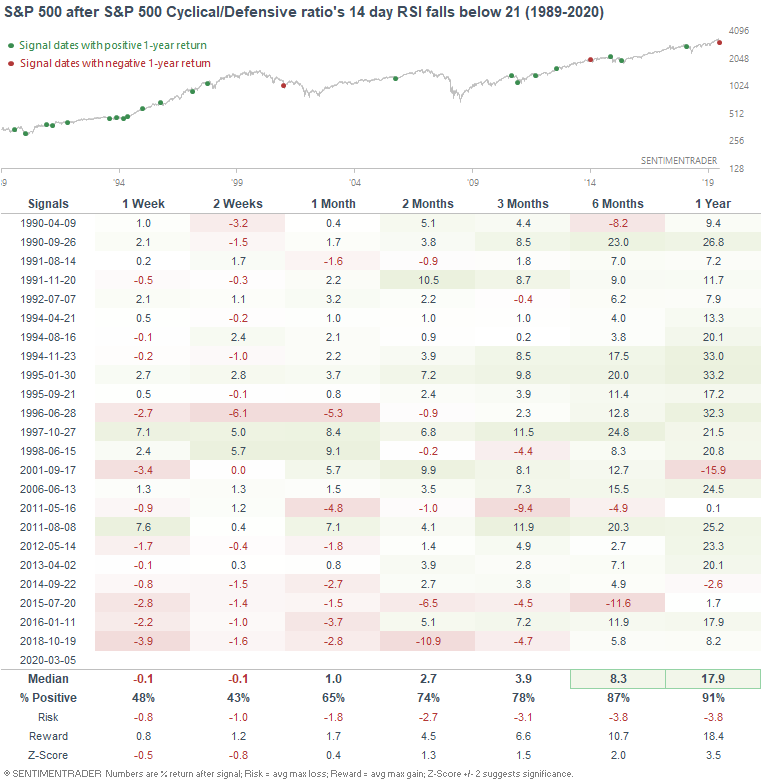
In the meantime, cyclicals often continued to underperform defensives over the next month. This has been particularly true over the past 10 years:
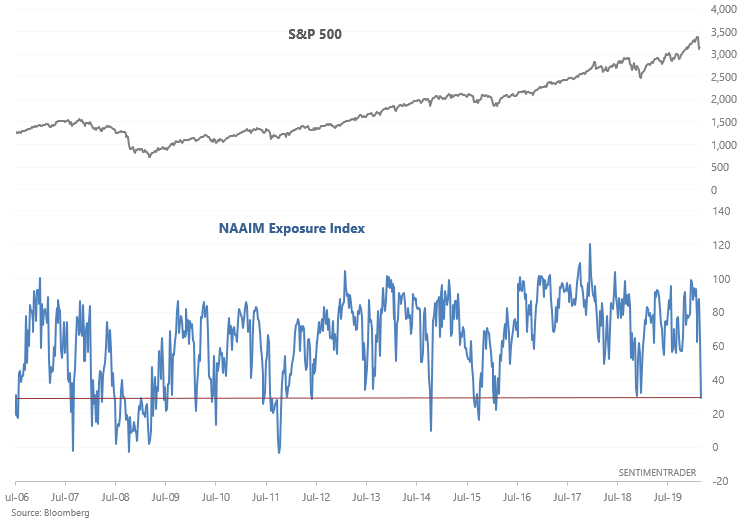
NAAIM
The latest reading for the NAAIM Exposure Index saw a massive drop from the previous week's reading, which was to be expected given the recent stock market crash:
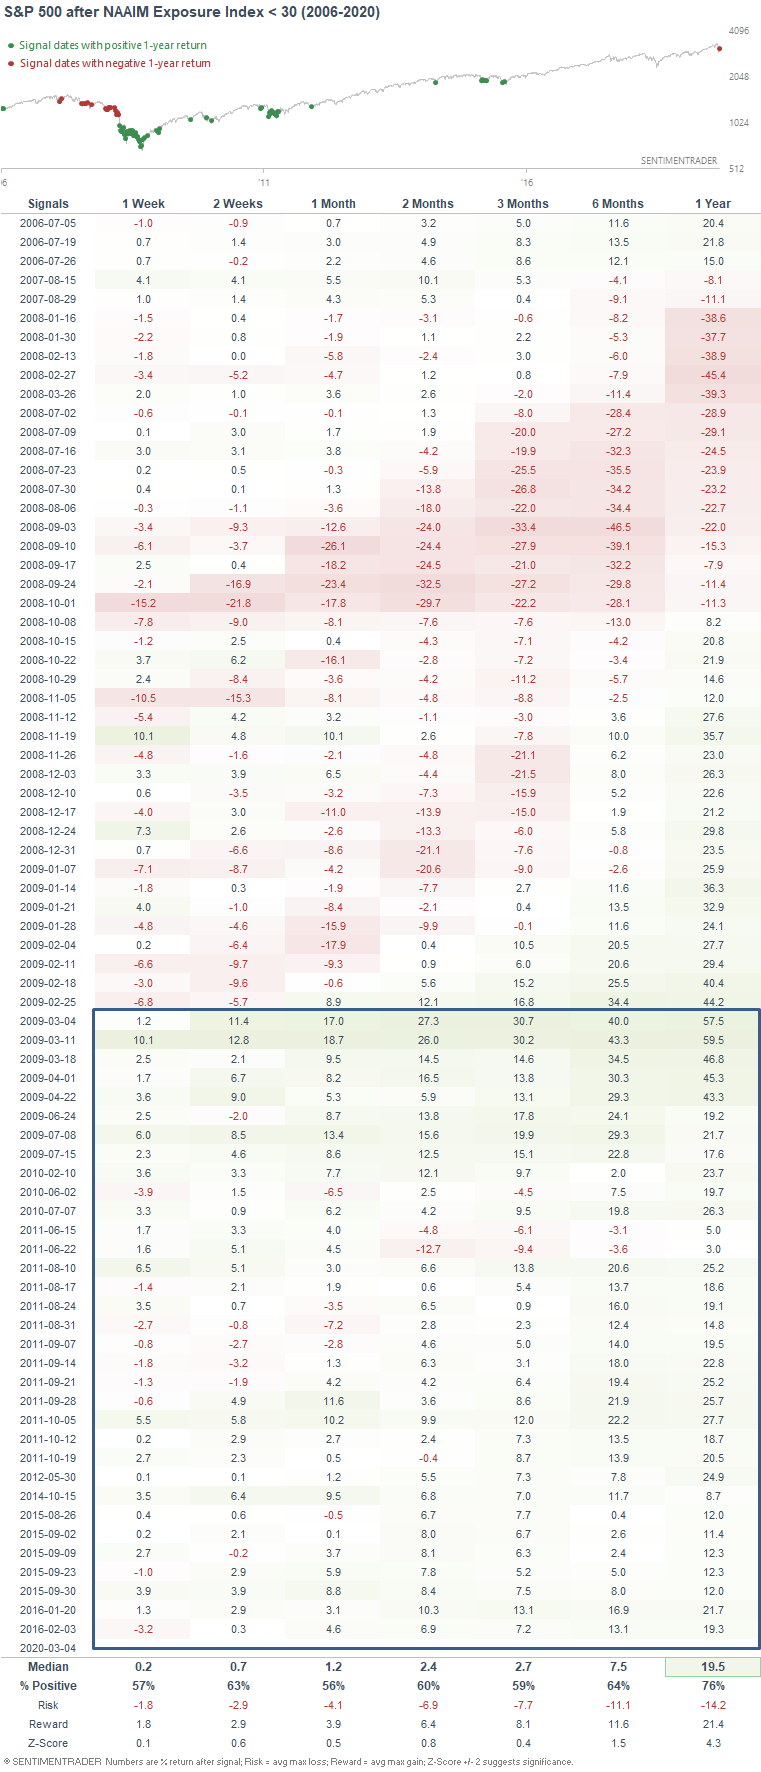
The following table illustrates every single week in which the NAAIM Exposure Index was under 30. Clearly, this was bullish in a bull market and wasn't useful during a bear market:
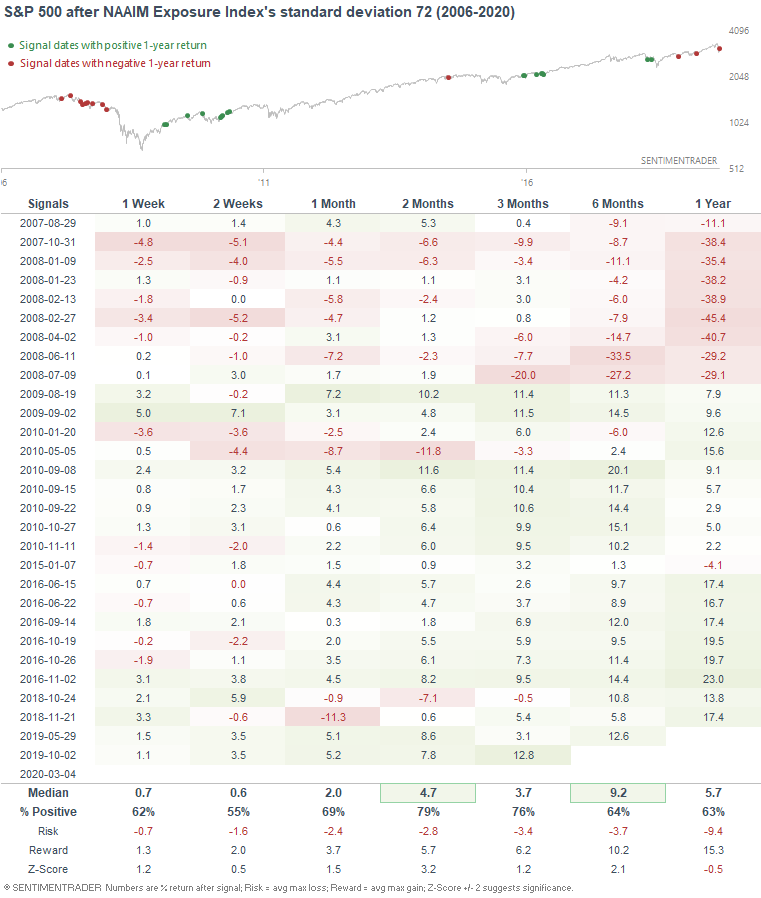
Meanwhile, the standard deviation in responses was very wide:
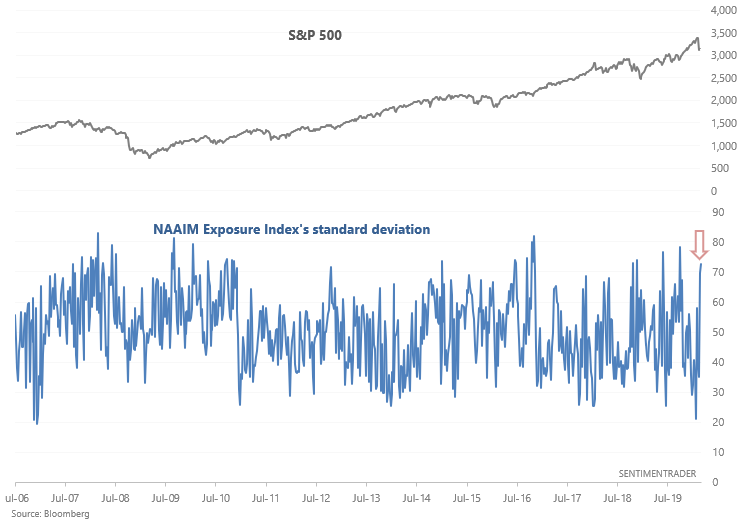
When the standard deviation in responses was this wide in the past, the S&P's returns over the next 2 months were more bullish than random. Once again, this did not work out for bulls during a bear market:
Emerging markets
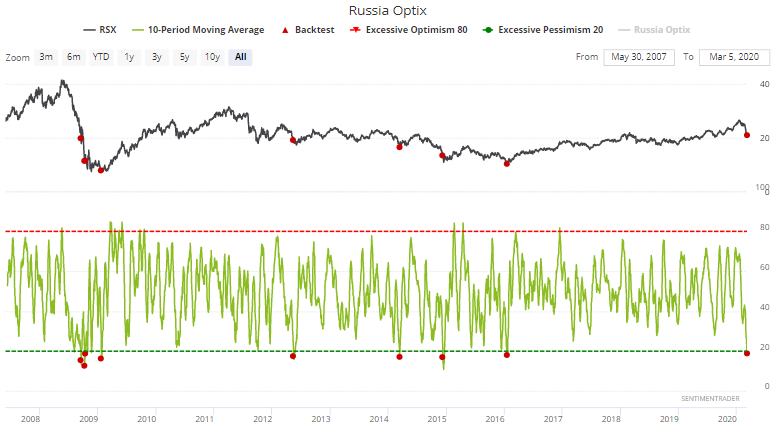
And lastly, sentiment outside of the U.S. is also quite pessimistic (more on this in my weekend post). For the time being, let's take a look at Russia Optix's 10 day average:
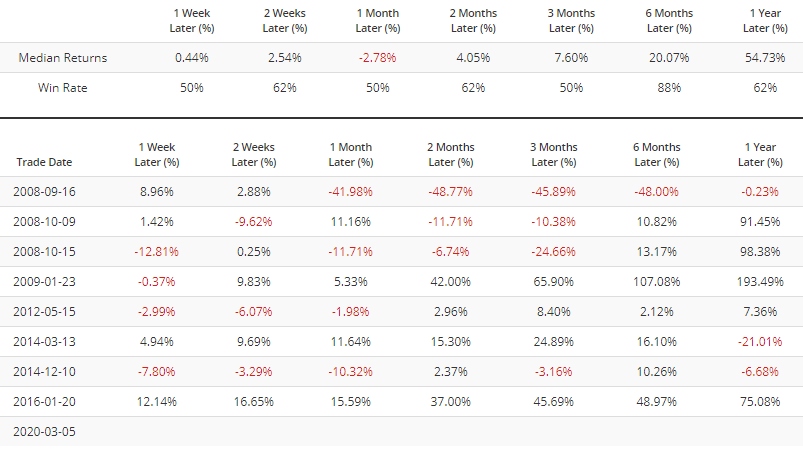
When the 10 day average fell below 19 in the past, Russian equities didn't always bottom immediately. But over the next 6 months, Russian equities always rallied, with the exception being during the worst of the 2008 global financial meltdown:
How I allocate my assets
Instead of sharing how I manage my own trading portfolio, here's how I allocate all my assets for the sake of full transparency. Some of these percentages are approximate, particularly for private assets (since private assets don't have a value on a day to day basis).
- 40% emerging market real estate.
- 20% trading portfolio. My trading portfolio is allocated 50% in the Macro Index Model and 50% in the Simple Trading Model With Fundamentals. Right now I am 25% long stocks and 75% long bonds
- 20% is a buy and hold position for the S&P 500 which I won't sell unless I see better opportunities in private markets. This IS NOT a trading position - here I care about the earnings yield. I expect this portion of the portfolio to see weak returns over the next 5-10 years given that valuations are high (and hence earnings yields are low).
- 20% in short term Treasury bond ETFs. This is a temporary placeholder. When opportunities arise I will sell these cash-like instruments to fund private market investments.
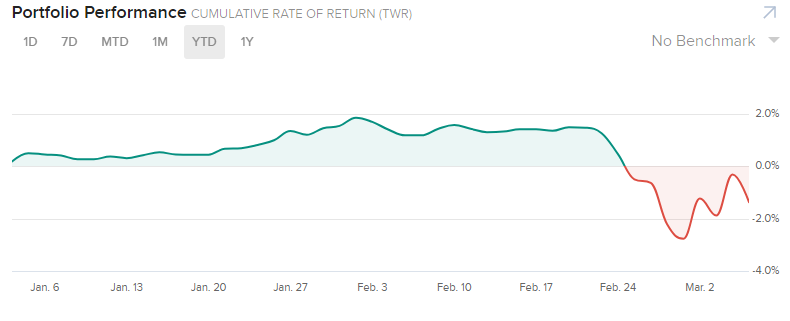
YTD 2020 performance for my public markets portfolio (trading portfolio, buy and hold position, temporary placeholder):
-1.38%