What I'm looking at - Dow earnings, German manufacturing, tech rally, shallow drawdowns, Treasuries sentiment
Here's what I'm looking at:
Dow forward earnings
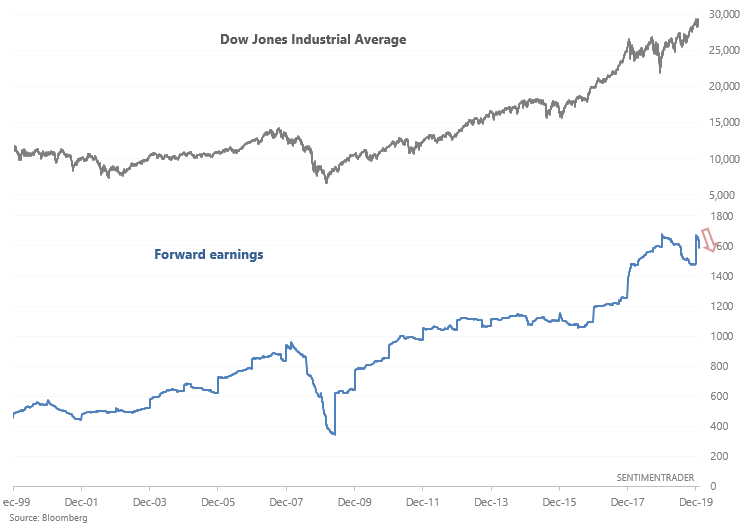
Forward earnings expectations tend to jump at the start of the year and then slide throughout the year. This is normal, and happens during most years. However, what's remarkable is the speed of the Dow's forward earning's decline this year.
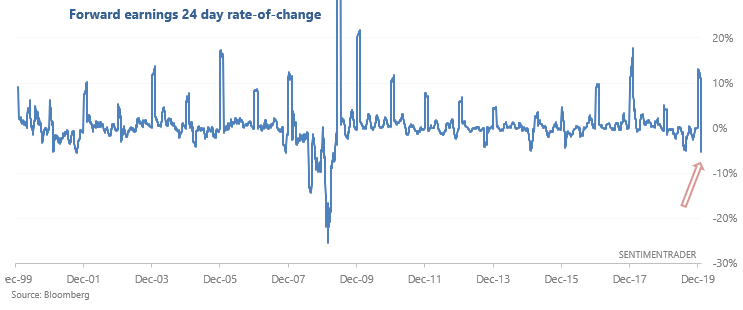
Forward earnings expectations have fallen more than -5% YTD for the Dow Jones Industrial Average. This is quite a rapid drop, and has not been mirrored by the S&P 500, the Russell 2000, or the NASDAQ Composite/100.
When forward earnings expectations fell more than -5% over 24 days, the Dow's returns over the next year were typically awful. This happened during the last 2 recessions and during the 2015 earnings recession. Granted, the most recent case (August 2019) has yet to turn bearish, so we'll have to see if this low sample size stat is still valid.
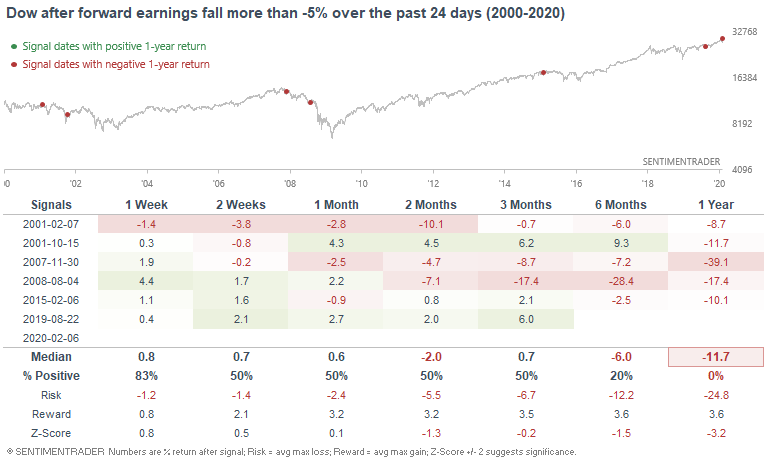
Personally, I'm not too concerned about the drop in the Dow's forward earnings since a similar drop has not been seen among other U.S. equity indices.
German manufacturing
Global manufacturing data has improved somewhat over the past few months. But bears were quick to point out that today's Germany manufacturing orders report was extremely weak ("the WORST since 2009"):
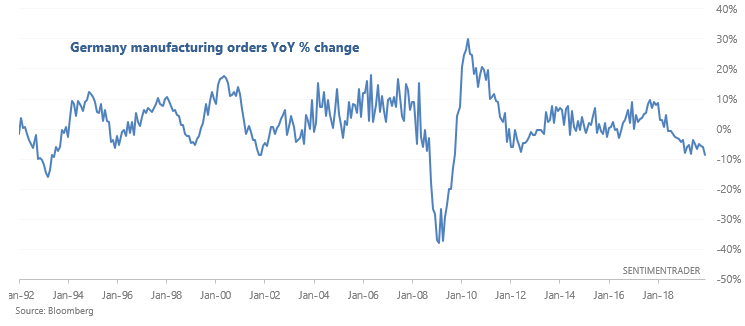
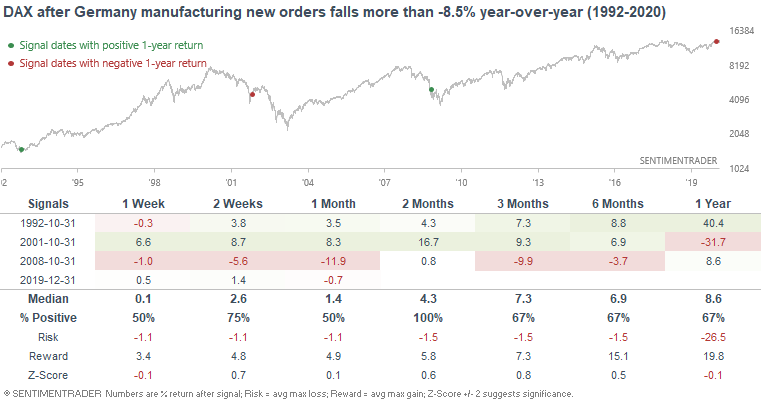
When German manufacturing was this bad in the past, it wasn't a clear bearish sign for German equities because it typically occurred towards the end of a recession:
Rally
With just 1 day left in this week, the NASDAQ 100 is on the verge of having rallied for 18 of the past 24 weeks:
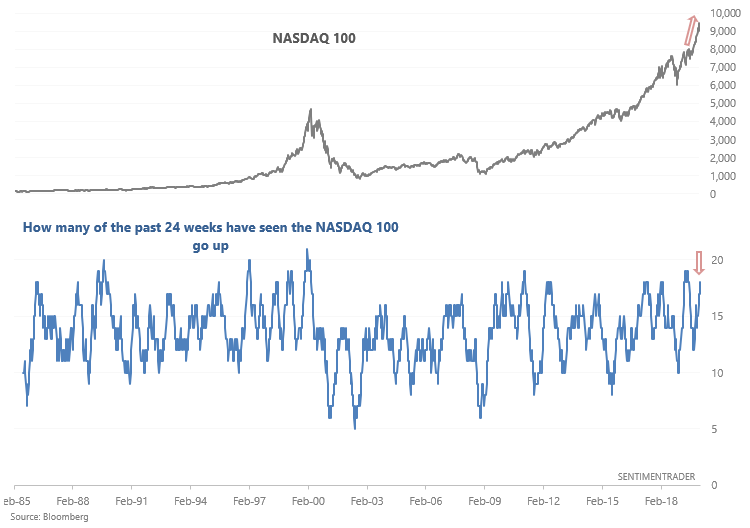
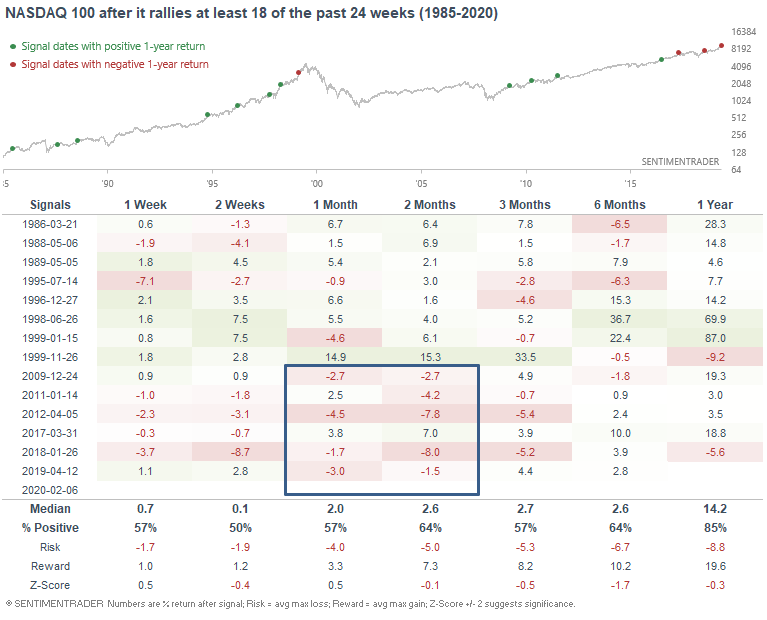
Such strong momentum was usually followed by a pullback over the next 1-2 months. This has been especially true during this bull market:
Shallow drawdowns
After a meltdown in late-2018, the U.S. stock market has trended higher without a correction from 2019-present. At its worst, the S&P fell -7% in mid-2019. For now at least it seems that the S&P's drawdowns have become shallower and shallower. How long can this continue?
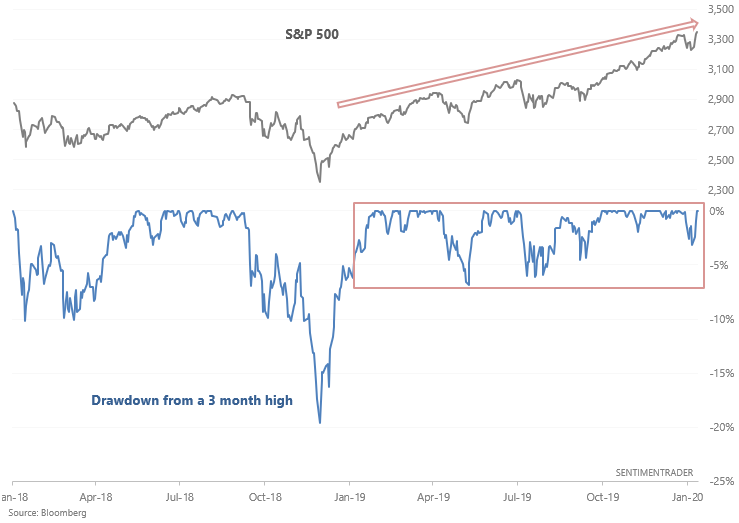
The S&P has gone more than a year without a greater than -7% drawdown from a 3 month high:
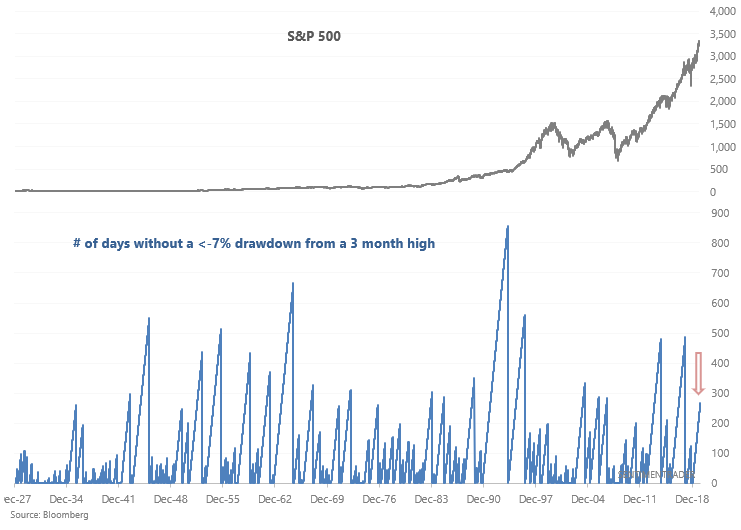
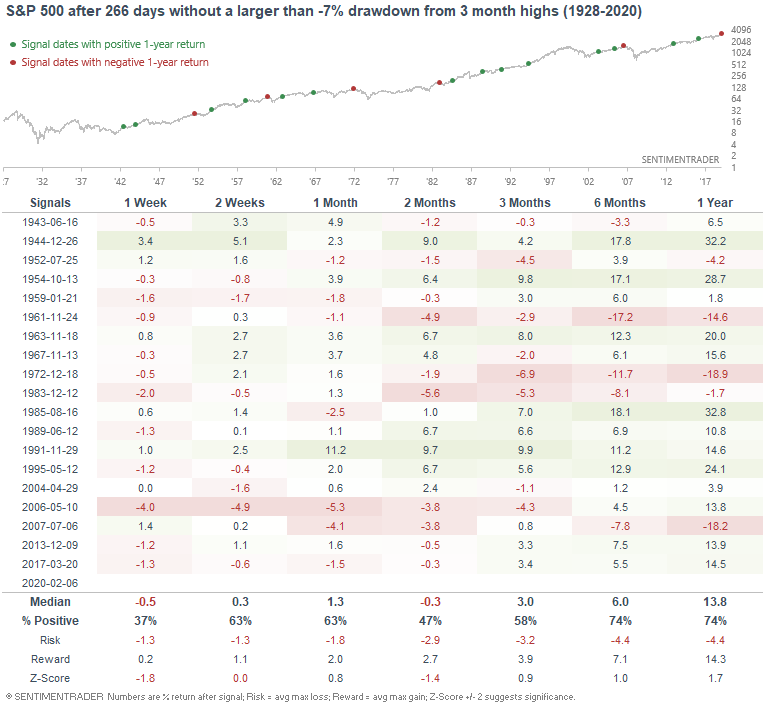
When shallow drawdown streaks lasted this long, the S&P's returns over the next few weeks leaned bearish:
Bonds
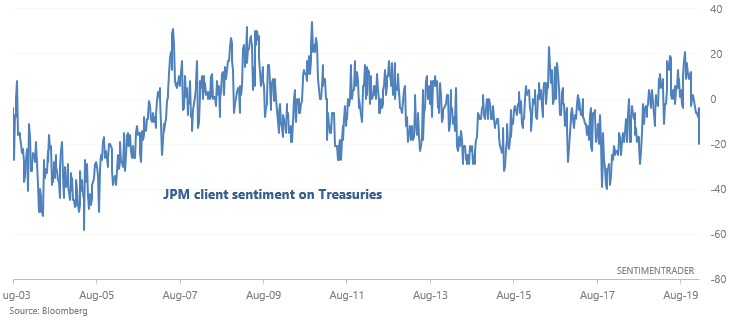
And lastly, Bloomberg TV illustrated that JPMorgan clients' sentiment towards Treasuries had fallen significantly:
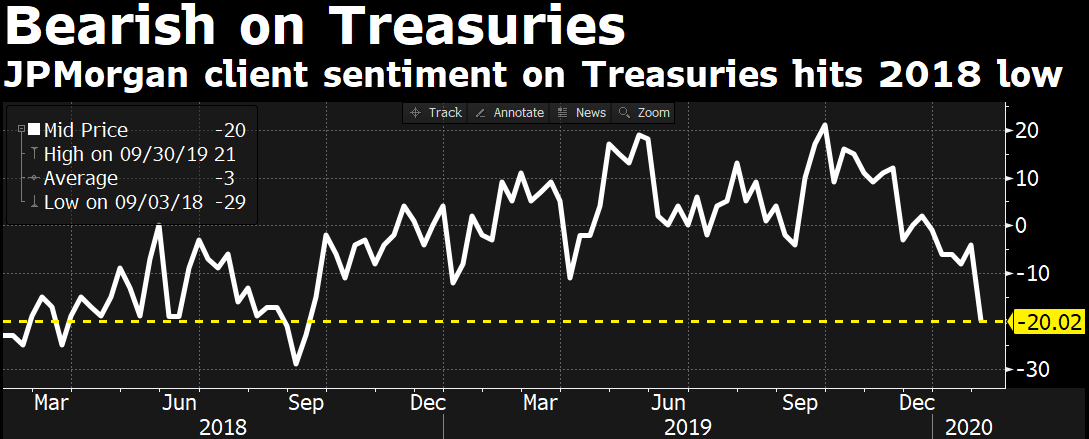
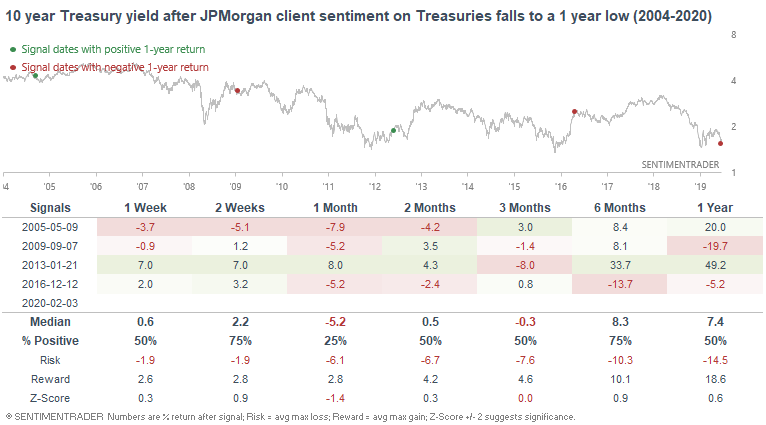
Here's the same chart with more historical data:
When client sentiment hit a 1 year low in the past, it wasn't quite consistently bullish nor bearish for Treasuries:
My trading portfolio
My trading portfolio is allocated 50% in the Macro Index Model and 50% in the Simple Trading Model With Fundamentals. At the moment I have instituted a discretionary override and gone 100% long bonds (instead of long stocks) due to the extreme nature of many of our core indicators, even though some of these core indicators aren't in the models.
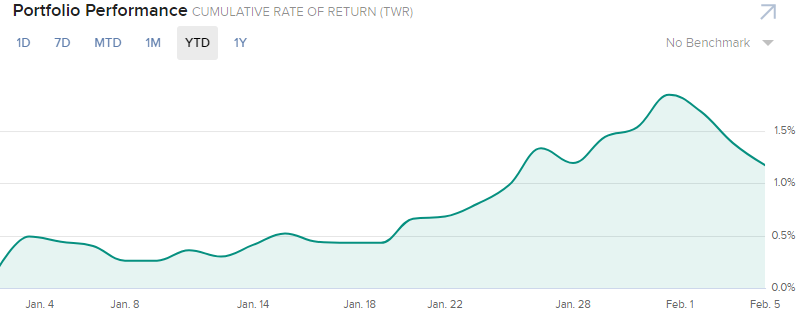
Performance YTD 2020:
- My trading account is up 1.17%
- Currently 100% in bonds