
What I'm looking at - dividend yields, gold & USD, wholesalers' sales, oil positioning, 50 dma breadth.
With the stock market virtually flat, here's what I'm looking at:
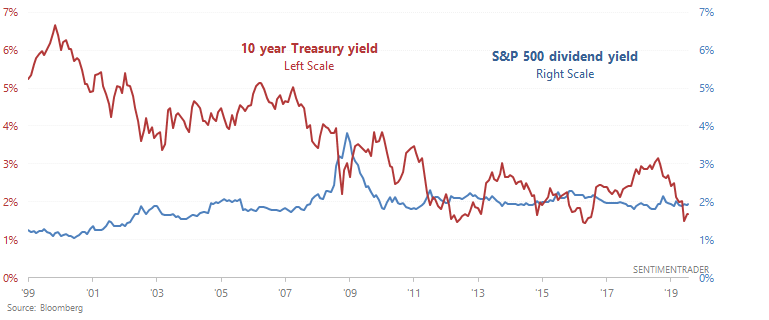
Dividend yield vs Treasury yield
CNBC noted that the S&P 500's dividend yield is greater than the 10 year Treasury yield. According to Bank of America, this is very bullish for stocks because when this happened in the past, stocks significantly outperformed bonds 94% of the time over the next 12 months.
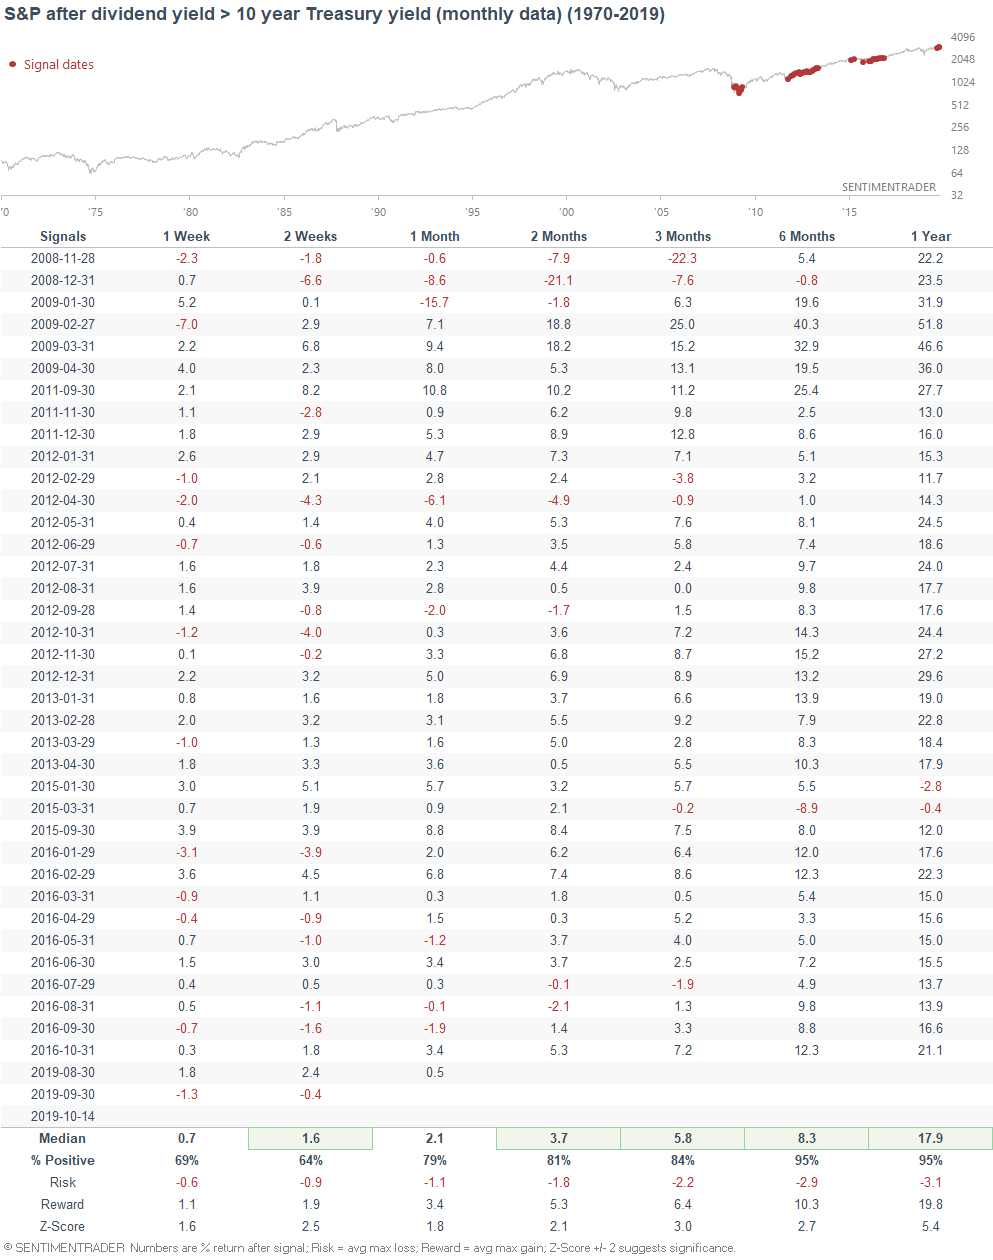
Herein lies the problem. This phenomenon (dividend yield > 10 year Treasury yield) has only occurred during this bull market. Hence why the S&P's forward returns are so bullish (if you only include bull market data, you'll get a bullish prediction). The following chart illustrates every month in which the S&P 500's dividend yield exceeded the 10 year Treasury yield. Data is from Bloomberg:
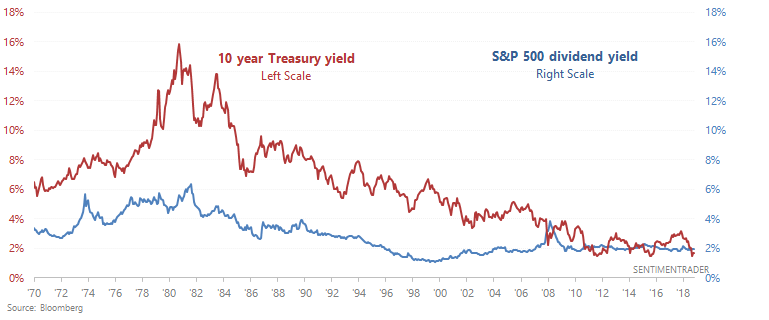
Looking at a chart from 1970-present, it's clear why this should not considered a bullish factor for stocks:
Here's another even longer chart from 1900-present, using data from Robert Shiller and Yale:
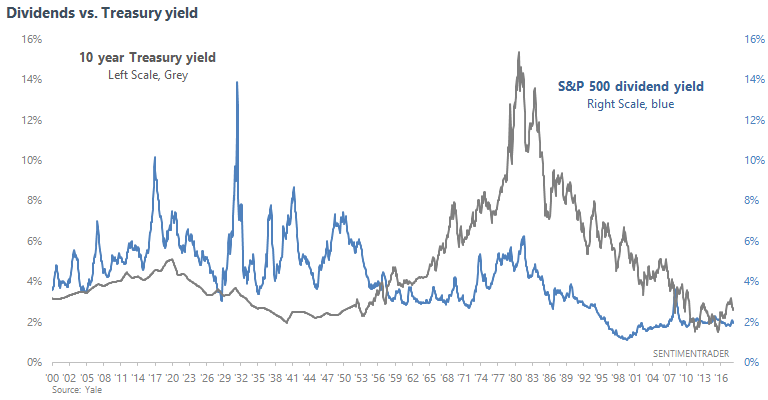
You can see that dividend yields and Treasury yields can diverge widely for many decades. Moreover, dividend yields were much higher pre-1950s, and have fallen significantly since the 1990s. Investors don't receive most of their returns as dividends anymore. Returns mostly come from earnings (and somewhat from multiples expansions over a 100 year period), some of which is distributed as dividends, and some of which is earned over time as capital gains.
Overall, the concept of comparing dividend yields to interest rates is flawed. A better concept was the Fed Model, which was popularized by Dr. Ed Yardeni in the 1990s and compared the earnings yield with Treasury yields.
The Fed Model states that different asset classes compete with eachother for capital. So theoretically, the 10 year Treasury yield (yield on bonds) should match the forward earnings yield on stocks. And from the 1970s-1990s, this was true. Wide deviations (when bond yields were much higher than earnings yield) told investors to sell in 1987, 1997 (ahead of the 1998 crash), and 1999 (ahead of the 2000 peak). This was a way to represent "high valuations" instead of using a static P/E to define "overvalued". P/E's big flaw is that it doesn't take into consideration interest rates.
However, the Fed Model is no longer as useful as it used to be. Since the 2000s, interest rates have been consistently lower than earnings yields. From Dr. Yardeni's website:
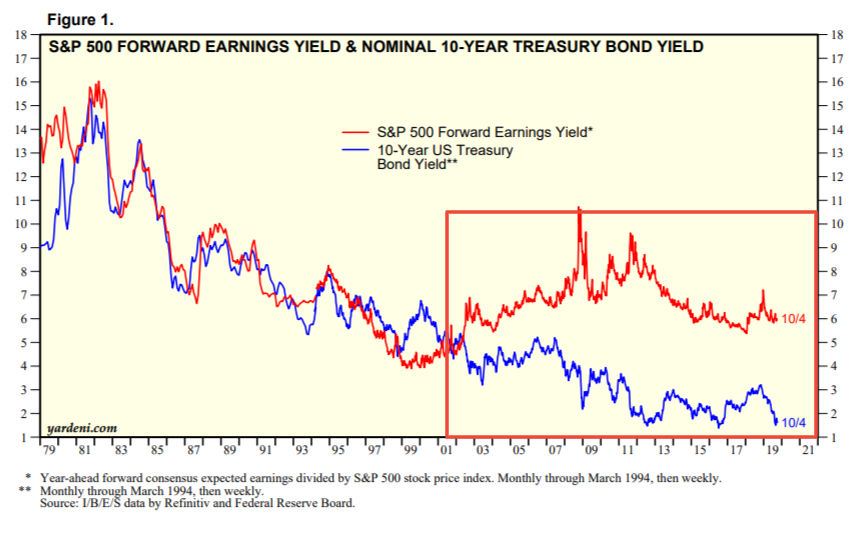
This demonstrates an interesting phenomenon in finance. When something works well and becomes popularized, it stops working that well. In a way, this is true of any industry. When too many people use the same tactic, there's no competitive advantage in using it anymore.
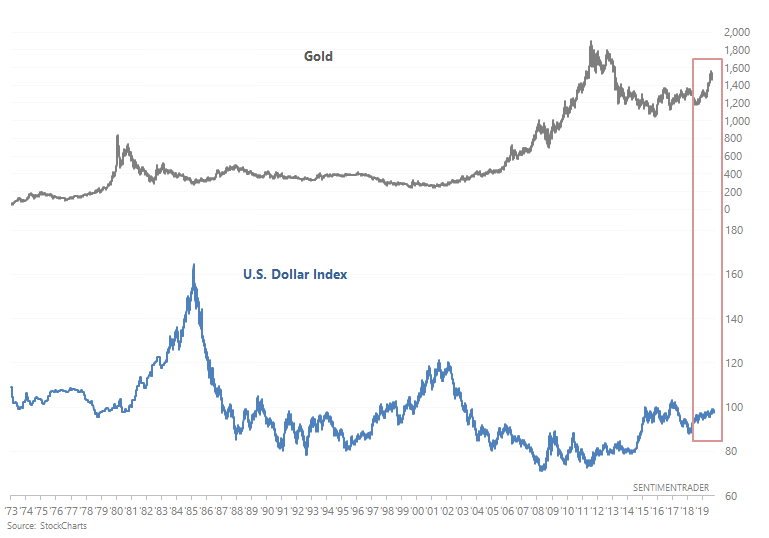
Gold and U.S. Dollar
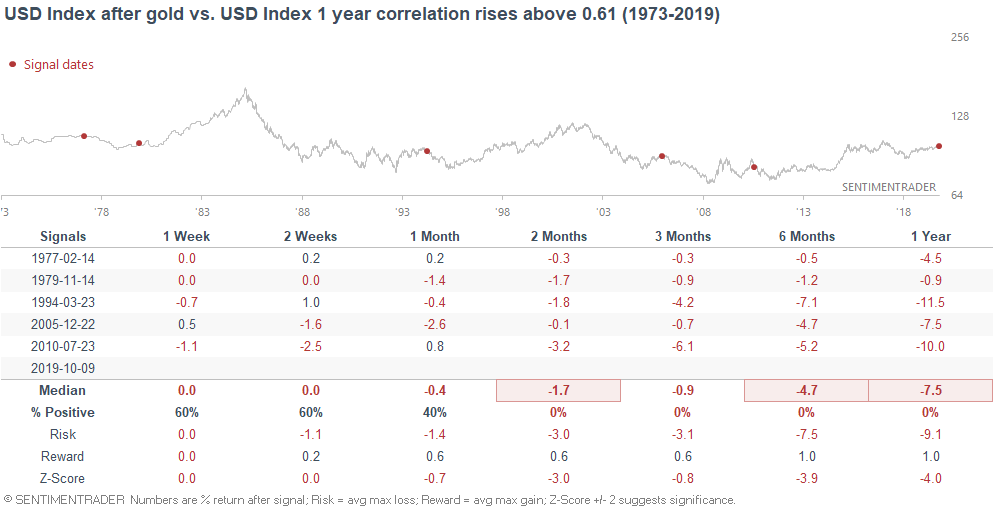
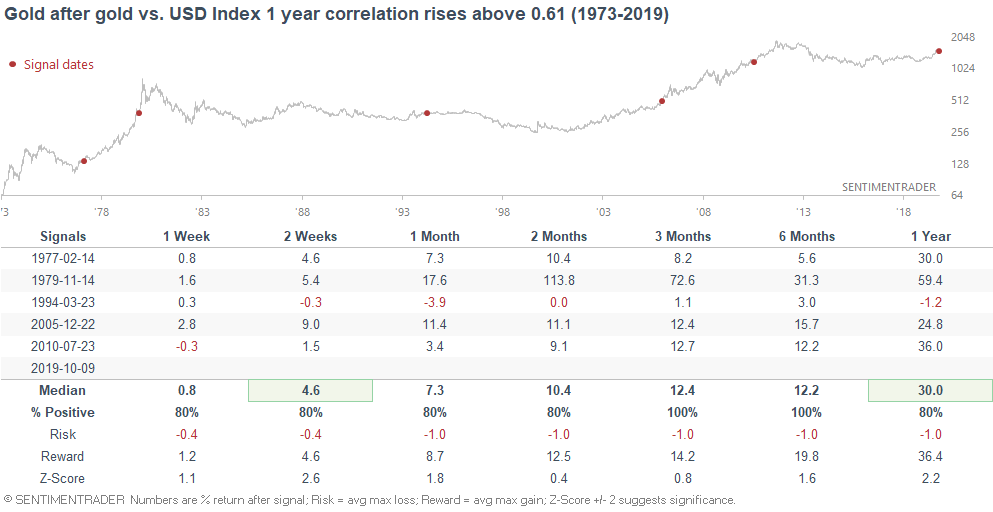
Both gold and the U.S. Dollar have been trending higher over the past year, presumably on trade war fears and global economic policy uncertainty. As a result, the 1 year correlation between gold and the U.S. Dollar Index has risen above 0.61
When gold and the dollar were this tightly correlated in the past, the U.S. Dollar Index performed poorly on virtually all time frames:
Whereas gold usually performed well over the next year:
Wholesale
As Morgan Stanley noted (h/t Carl Quintanilla), merchant wholesalers' sales have fallen -0.66% year-over-year. Inventories remain high as companies bought in anticipation of increased tariffs.
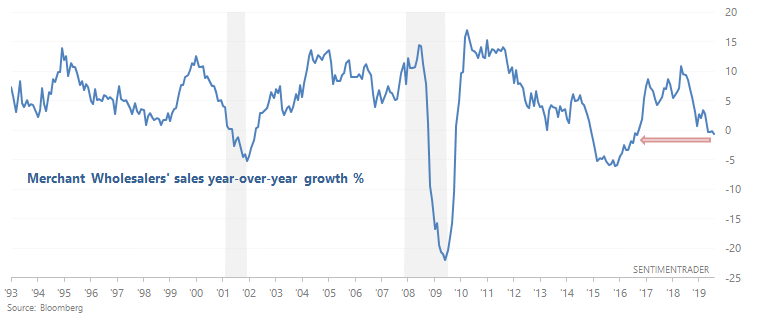
From 1993 - present, there were only 3 other times when wholesalers' sales growth fell below -0.5%:
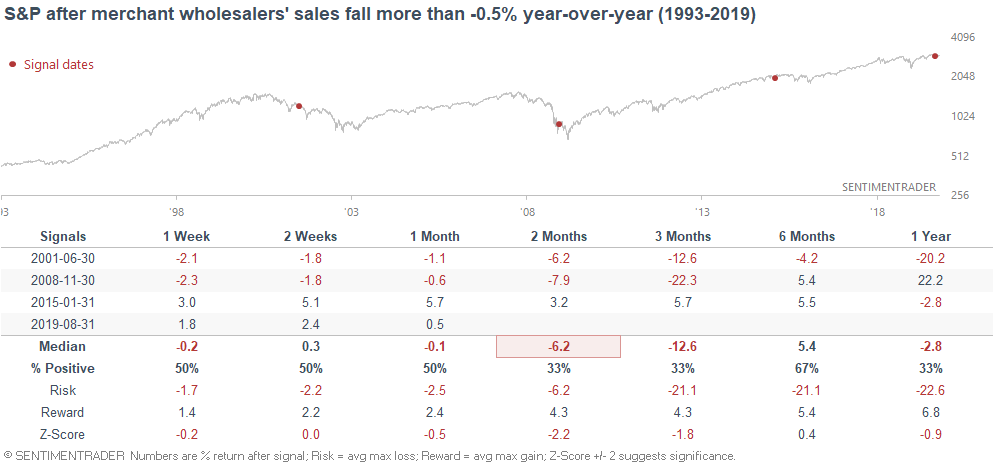
While today is not "just like 2001 and 2007", this does demonstrate that economic data related to manufacturing and trade continue to be weak. The trade war is distorting data in certain ways that we don't normally see (e.g. soft data is much worse than hard data).
Oil
The WSJ noted that hedge funds are turning more sour towards oil:
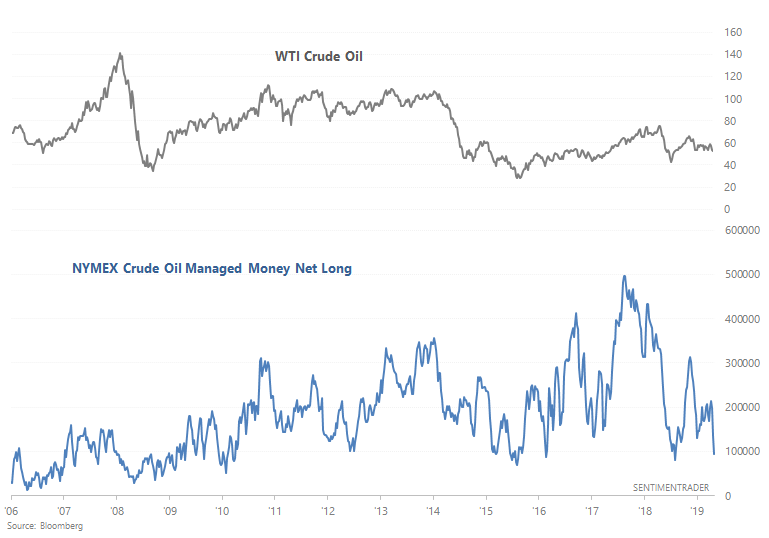
While it's easy to automatically assume that this is a bullish factor for oil, it wasn't always. The following table demonstrates what happened next to oil when managed money net long positioning fell more than -50% below its 6 month average:
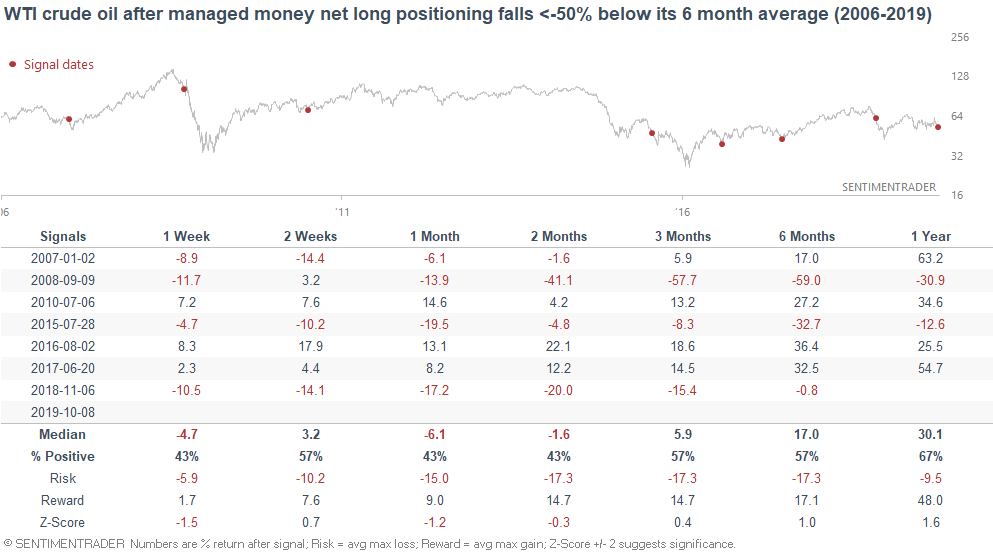
Oil's forward returns over the next few months were mixed. And this wasn't consistently bullish for the S&P 500 energy sector either:
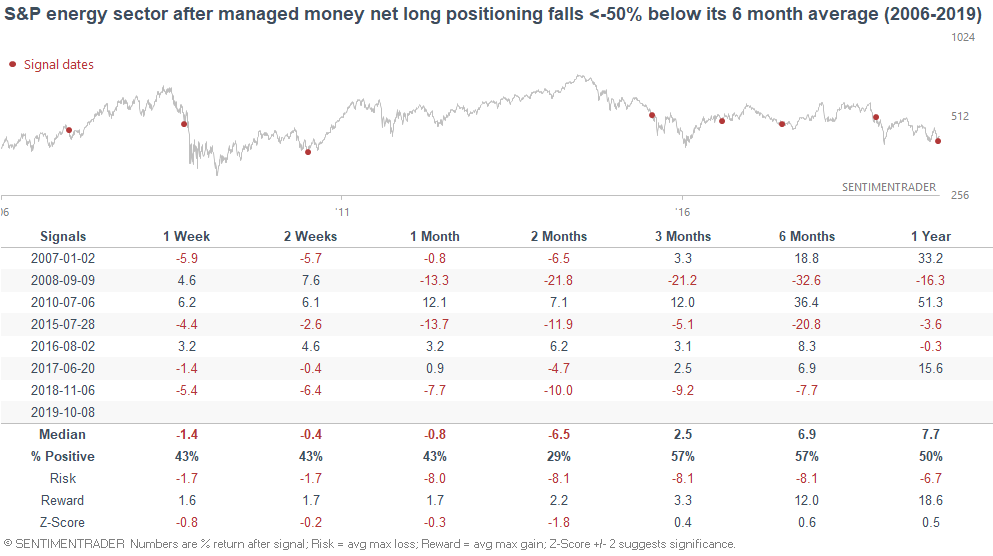
Sometimes this marked the bottom in oil and energy stocks. Sometimes these markets fell much more before making a bottom.
Divergences
As Jason pointed out, the S&P 500 "diverging" from the % of stocks above their 50 dma isn't a major concern for stocks. I'd like to add my opinion on why this is.
The % of stocks above a certain moving average (e.g. 10 dma, 50 dma, 200 dma) is very closely correlated to the S&P 500's distance from that moving average. Afterall, the S&P 500 is just a basket of its 500 components. The more stocks that are above X day moving average, the more likely the S&P is to be above that X day moving average.
- From 1990-present, the correlation between "% of stocks above their 10 dma" and "the S&P 500's distance from its 10 dma" is 0.87
- From 1990-present, the correlation between "% of stocks above their 50 dma" and "the S&P 500's distance from its 50 dma" is 0.88
- From 1990-present, the correlation between "% of stocks above their 200 dma" and "the S&P 500's distance from its 200 dma" is 0.85
As you can see, these are very strong correlations.
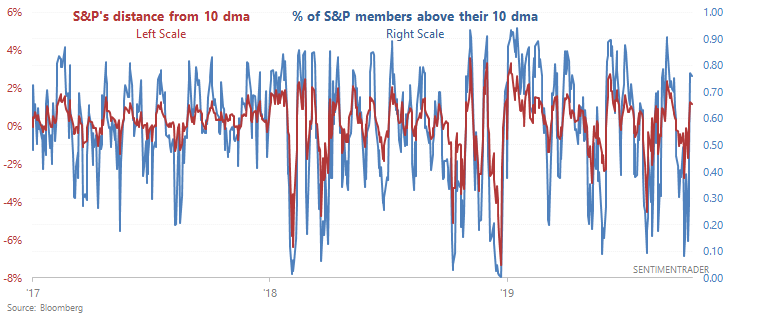

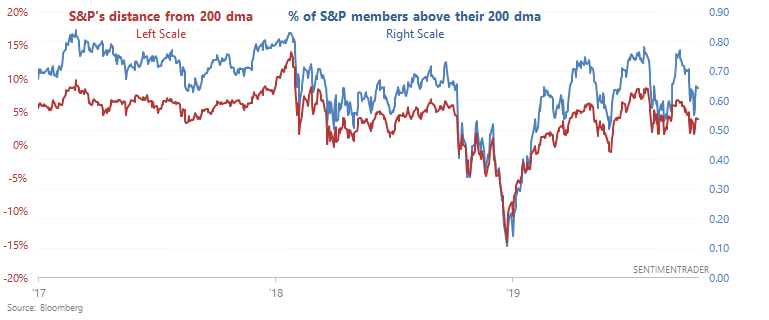
Hence why a "divergence" between the S&P 500 and the % of S&P issues above their 50 dma isn't consistently bearish. This divergence occurs because the S&P rallied significantly at the start of 2019 (S&P was very far from its 50 dma, and many members were above their 50 dma). Now that the rally is slowing down, the S&P is getting closer to its 50 dma (and fewer members are above their 50 dma).
Saying that this is bearish is similar to saying "the S&P is bearish because it isn't rallying fast enough. It's rolling over!".
- When the S&P's rally slows down, sometimes it rolls over and crashes.
- When the S&P's rally slows down, sometimes it re-accelerates.