What I'm looking at - DAX, Put/Call, all-or-nothing, gold:silver ratio, AUDUSD
With the U.S. stock market still up significantly year-to-date, other countries' stock markets have performed more poorly. Here's what I'm looking at.
DAX
Last week we looked at why small caps are underperforming large caps. In a nutshell, earnings matter, and small cap earnings are deteriorating faster than large cap earnings.
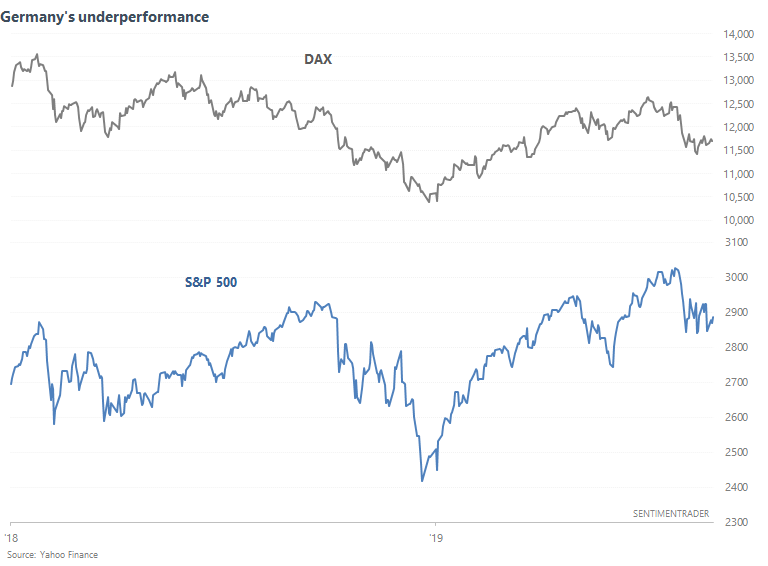
The German stock market (DAX) has also underperformed the S&P 500 since January 2018.
Once again, we can explain this quantitatively by looking at DAX's expected earnings. Whereas DAX's forward earnings were trending higher from 2016-2017, earnings have been trending lower since 2018.
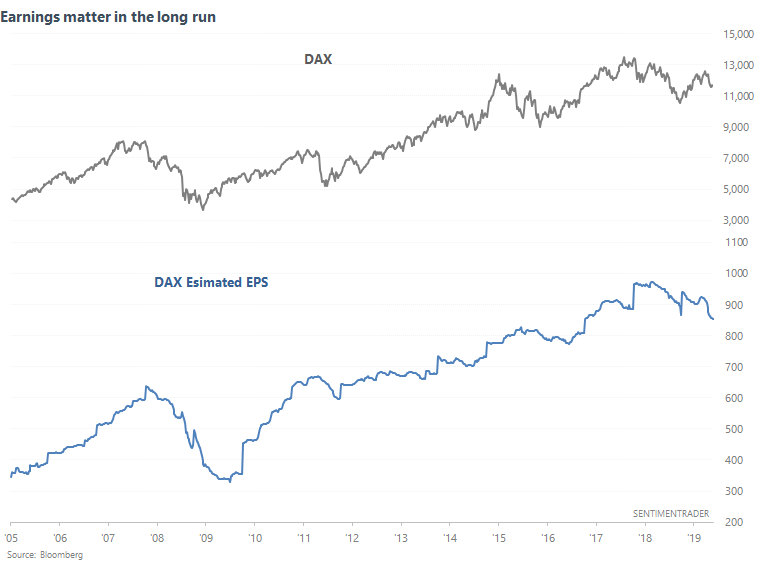
From a long term perspective, it's better to buy DAX when forward earnings are trending higher than when earnings are trending lower. At its core, stocks are pieces of businesses, and what a business (or index of businesses) generates in earnings determines its price in the long run.
The following chart demonstrates what happens if you buy DAX when forward EPS' 40 week average is going up (otherwise shift to 100% cash).
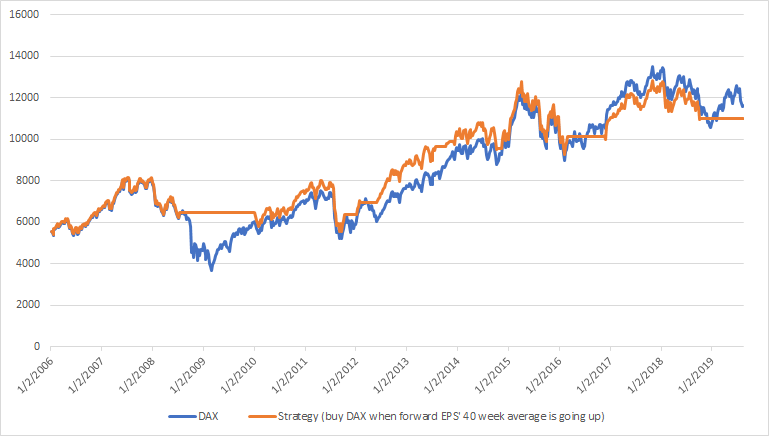
This doesn't beat buy and hold, but it will help you avoid the worst of a big bear market and recession. This strategy is currently on a SELL signal.
Put/Call
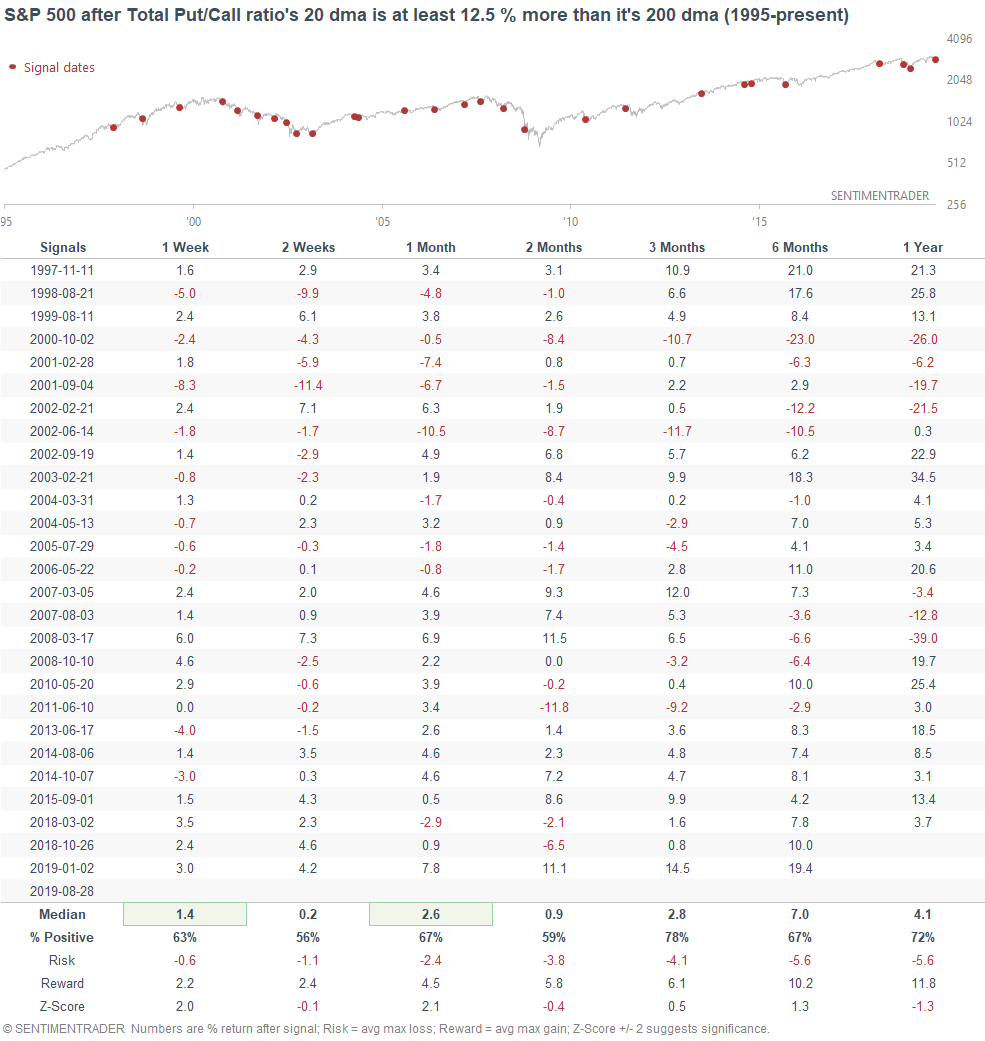
Amidst heightened "recession fears" and nonstop talk about the yield curve, the Total Put/Call ratio remains high.
To understand what this means for the market, we can compare the Put/Call ratio's 20 day average vs. its 200 day average (because the Put/Call ratio tends to move around over the years). The difference is now at 12.5%.
Here's what happens if we isolate for the cases in which the S&P was above its 200 dma.
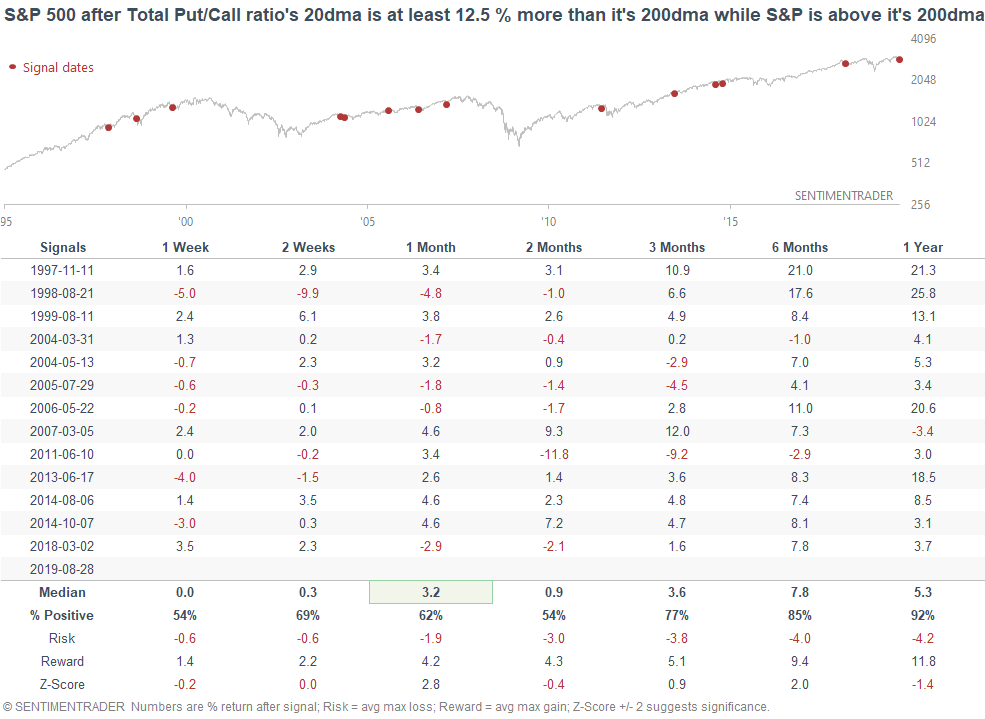
Overall, slightly positive for the S&P over the next month, but not extremely so.
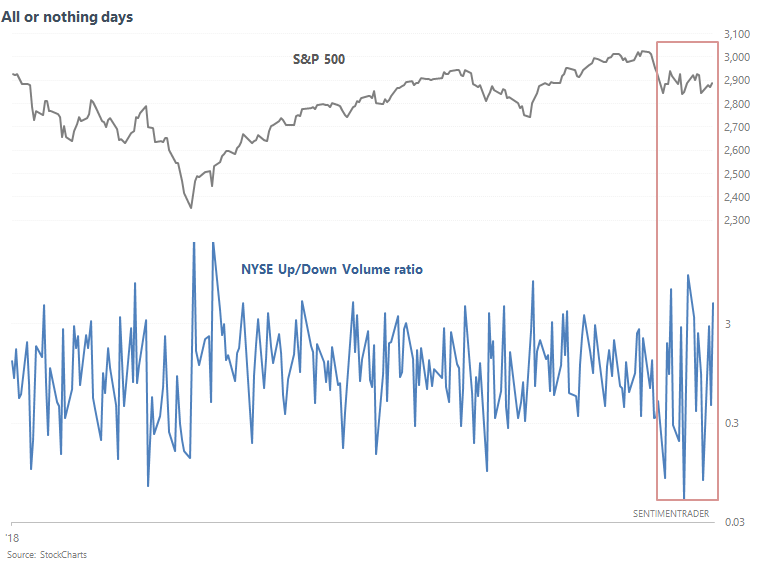
All or nothing days
The stock market remains quite volatile, and this month has seen plenty of all-or-nothing days. The S&P goes up "because" of good news (or just an excuse), and all stocks go up. The S&P goes down "because" of bad news, and all stocks go down. The following chart compares the NYSE Up/Down Volume ratio.
The past 20 days have seen 3 days in which there were 4x as much volume flowing into Up issues than Down issues, and 3 days in which there were 8x as much volume flowing into Down issues than Up issues. When this happened while the S&P was within 10% of a 1 year high, the S&P's forward returns over the next 3 months were more bearish than random. For example, this is how the big corrections in 2010 and 2011 started.
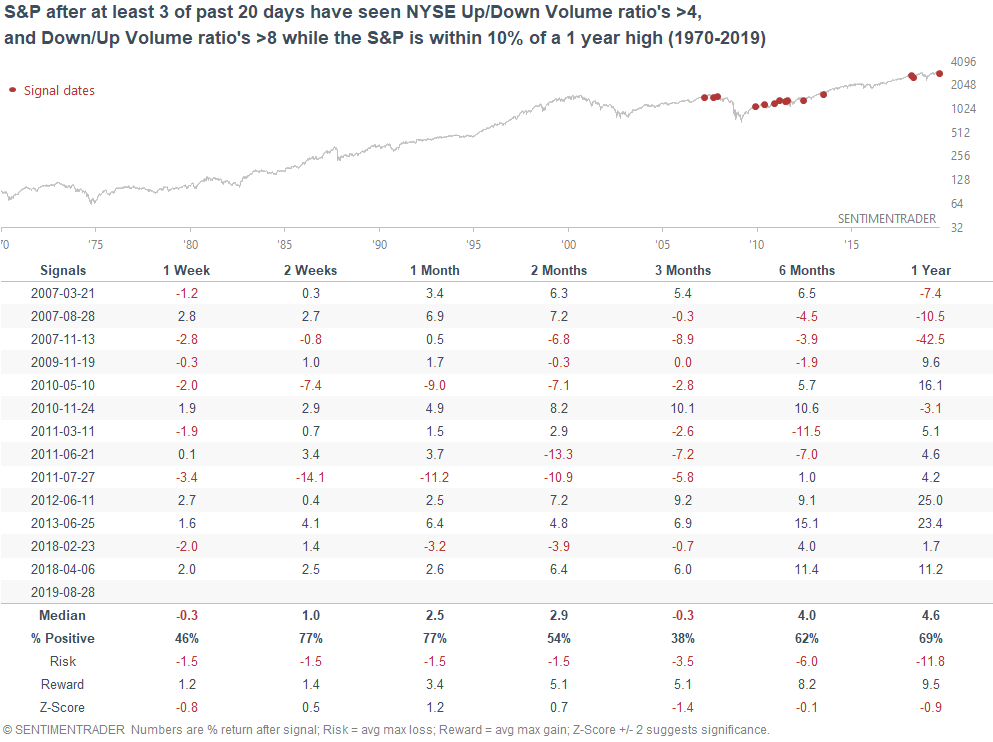
This is one of the few stats that goes against a generally positive outlook for the next 3-6 months.
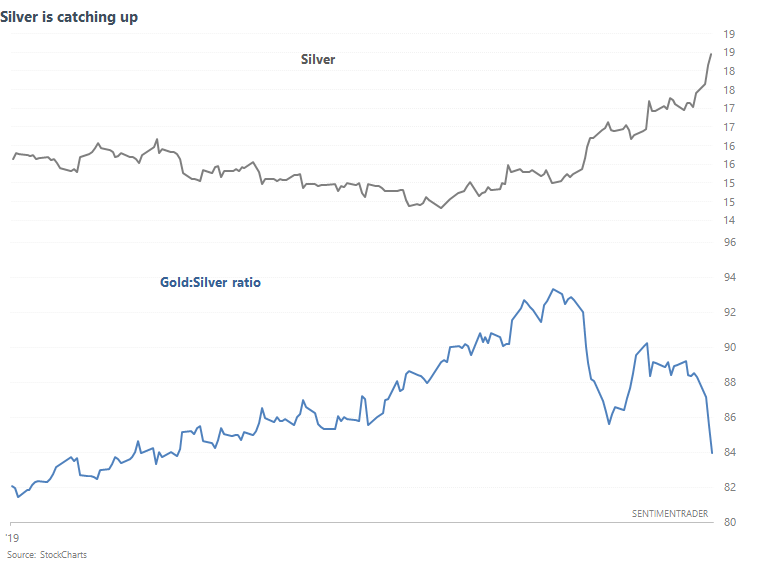
Silver catching up
Silver continues to catch up to gold's rally, causing the gold:silver ratio to crash over the past 3 days. A falling gold:silver ratio is normal and bullish for precious metals, because silver tends to be more volatile than gold (so it outperforms gold during a rally). But when the gold:silver ratio falls too much (i.e. silver surges too much), it's been a warning sign for metals.
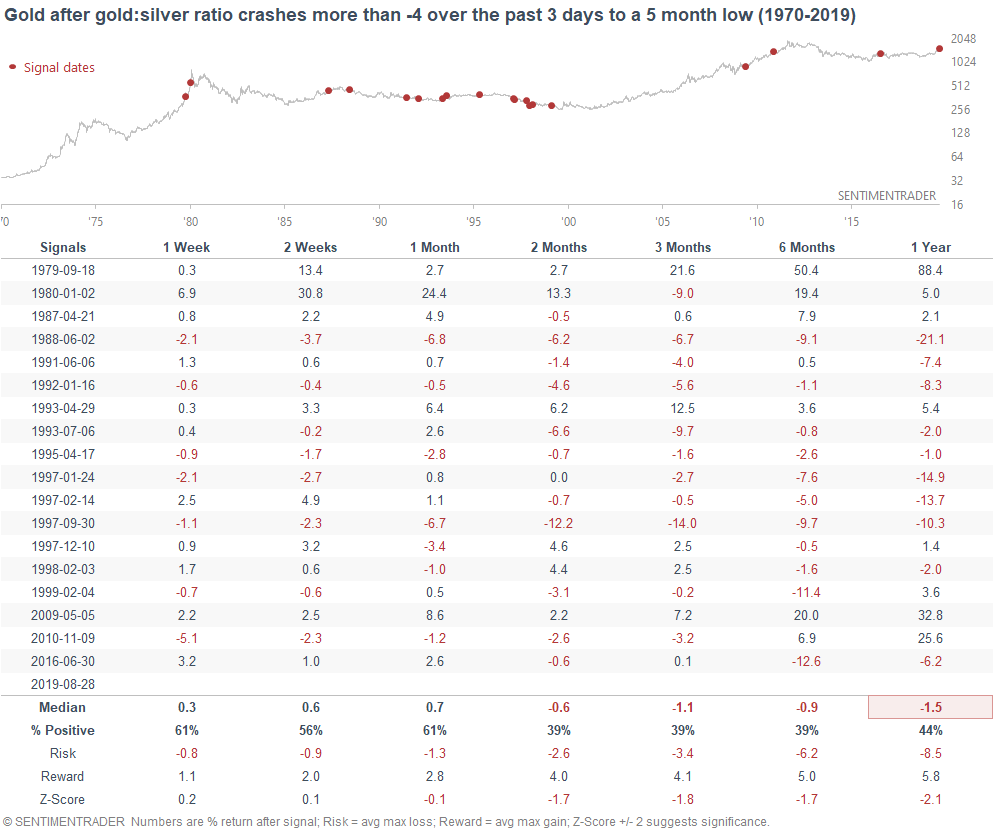
Here's what happened next to gold when the gold:silver ratio crashes more than -4 over the past 3 days to a 5 month low.
Here's what happened next to silver.
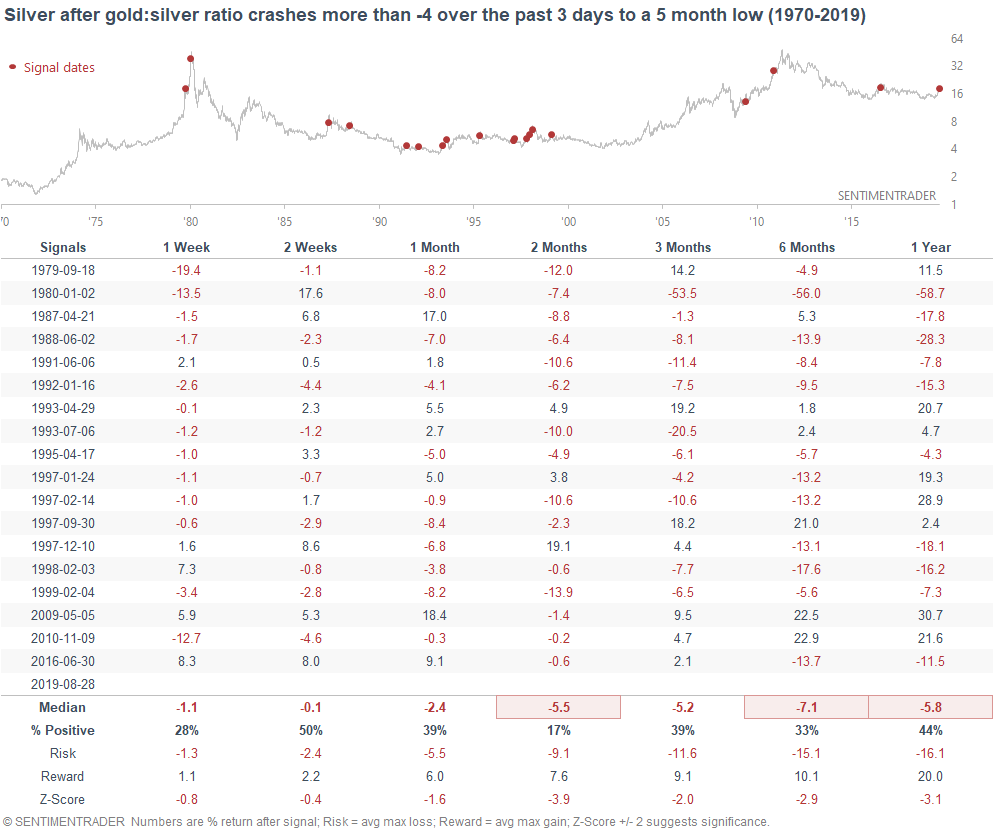
Silver's returns over the next 2 months are quite weak.
Australian Dollar can't catch a breath
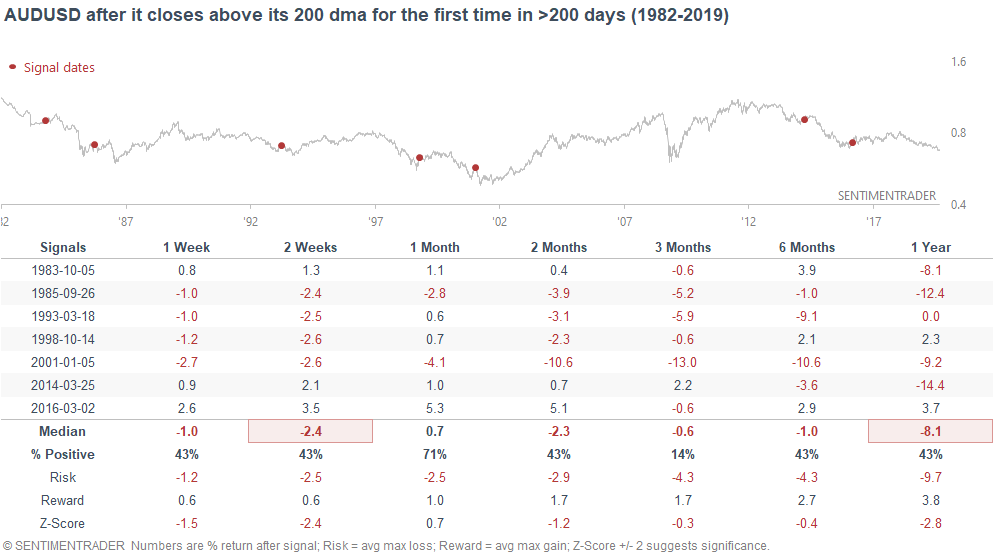
The Australian Dollar continues to be extremely weak. AUDUSD has been below its 200 dma for 366 consecutive days, which is one of the longest streaks ever.
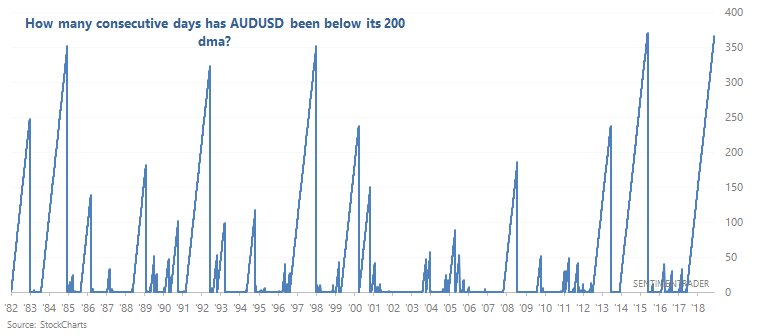
When these streaks ended in the past, AUDUSD often rallied over the next month, and then went lower over the next 3 months. Extremely strong downtrends usually require a divergence (bounce and new low) before they can truly reverse.
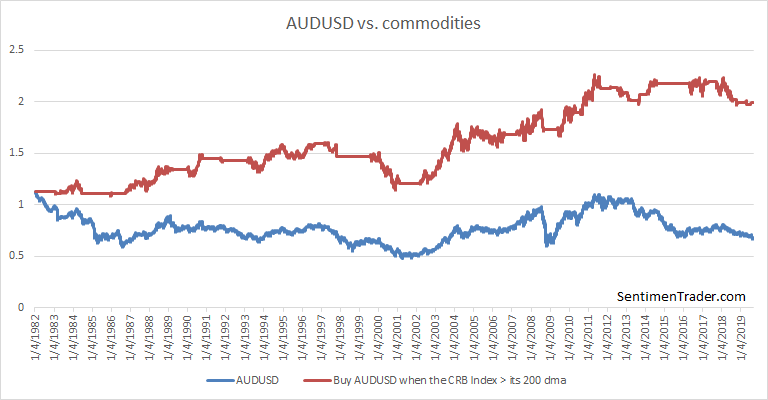
The Australian Dollar is weak for many reasons, one of which is the persistent weakness in commodities. Here's AUDUSD vs. the CRB Index (commodities). Their correlation from 1982-present = 0.6
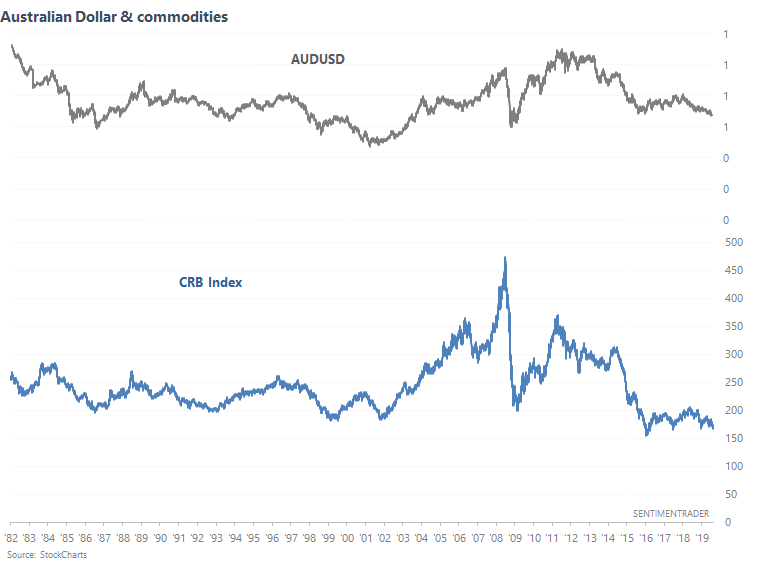
To demonstrate the correlation between the AUDUSD and CRB Index, the following chart illustrates that it's better to buy the AUDUSD when the CRB Index is in a long term uptrend (i.e. above its 200 dma).