What I'm looking at - correlations, risk-off, utilities, Shanghai Index
Here's what I'm looking at:
It's just like...
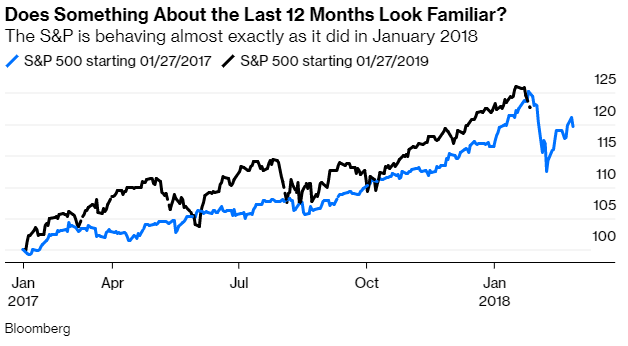
Bloomberg published an interesting article about potential risks to the stock market's rally, and one of these looked at the S&P's strong rally over the past 11 months. The article noted the similarity between the S&P throughout 2017 vs. the S&P today:
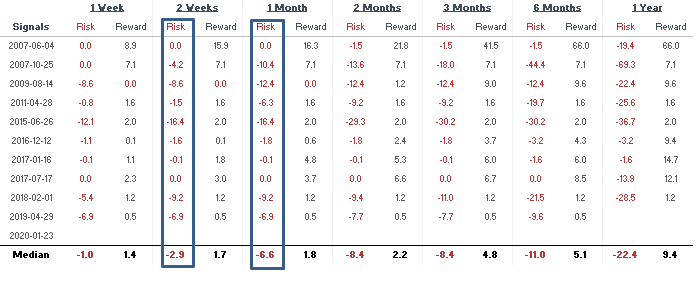
These types of analogues are popular on the internet. I've seen some that compare today vs. 2013-2014, some that compare today vs. 1999-2000, etc. From a quantitative perspective, we can take the S&P 500 over the past 11 months and run its correlation against other 11 month historical periods. Then we can look for historical cases with correlations >0.9 (avoiding overlaps), and see if the epic rally actually has bearish implications (or if this is just bear hype):
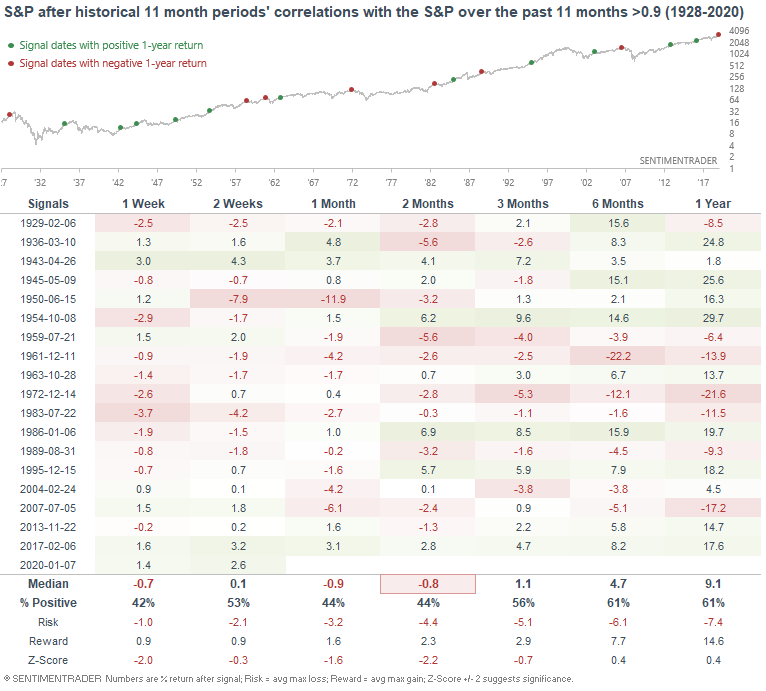
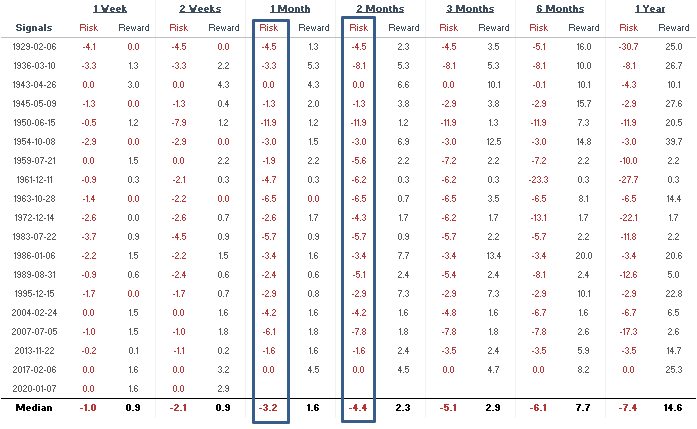
As you can see, such strong one-directional rallies usually saw weakness over the next 1-2 months. Several cases saw the S&P 500 rally even more (e.g. 2017), but most saw a pullback soon. Here are the 1-2 month maximum drawdowns:
Risk-off
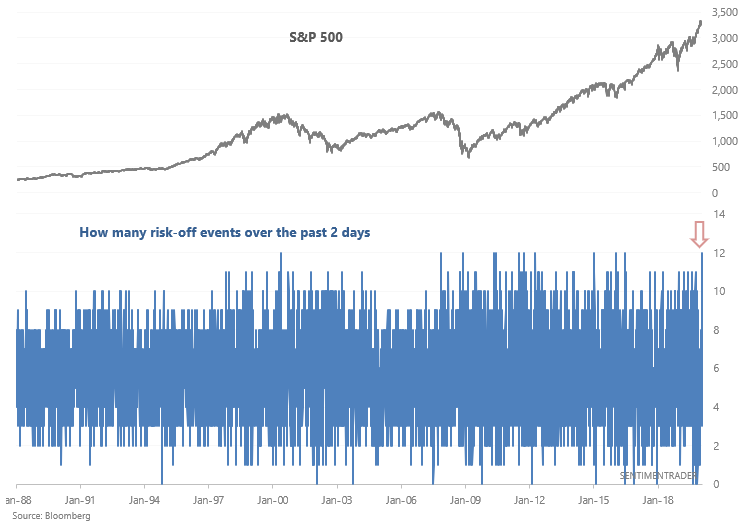
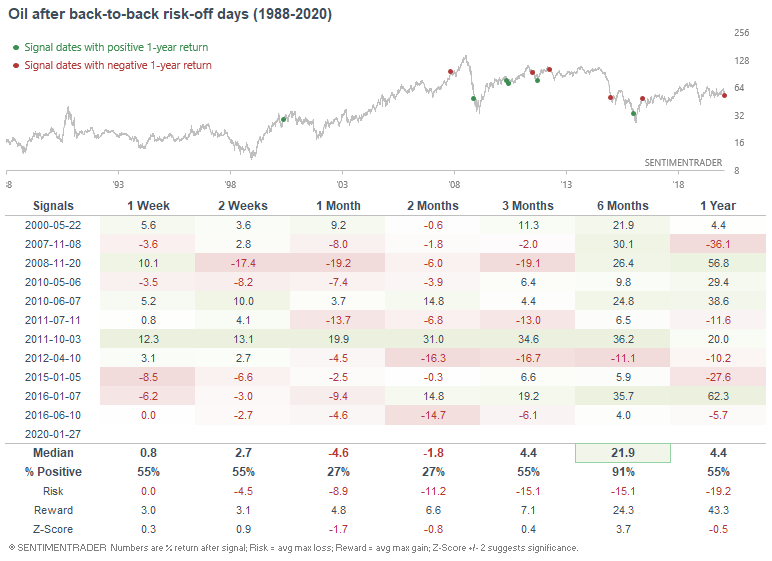
The stock market's drop on Monday and last Friday saw clear risk-off behavior. The U.S. stock market, emerging markets, copper, oil, and the 10 year Treasury yield all fell, while gold jumped on Friday and Monday. Such clear back-to-back risk-off behavior is not common, and has only occurred 11 other times from 1988-present:
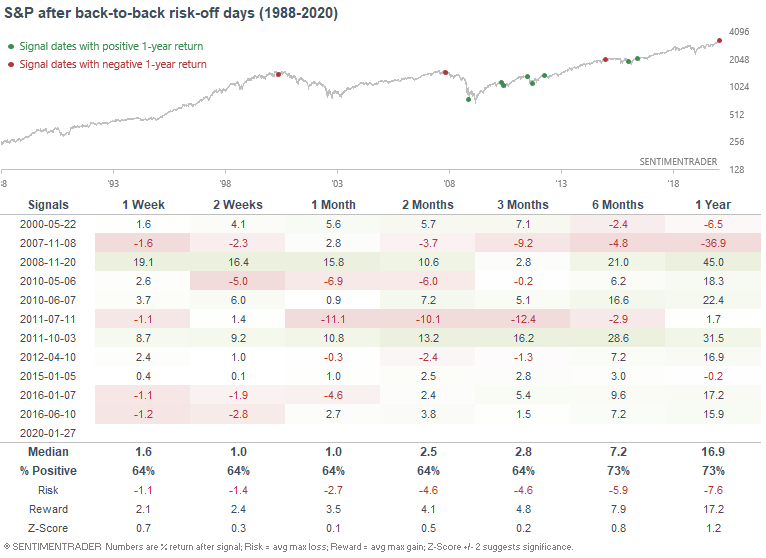
When this happened in the past, it wasn't consistently bullish or bearish for the S&P 500:
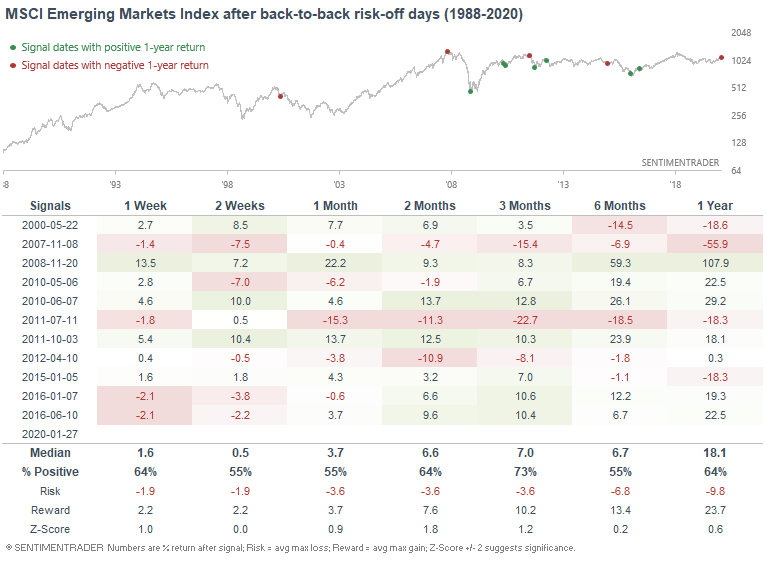
And neither was it quite consistently bullish or bearish for emerging markets:
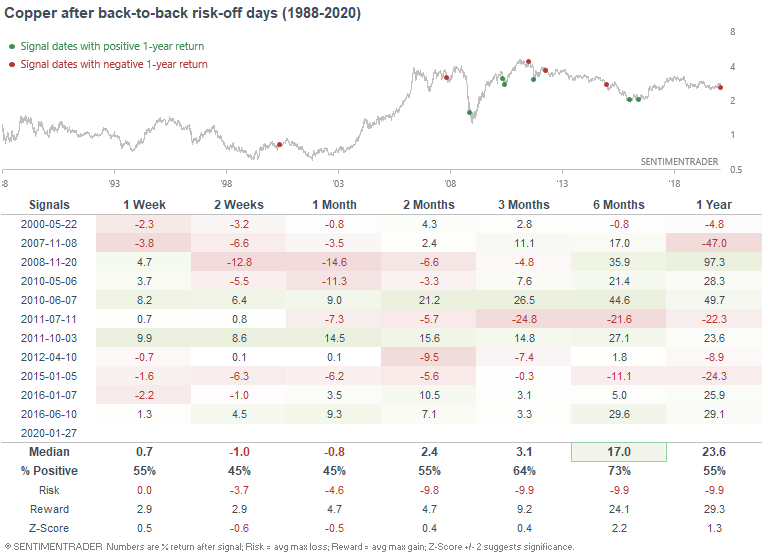
However, it did lean bullish for copper over the next 6 months:
As it was also bullish for oil:
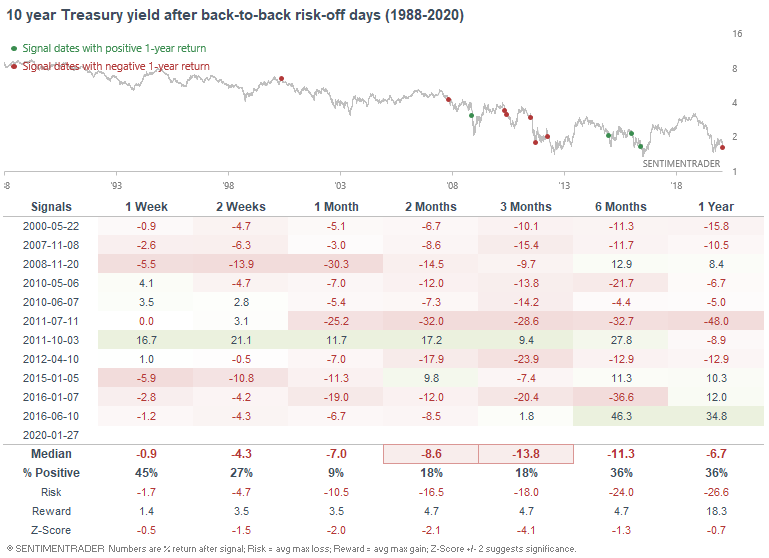
Bullish for bonds:
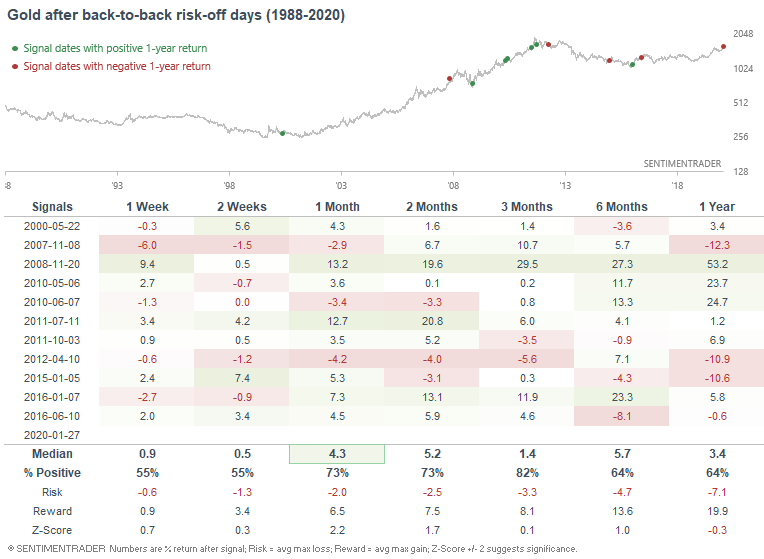
And slightly more bullish than random for gold:
Utilities
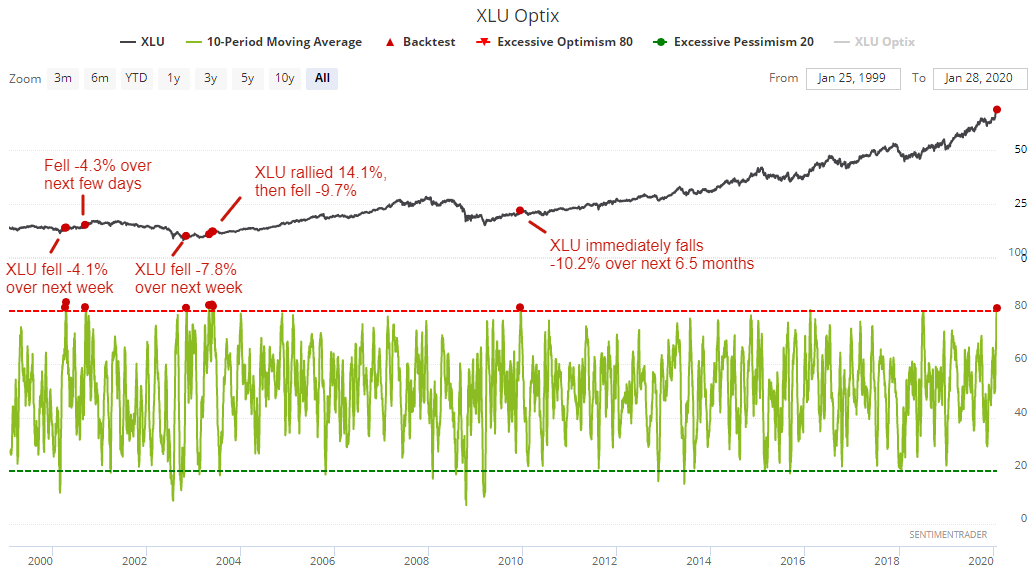
Utilities have surged over the past 2 weeks as the broad U.S. stock market's rally has lost steam. As a result of XLU's rally, its Optix's 10 day average has spiked to one of the highest levels ever:
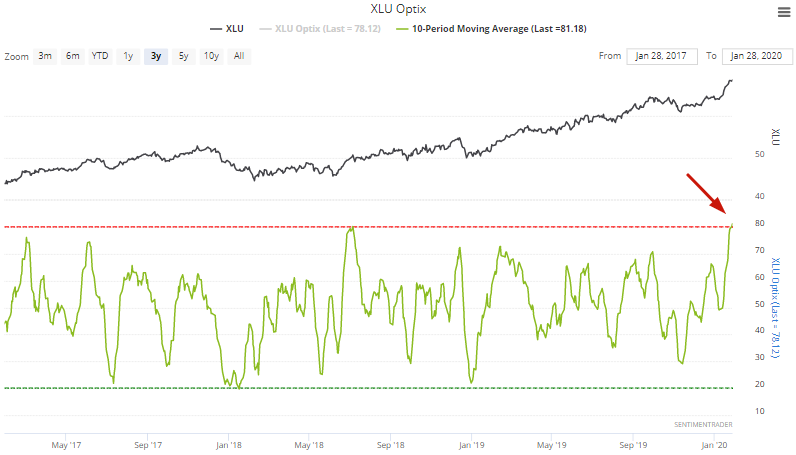
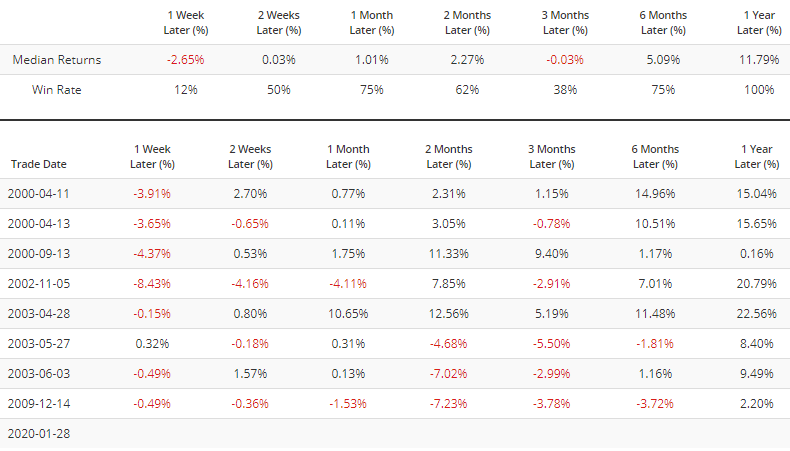
There are only a few historical cases in which Optix's 10 dma was this high, and all but one saw XLU either make a pullback or correction immediately:
China
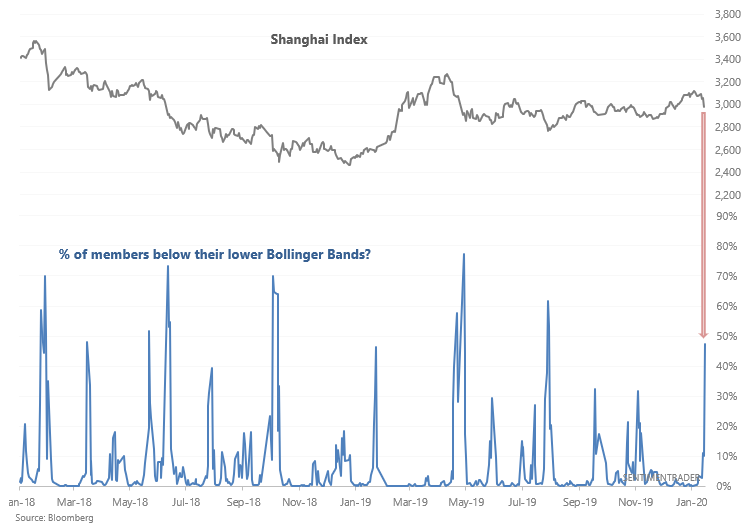
And lastly, Chinese stocks fell just before Chinese New Years, with 47% of the Shanghai Index's members falling below their lower Bollinger Band:
When this happened while the Shanghai Index was in an uptrend (above its 200 dma), the Shanghai Index usually fell even more over the next 2-4 weeks:
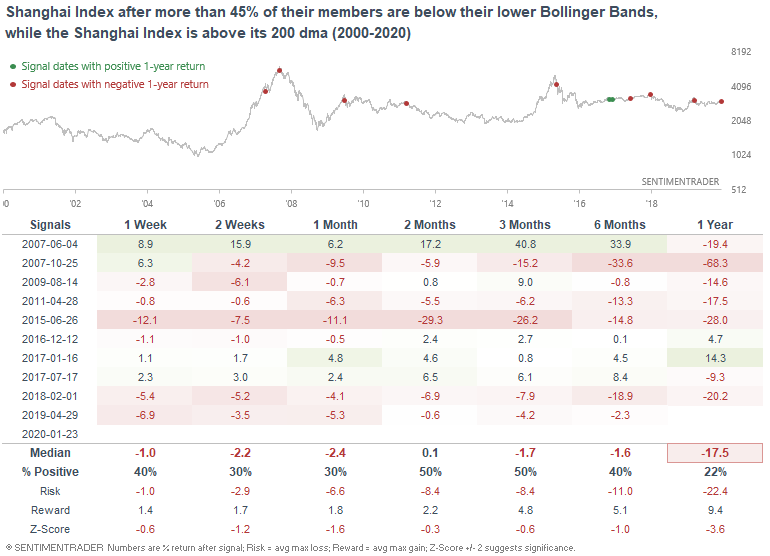
Here are the max drawdowns:
My trading portfolio
My trading portfolio is allocated 50% in the Macro Index Model and 50% in the Simple Trading Model With Fundamentals. At the moment I have instituted a discretionary override and gone 100% long bonds (instead of long stocks) due to the extreme nature of many of our core indicators, even though some of these core indicators aren't in the models.
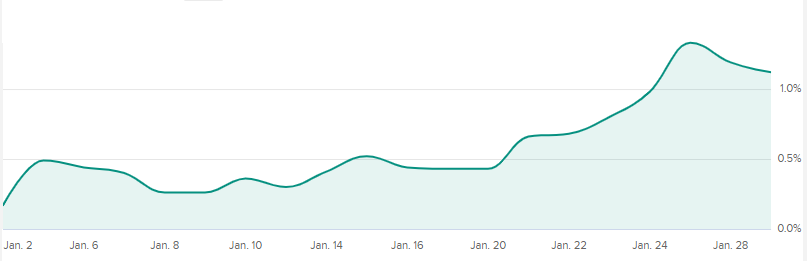
Performance YTD 2020:
- My trading account is up 1.12%
- Currently 100% in bonds