What I'm looking at - continued low volatility, Bollinger Bands, AAII
Here's what I'm looking at:
Low volatility (continued)
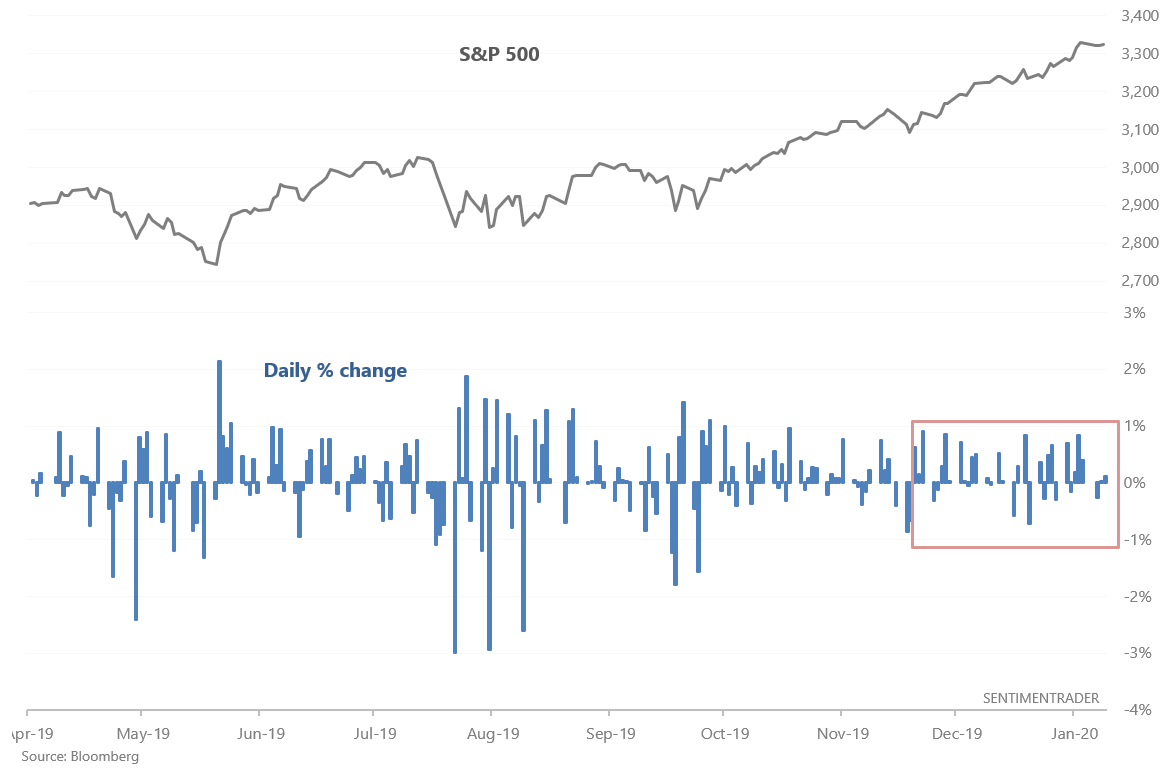
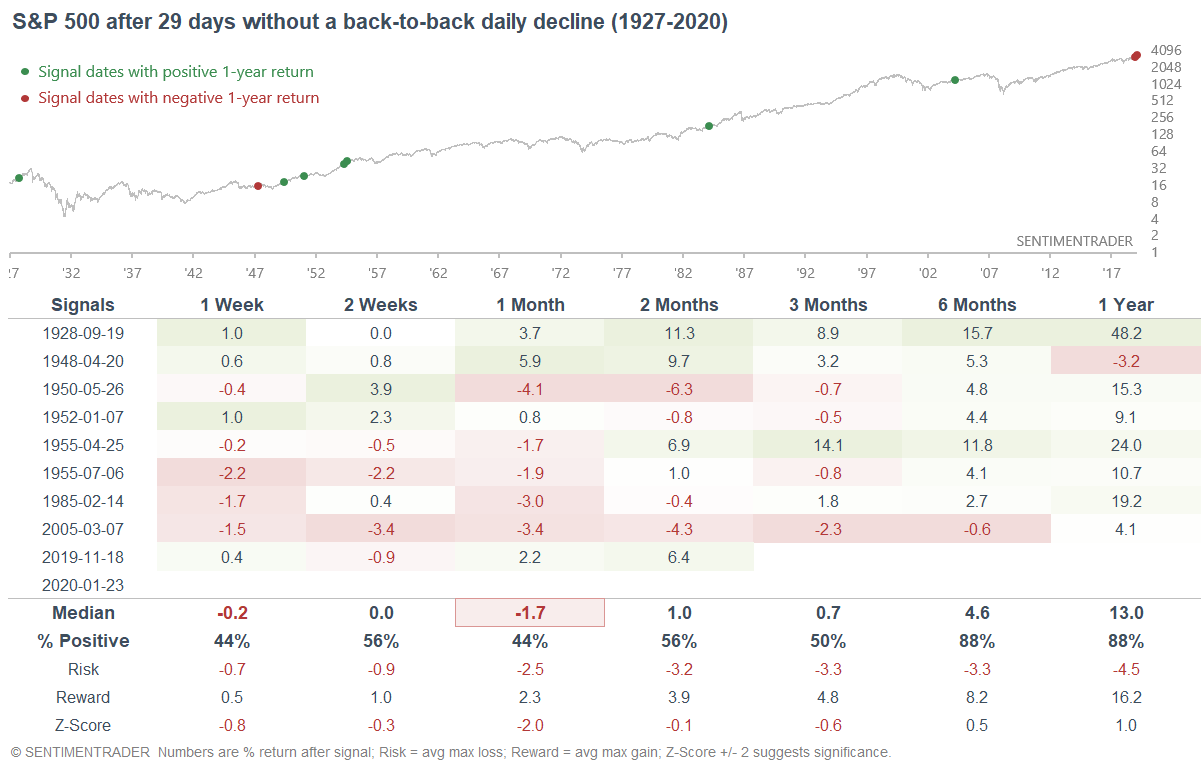
As I mentioned 2 weeks ago, the S&P 500 has gone many days without a +/- 1% daily move. From a slightly different perspective, Callie Cox noted that the S&P has now gone 29 days without a back-to-back daily decline:
Such low volatility (particularly downside volatility) usually led to a pullback in U.S. equities over the next month, particularly from 1950-present.
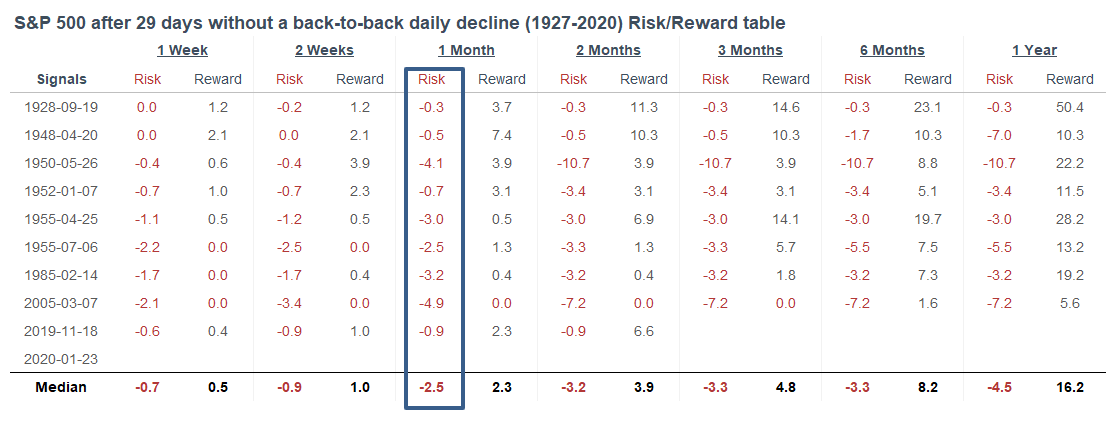
Here were the S&P's drawdowns over the next month:
Bollinger Bands
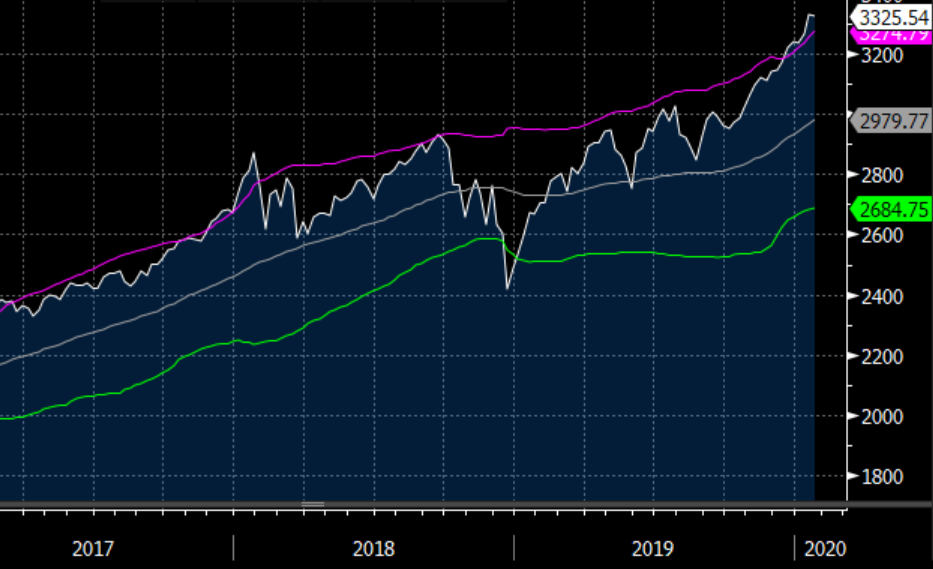
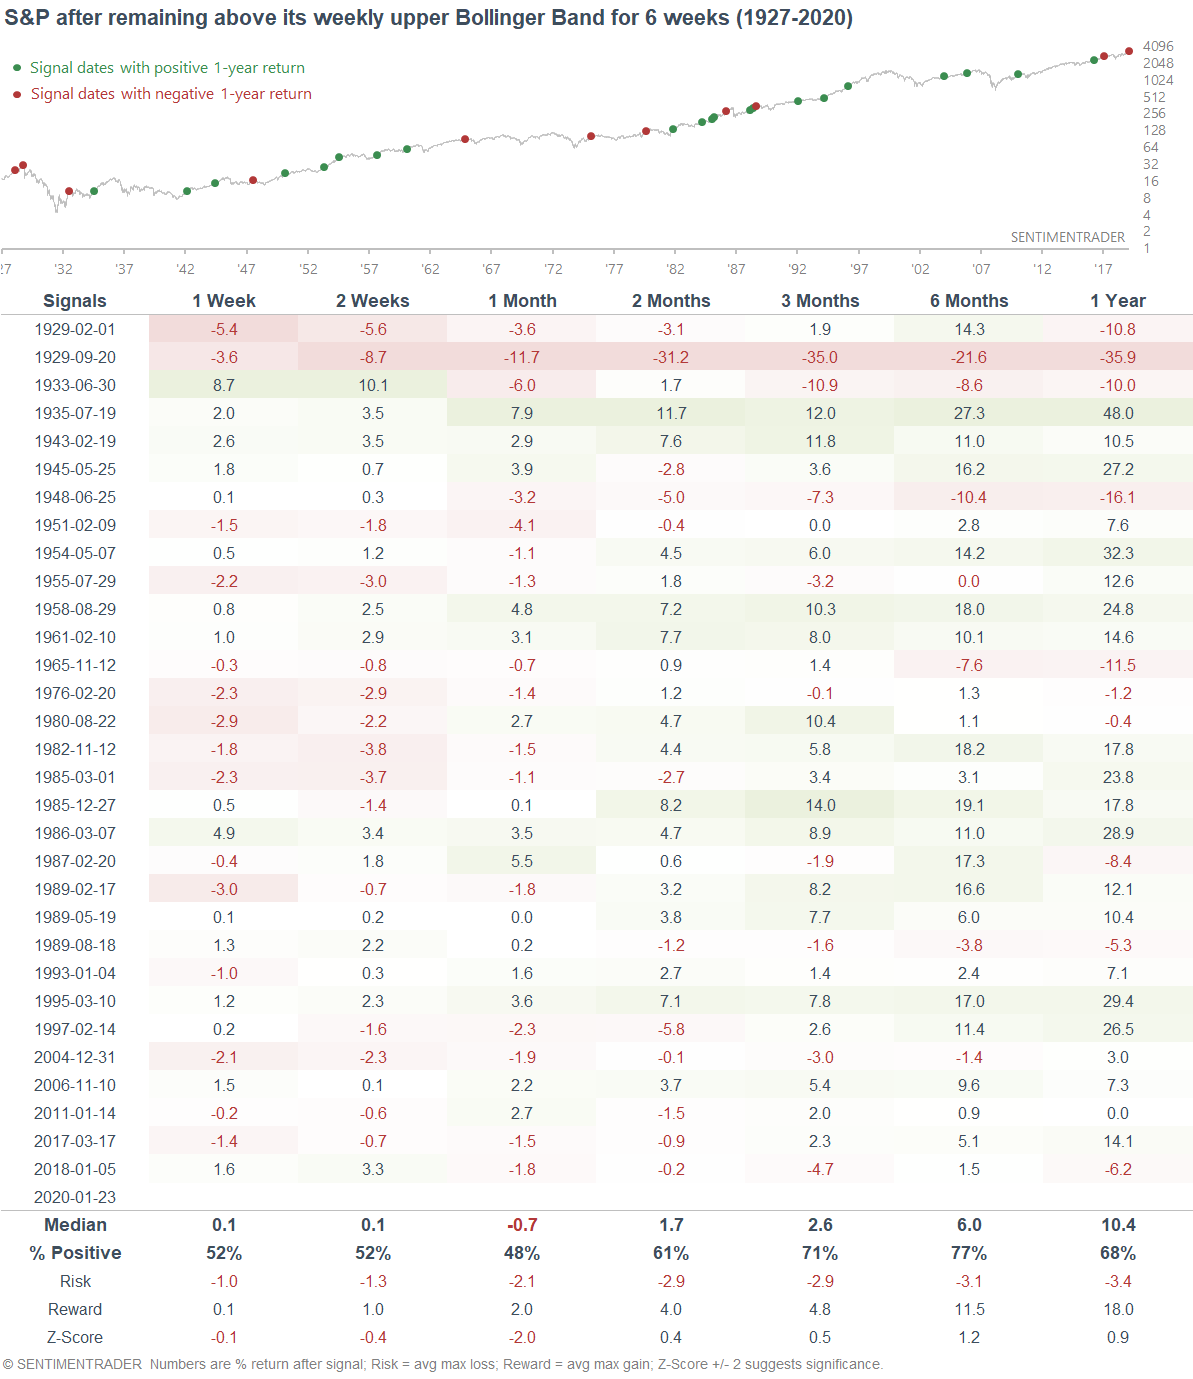
From a mean reversion perspective, the S&P has now spent almost 6 weeks above its upper Bollinger Band (using a 50 week moving average)
When the market was consistently overstretched in the past, the S&P's returns over the next month were worse than random:
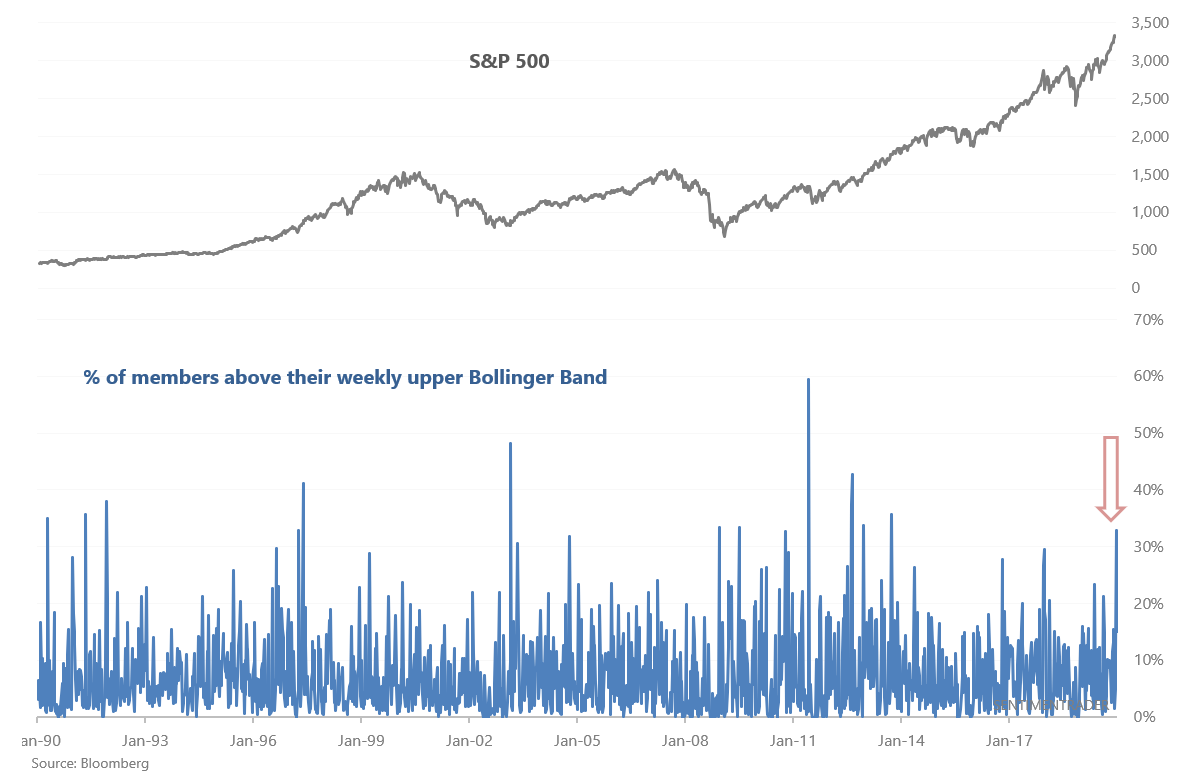
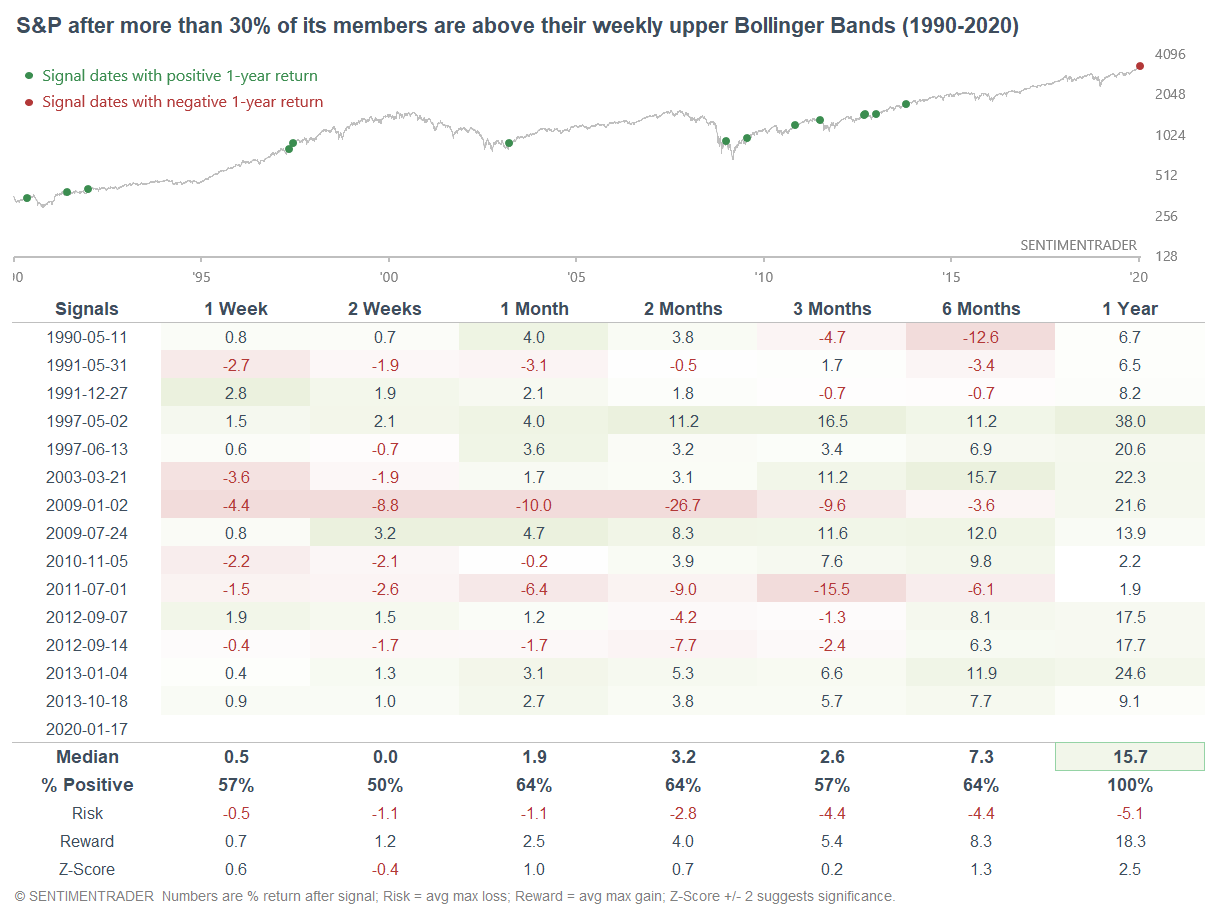
From a breadth perspective, last week saw 32% of the S&P's members above their 20 weekly upper Bollinger Band:
While this sometimes led to large losses for the S&P over the next 3 months, it always led to gains 1 year later:
AAII
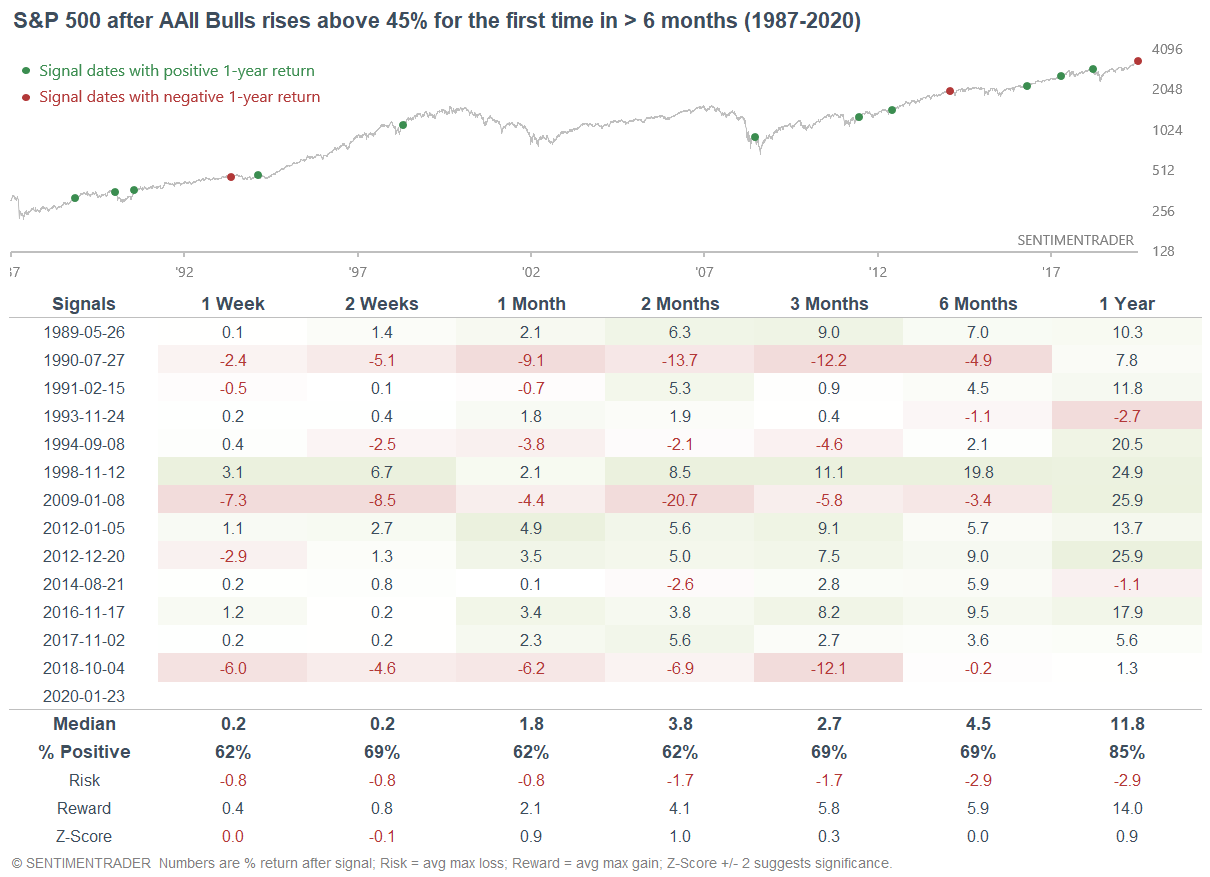
With the U.S. stock market still in an uptrend, the AAII Bull % is now above 45%, a level last attained in October 2018 as stocks fell:
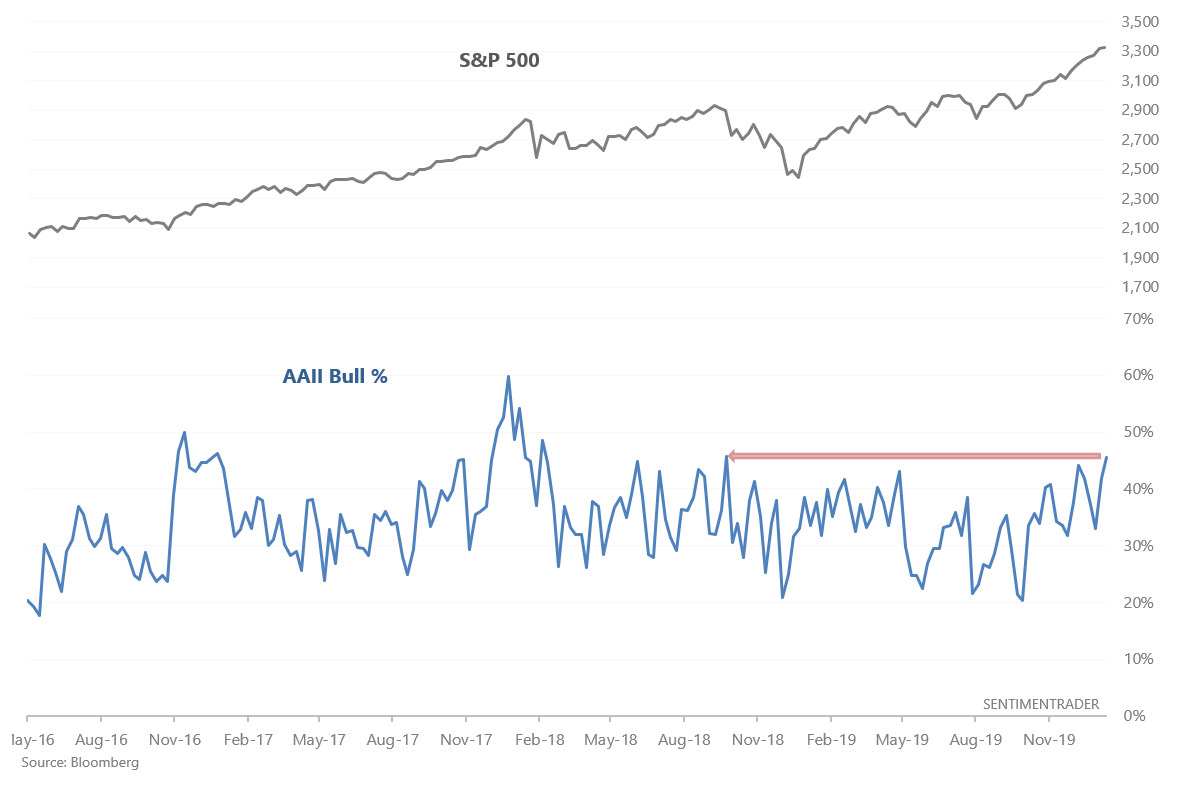
While one would assume that this is short term bearish for stocks (the last one certainly was), this hasn't always been the case. It did lead to some big declines in 2018, 2009, and 1990, but there were also plenty of other cases in which the S&P didn't fall over the next 1-3 months.
On a long term basis, this usually led to more gains for the S&P over the next year. This is typical for studies that look at extremely strong sentiment or momentum, which tends to occur within the context of a bull market. Only 2 cases saw losses over the next year, and both of those losses were minor.