What I'm looking at - Citigroup Economic Surprise Index, semiconductors, breakout, NAAIM, copper reversal?
The S&P has finally broken out from its month-long range. Here's what I'm looking at.
Citigroup Economic Surprise Index
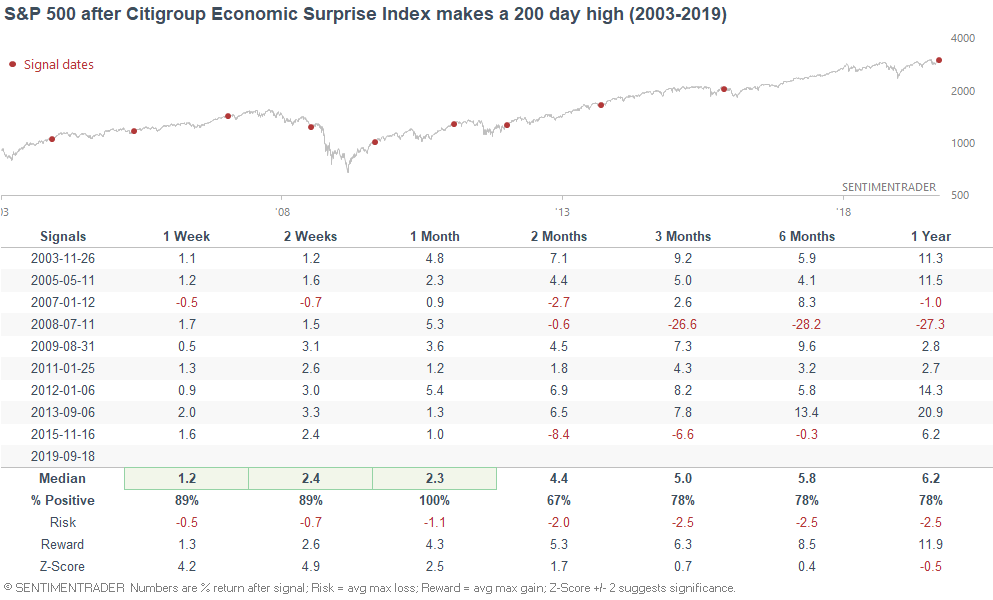
The Citigroup Economic Surprise Index has turned positive after being negative for 143 consecutive days. This was an extremely long streak, and economic data is now starting to outperform analysts' expectations.
*The Citigroup Economic Surprise Index measures economic surprises for the U.S.. Readings > 0 mean that over the past 3 months, economic data has been better than analysts' expectations.
When this happened in the past, the S&P usually did well over the next year. The one big exception was June 2008, when the economy was in a worsening recession.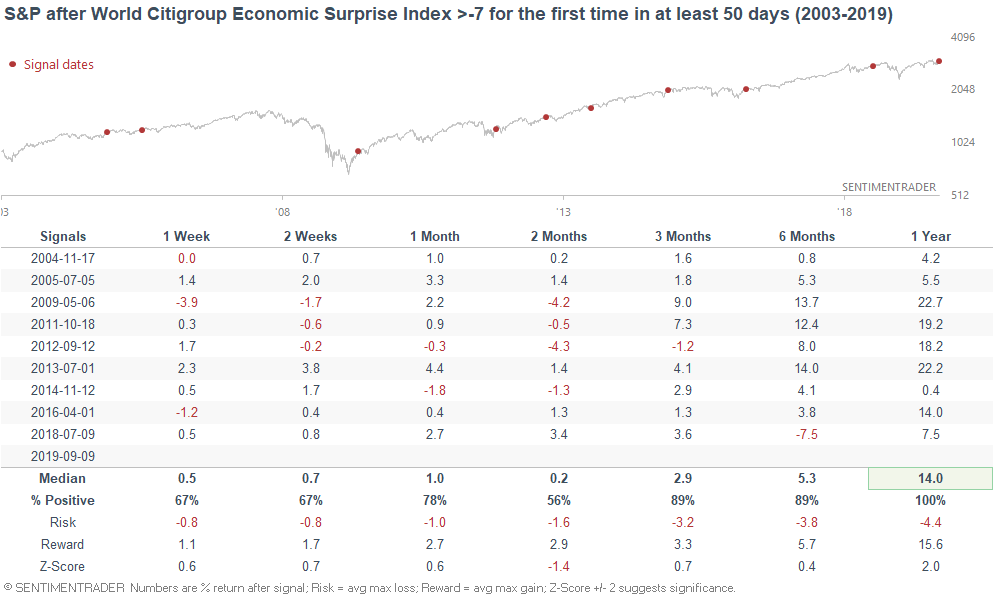
This wasn't consistently bullish or bearish for the U.S. Dollar or gold on any time frame.
Semiconductors
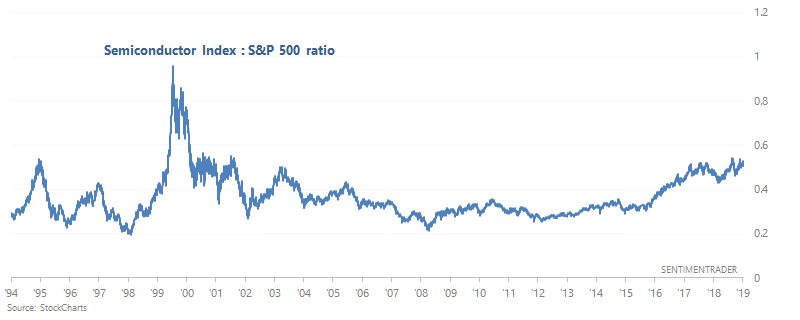
As David Keller pointed out, Semiconductors have continued to outperform the S&P 500. Here's the Semiconductor Index vs. S&P 500 ratio, which continues to trend higher.
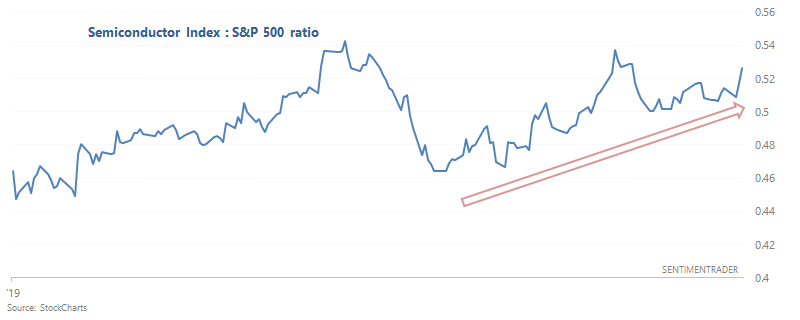
In general, it's better to buy stocks when the Semiconductor:S&P ratio is trending up than when the ratio is trending down. This is similar to relative strength between the NASDAQ Composite and S&P 500 (it's better to buy stocks when the NASDAQ is outperforming the S&P). Here's a 25 year chart of the Semiconductor Index : S&P 500 ratio.
The following charts looks at what happens if you buy and hold the S&P when the Semiconductor:S&P ratio is above its 200 dma, otherwise SELL. You can do 1 of 5 things when you SELL:
- Shift into 100% cash
- Short the S&P 500 (buy and inverse ETF)
- Shift to the Bloomberg Barclays U.S. Aggregate Bond Index
- Shift to the Bloomberg Barclays U.S. Corporate Bond Index
- Shift to the Bloomberg Barclays U.S. Treasury Bond Index
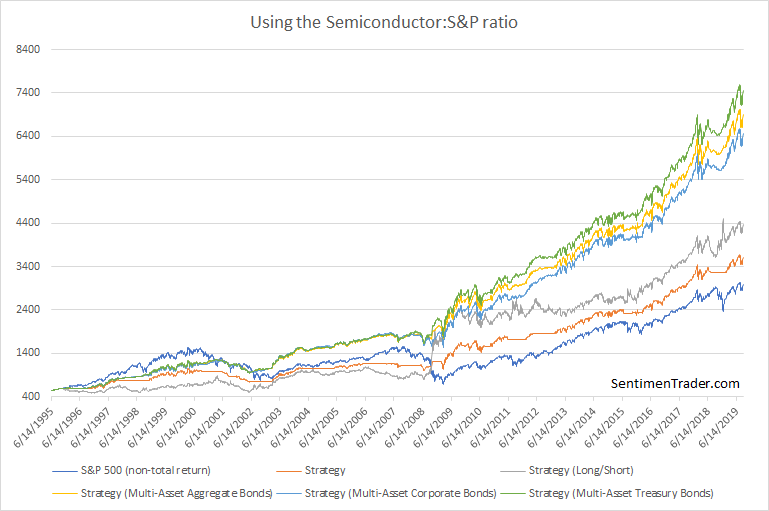
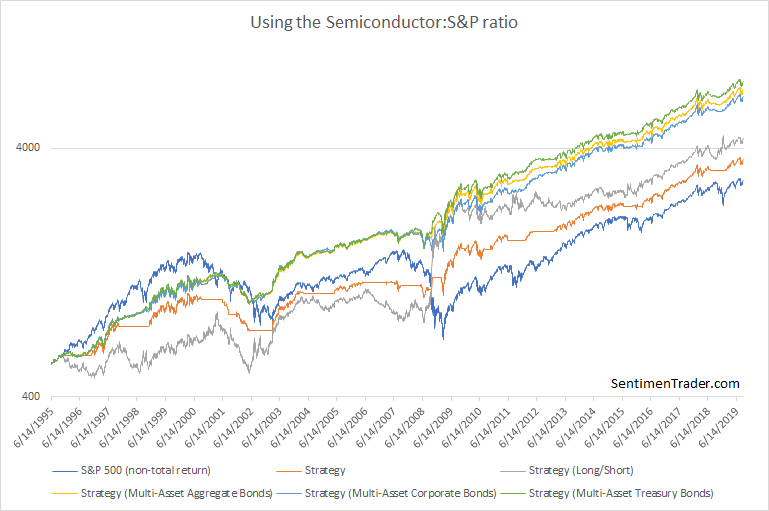
You can see that this trend following strategy beats buy and hold. Here's the same chart, but using a log scale.
Breakout?
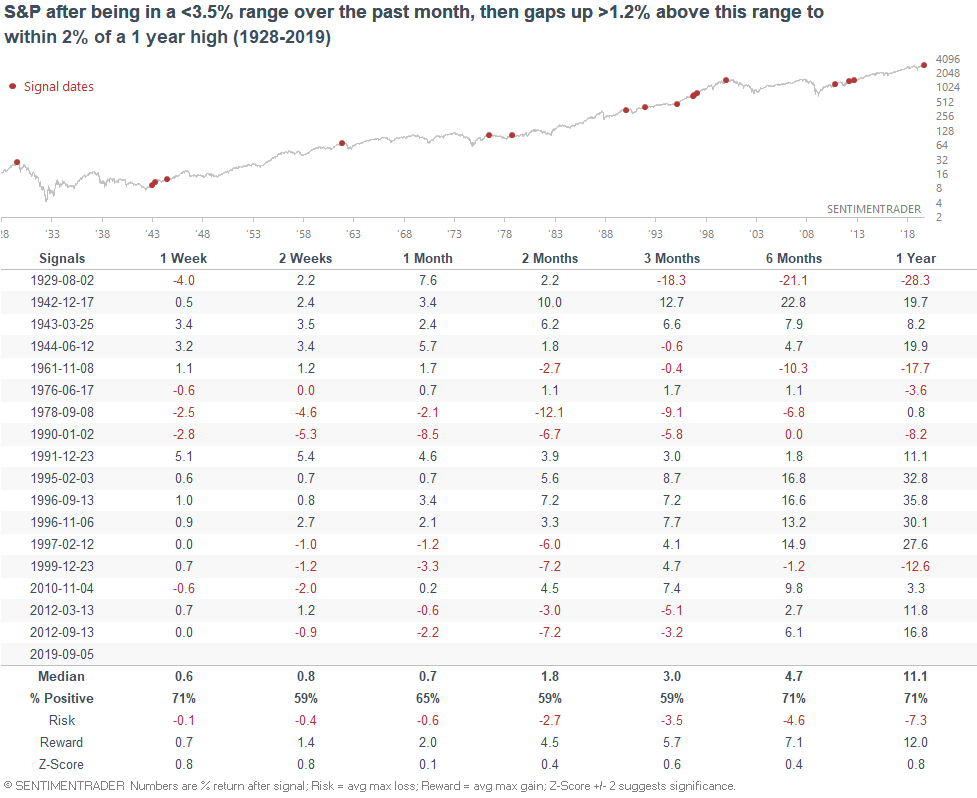
After swinging within a 3.5% range over the past month, it seems that the S&P 500 has finally broken out.

When these breakouts happened in the past, the S&P would often rally over the next week, but after that there was no clear bullish or bearish edge. Moreover, many of the max drawdowns were large, which demonstrates the prevalence of false breakouts.
Overall, I do not trust breakout patterns that much. For that matter, I don't trust traditional patterns much (and neither does Jason). Many patterns simply have too many false signals, rendering them perfect with 20/20 hindsight but not much better than a coin toss in real-time. Moreover, many patterns that once worked will become negated by algos simply because they used to work.
NAAIM
The NAAIM Exposure Index has fallen below 57%, even though the S&P 500 is rather close to an all-time high. Active managers are still wary of stocks, perhaps due to the ongoing trade war and recession fears.
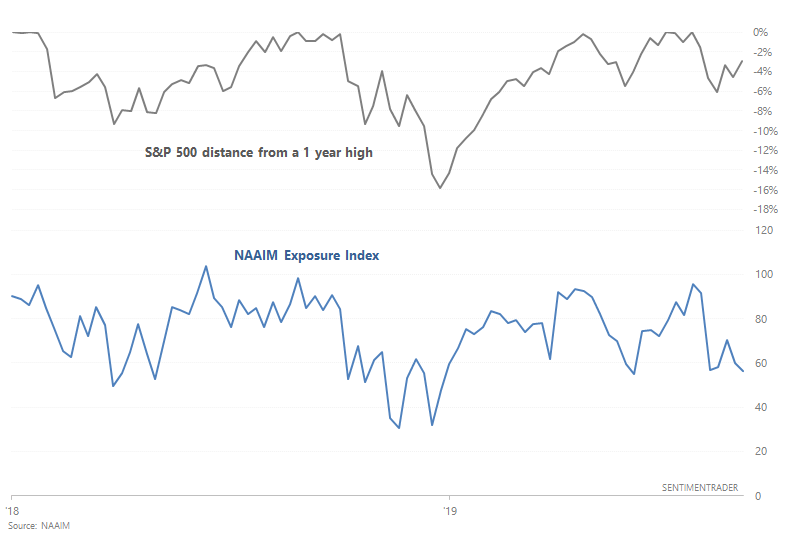
Sometimes these fears turned out to be accurate. 2 clusters of such signals occurred in mid-2007 and mid-2015, just before economic growth concerns started to put significant downwards pressure on the U.S. stock market.
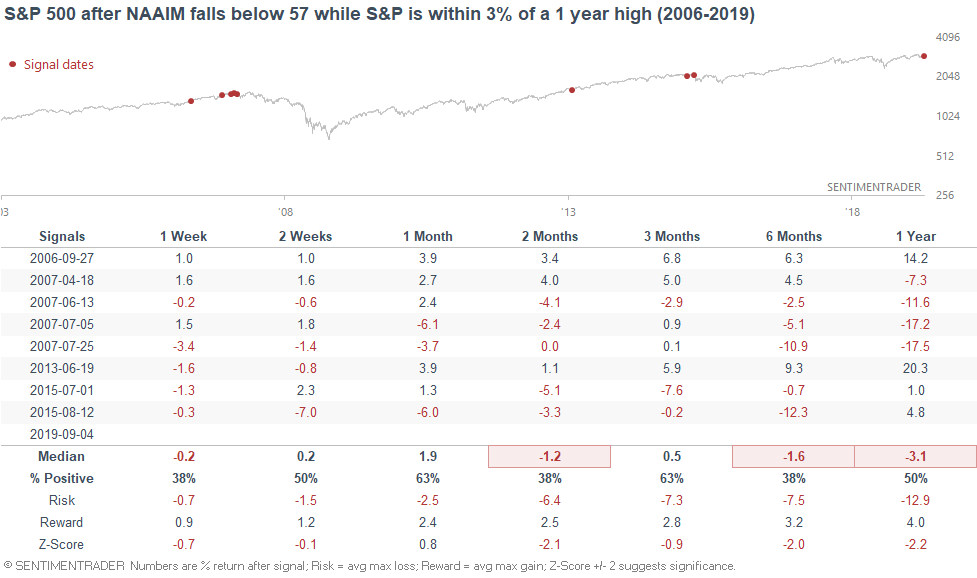
Overall, the sample size is a little small, and NAAIM's historical data is limited. I'm generally wary of using data series that have less than 15-20 years of historical data, no matter how popular they are.
Copper
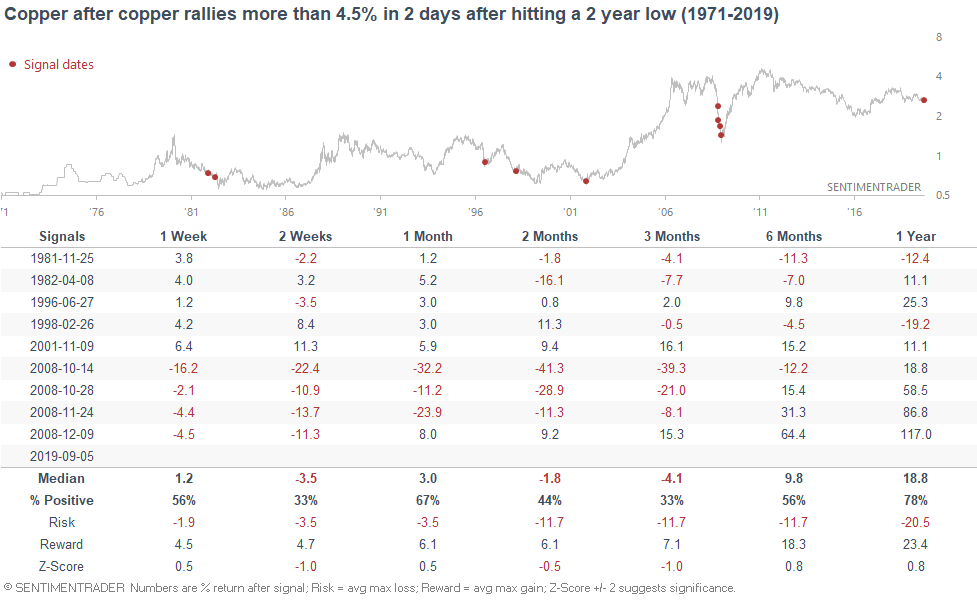
And lastly, copper has rallied significantly over the past 2 days. Is this the end of copper's long downwards slide?
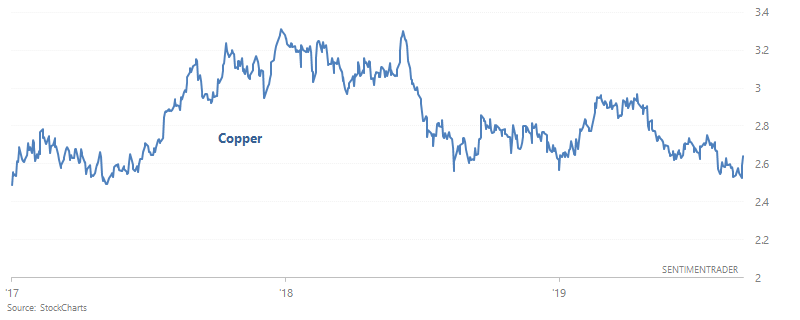
When copper hit a 2 year low and then rallied 4.5% in the past, it often did poorly over the next 3 months. Copper's bottoms usually are not V-shaped, unless the bottom was preceded by a mega-crash (e.g. 2008).