
What I'm looking at - business activity, GDP coincident index, Shanghai Index small range, persistent consumer staples
Here's what I'm looking at:
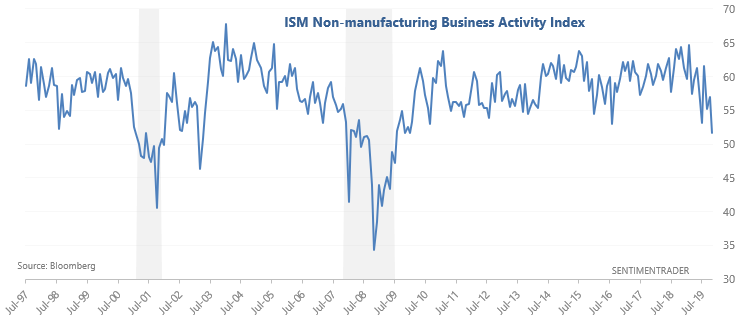
ISM Non-manufacturing Business Activity Index
The ISM Non-manufacturing Business Activity Index for November 2019 came in at 51.6, which is the lowest level since 2009:
Tariffs and the ongoing trade war remain key concerns for supply chain managers. When the Business Activity Index fell in the past, it wasn't decisive recessionary signal. While this did happen during 2001 and 2008, it also happened in 1998 (after a major correction) and 2016 (after a major correction).
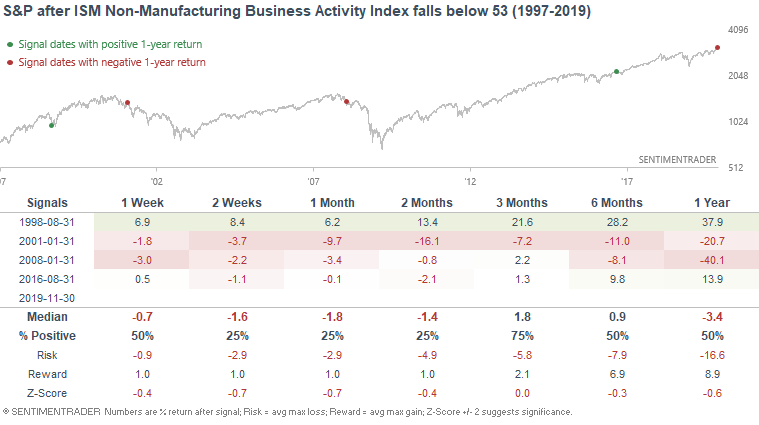
Overall, I would underweight the importance of ISM data. The ongoing trade war continues to distort economic data. Industries that are more reliant on global supply chains are hurting, whereas industries that are less reliant on global supply chains are faring better. That's why some economic indicators are near "recession era levels", while others demonstrate continued economic growth. Considering that the U.S. is a relatively closed economy compared to others such as Germany and China, domestic-focused data is more important than data that's more connected to ex-U.S. activities.
GDP Coincident Index
As Bloomberg TV notes, The U.S. Brave Butters Kelley Coincident Index has fallen to lowest level since the recession:
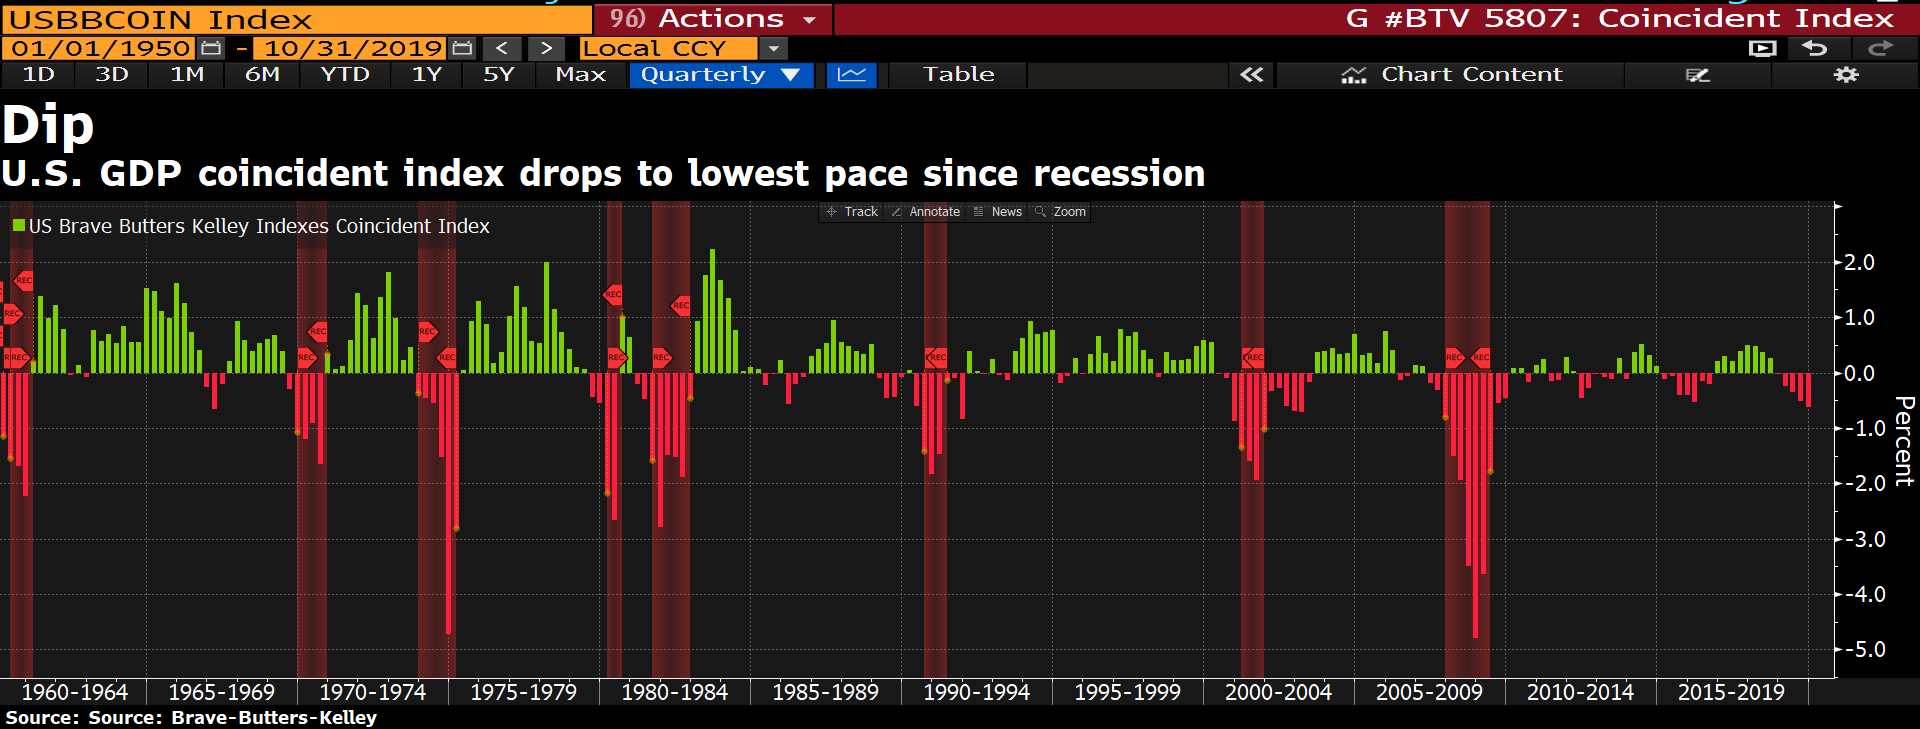
When this Coincident Index dropped to -0.6 in the past, the U.S. was often in a recession, hence why the stock market's returns over the next 3-6 months were mostly bearish:
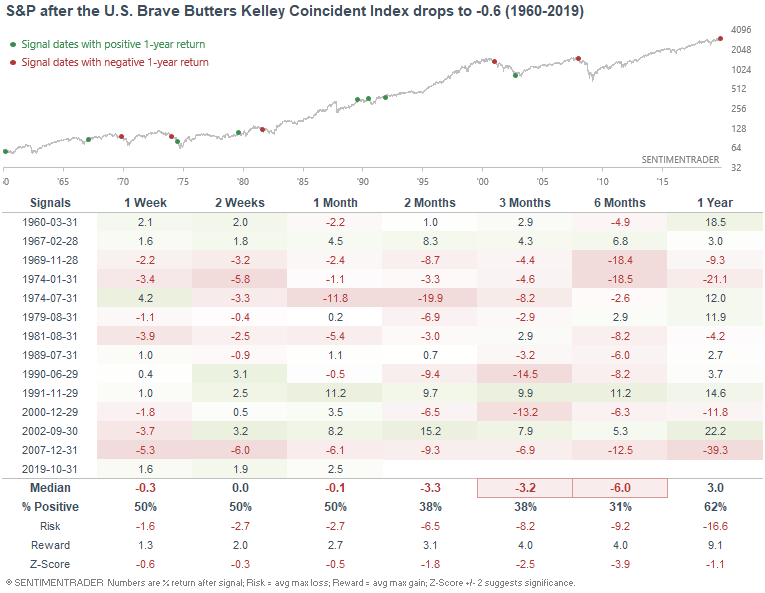
Would I be concerned about this? No. The U.S. Brave-Butters-Kelley set of indices looks at economic growth relative to trend. This doesn't look at whether or not GDP growth is negative. Since U.S. economic growth over the past 10 years has been consistently lower than in previous economic expansions, this figure is going to seem more bearish for the economy than it really is. That's why over the past 10 years, this Coincident Index has consistently flirted with negative territory. The U.S. economy isn't contracting - it's weaker "than normal". But then again, the entire expansion over the past 10 years has been "weaker than normal".
Small range
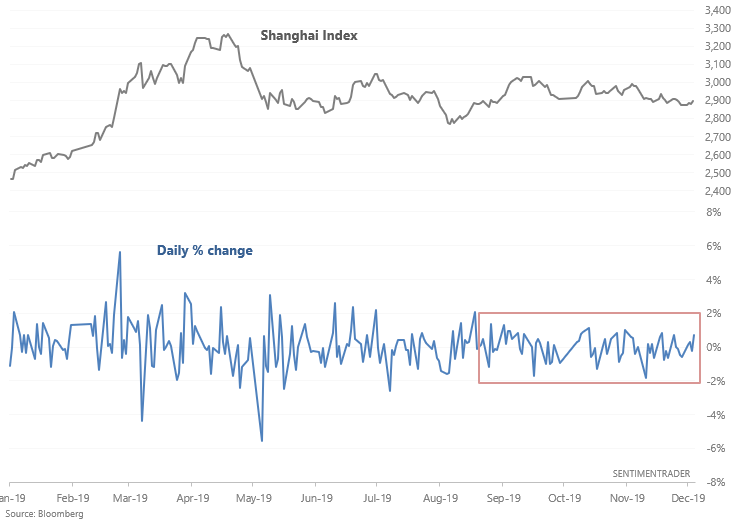
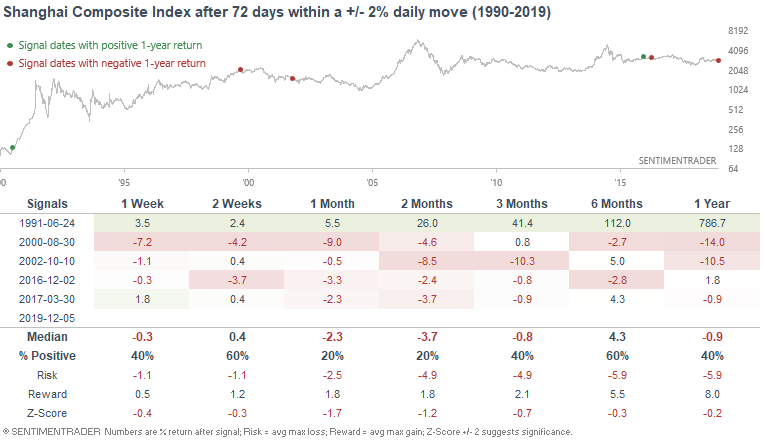
While many stock markets have been rallying over the past few months, the Shanghai Index has gone nowhere. The Shanghai Composite Index has gone 72 days without a daily move of -2% or +2%, which is an incredibly long streak for a market that's usually jumpy.
When this happened in the past, the Shanghai Composite Index usually fell over the next 1-2 months. The only bullish case was in 1991, just as this index was being launched.
Consumer staples
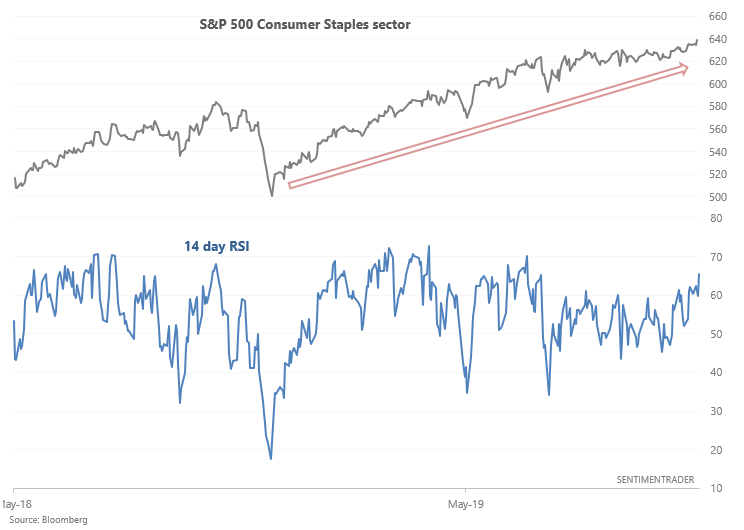
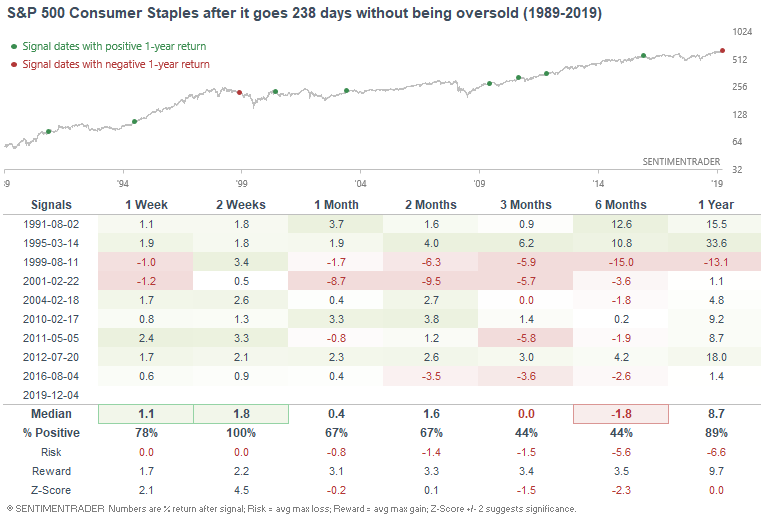
With traders skittish throughout this entire year (as seen through fund flows), various defensive sectors like Consumer Staples and low volatility stocks have done well. The Consumer Staples sector has been in a persistent uptrend this year, with hardly any sustained pullbacks. As a result, it has gone 238 days without being oversold (RSI falling below 30).
When this happened in the past, the Consumer Staples sector usually rallied further over the next 1-2 weeks. But looking further out, this sector usually stumbled over the next 3-6 months as traders shifted from defensive sectors to offensive sectors, particularly over the past 20 years. This often happened after major corrections such as those in 2011 and 2015-2016, and even when these corrections ended, traders took months before they got over the most recent scare.
My trading portfolio
I've been moving countries and changing residencies over the past half year, so I haven't done much trading up until a month ago. Now that I've settled down, I've reopened trading accounts. In the interest of transparency, I'm going to show you what my own trading portfolio is doing, similar to what Jason does.
From October 25 (when I started to trade again) - present:
- My account is up 2.29%
- Currently 100% in bonds
I don't place discretionary trades - these are purely based on my quantitative models.