
What I'm looking at - breakouts, rotation away from defensives, more frothy sentiment
While I was sick last week, several notable things have been going on in financial markets. Let's dive into it:
Breakouts
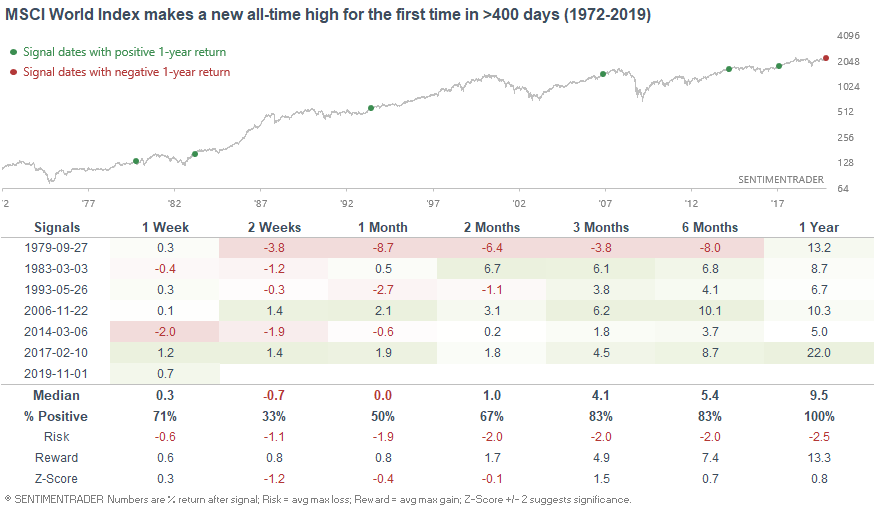
As global stocks continue to rally, various indices continue to breakout and ex-U.S. equity indices are showing stronger breadth. For starters, the MSCI World Index (including U.S.) broke out to a new all-time high at the start of November.
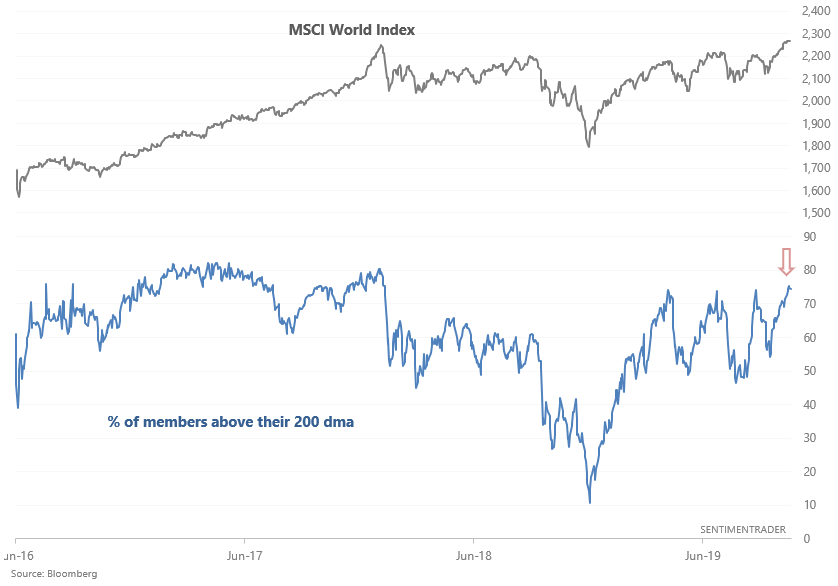
More recently, the MSCI World Index's breadth is improving. The % of members above their 200 dma has reached 75% for the first time since early-2018. (This breadth figure was previously hurt by ex-U.S. stocks, which significantly underperformed U.S. stocks throughout much of 2018 and this year but are now starting to recover.)
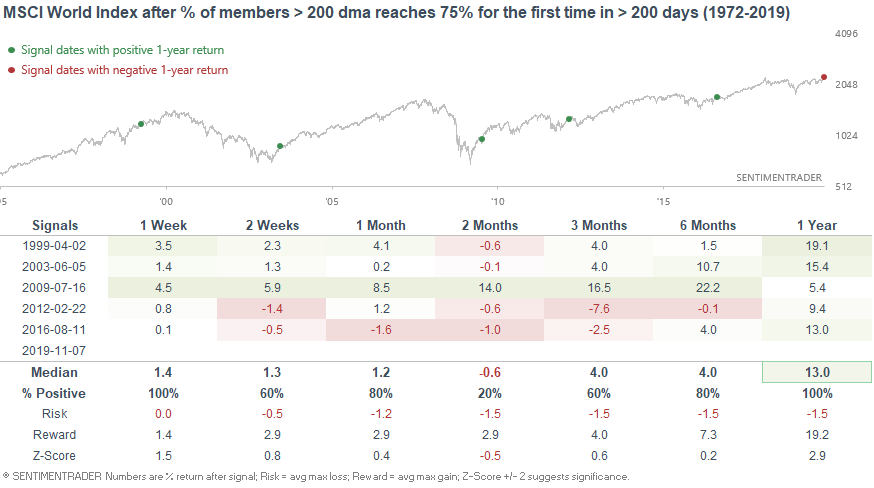
When the % of members above their 200 dma reached 75% for the first time in more than 200 days, the MSCI World Index's 1 year forward returns were bullish. This reflects a classic "breakout" pattern.
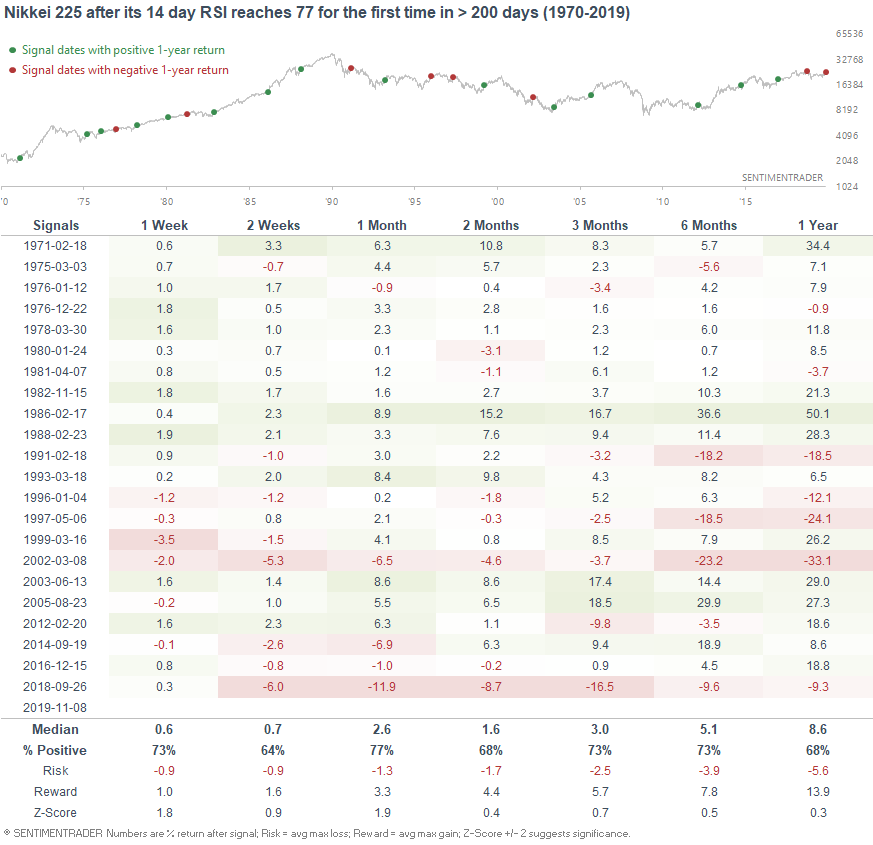
Japanese and German equity markets are 2 of the strongest breakout examples.
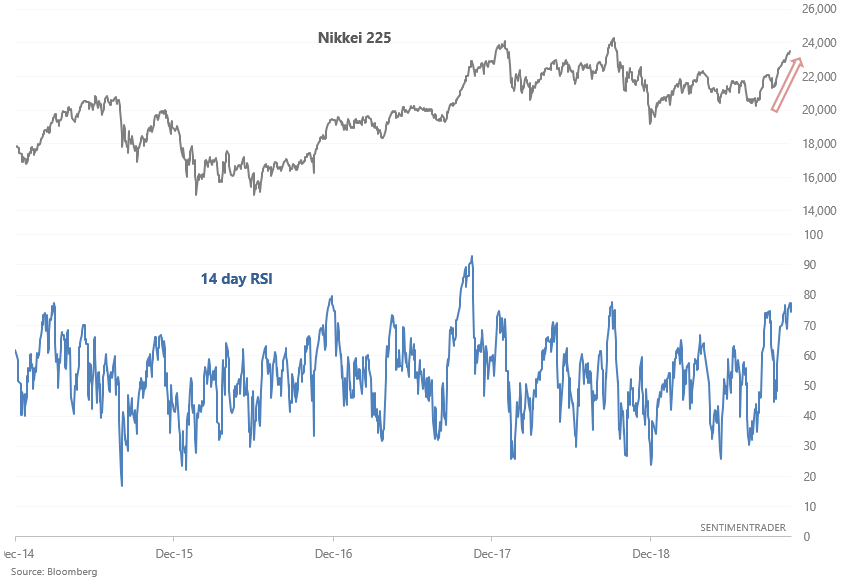
Japan's rally has pushed its RSI close to 80 for the first time in years. When this happened in the past, the Nikkei 225 typically continued to rally over the next month:
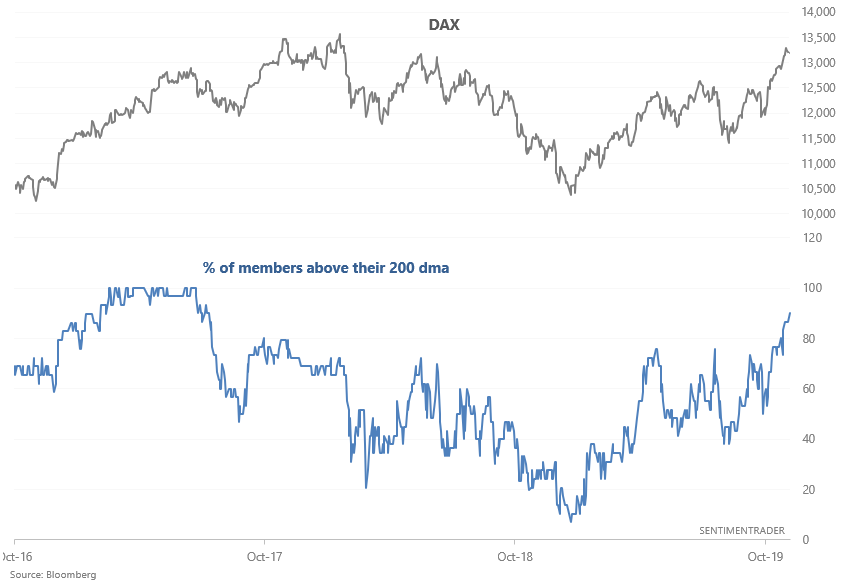
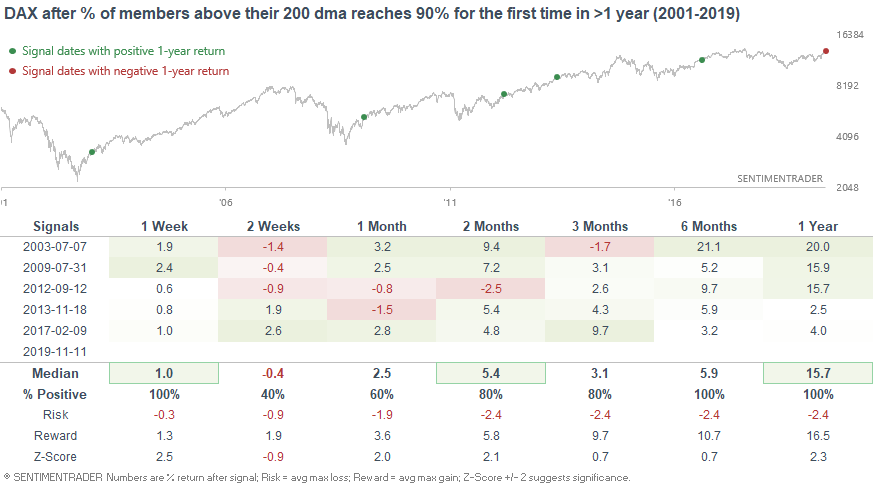
The % of German stocks above their 200 dma has reached 90% for the first time since 2017 (which is amazing, considering all the German recession headlines):
Similar to MSCI breadth, this was mostly bullish for the DAX:
Rotation away from defensives and safe havens (e.g. bonds and gold)
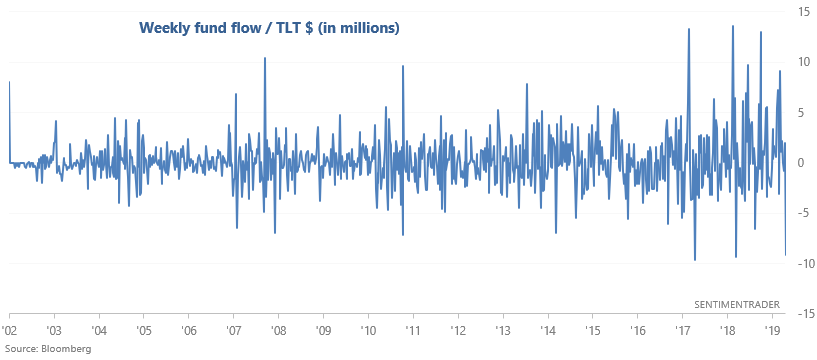
As Lisa Abramowicz noted, last week saw a massive jump in TLT outflows ($1.236 billion), just as stocks rallied to all-time highs:
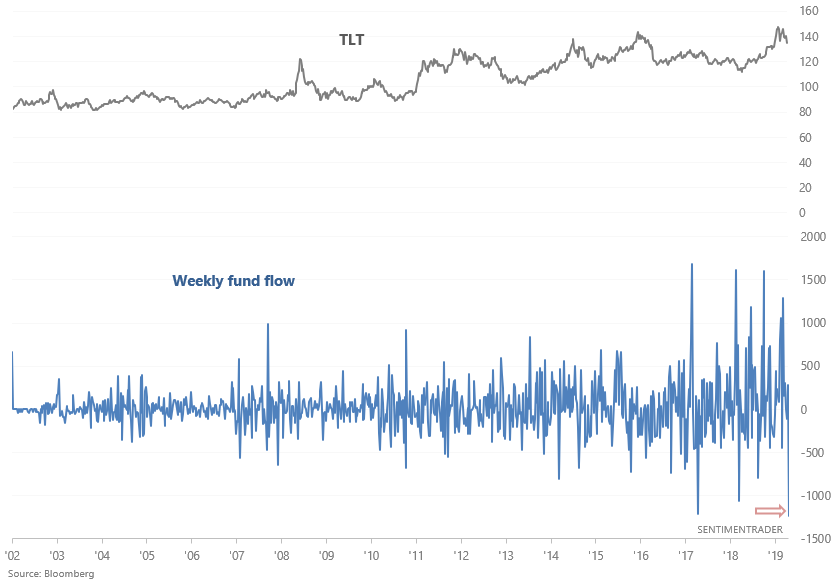
Perhaps this isn't a great short term move for investors fleeing safe haven assets. For a more effective way of looking at outflows, we can divide the weekly flows by TLT's price:
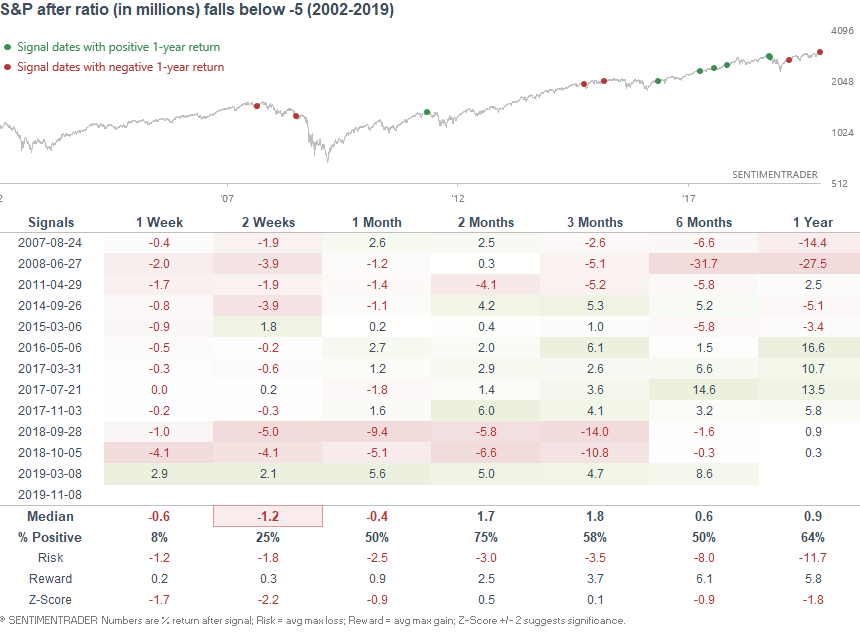
When this ratio dropped below -5 in the past (in millions $), the S&P's returns over the next 1-2 weeks were almost universally bearish:
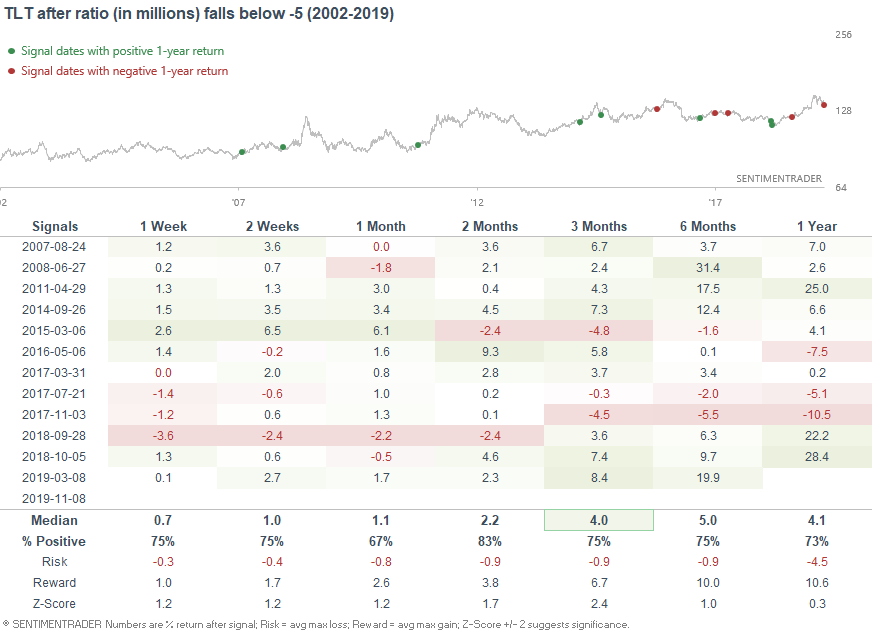
As for TLT itself, forward returns over the next few weeks and months were mostly bullish:
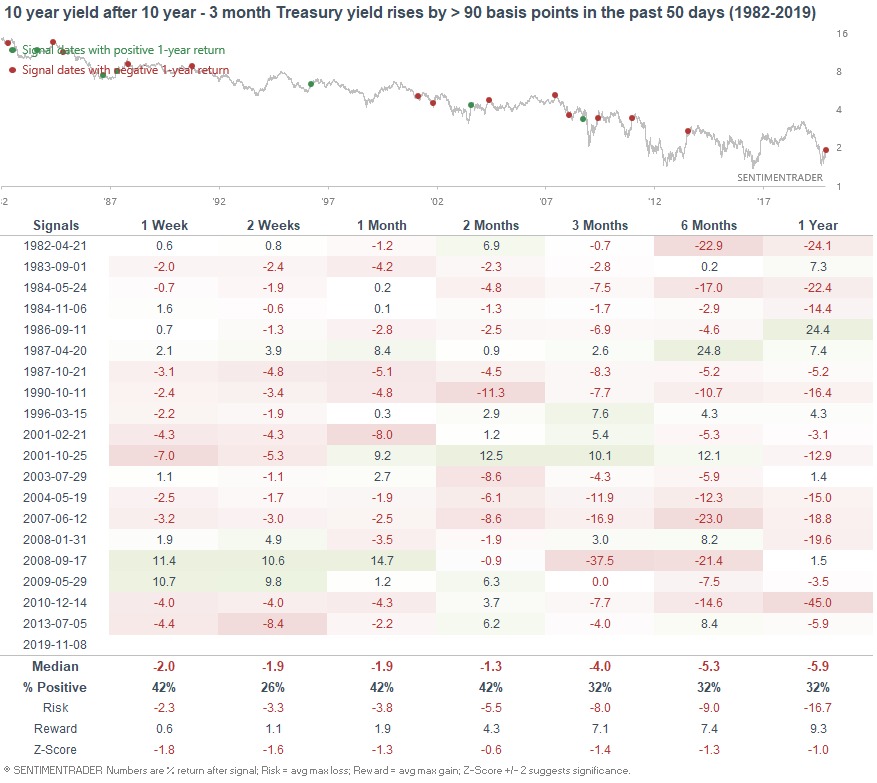
With long term Treasury yields increasing a little and short term yields still falling, the 10 year - 3 month Treasury yield curve has steepened by more than 90 basis points over the past 50 days:
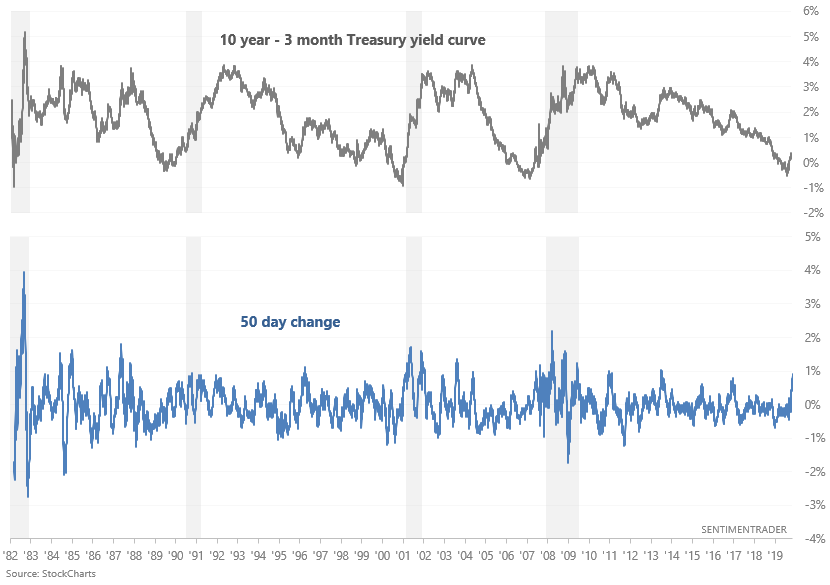
When the yield curve steepened by this much, this fast, the 10 year Treasury yield usually continued to fall.
Meanwhile, gold tanked last week:
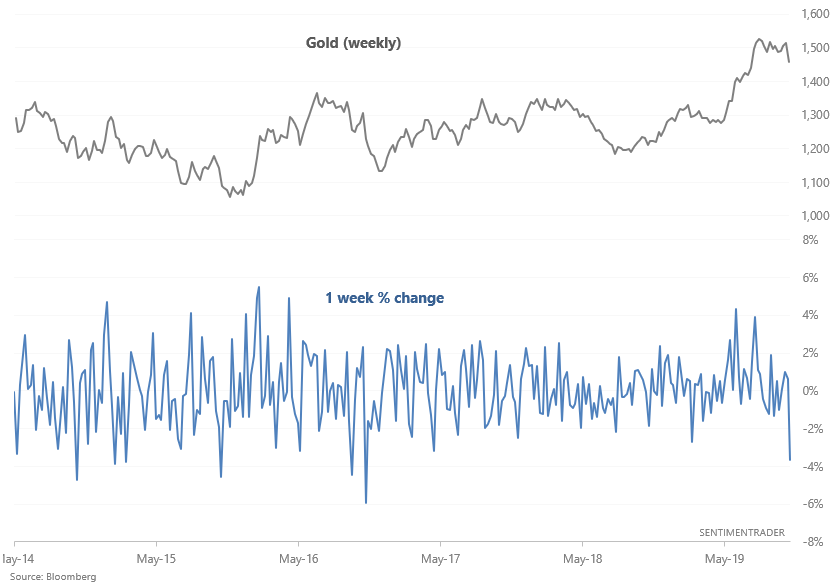
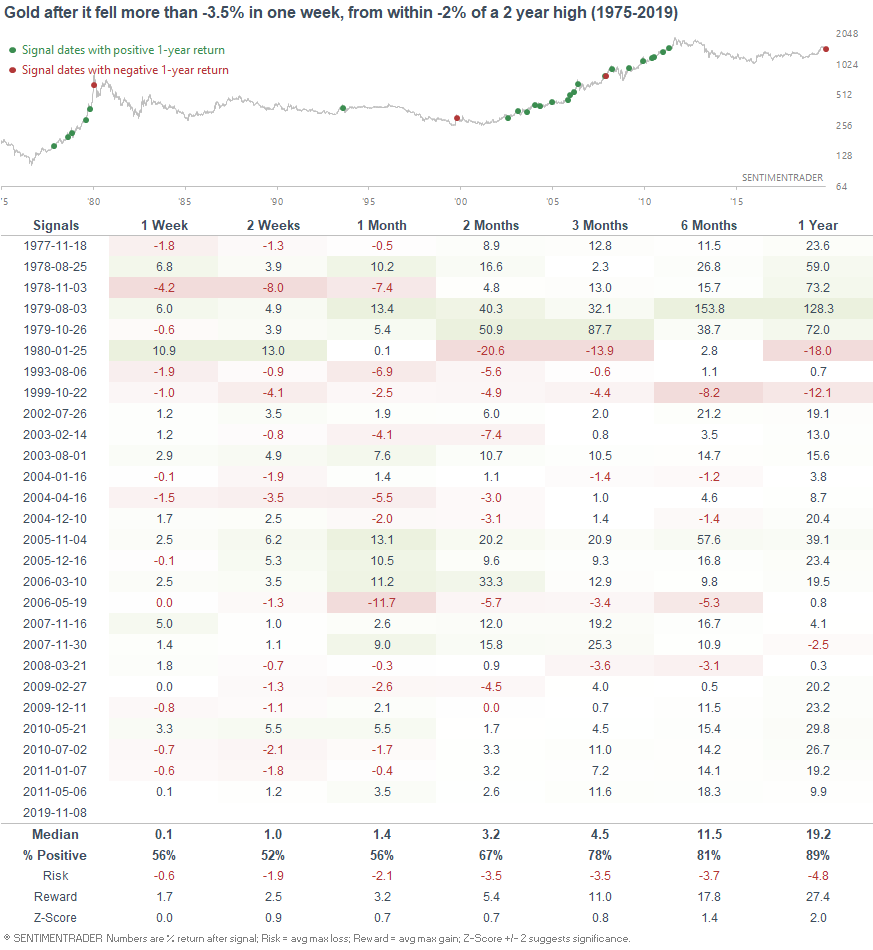
When gold fell more than -3.5% in one week while close to a multi-year high, its short term forward returns were mixed, but 3-12 month forward returns were mostly bullish:
More frothy sentiment?
While some long term sentiment indicators are still relatively pessimistic, various short term and medium term sentiment indicators are demonstrating excess optimism. This increase the probability of a short term pullback.
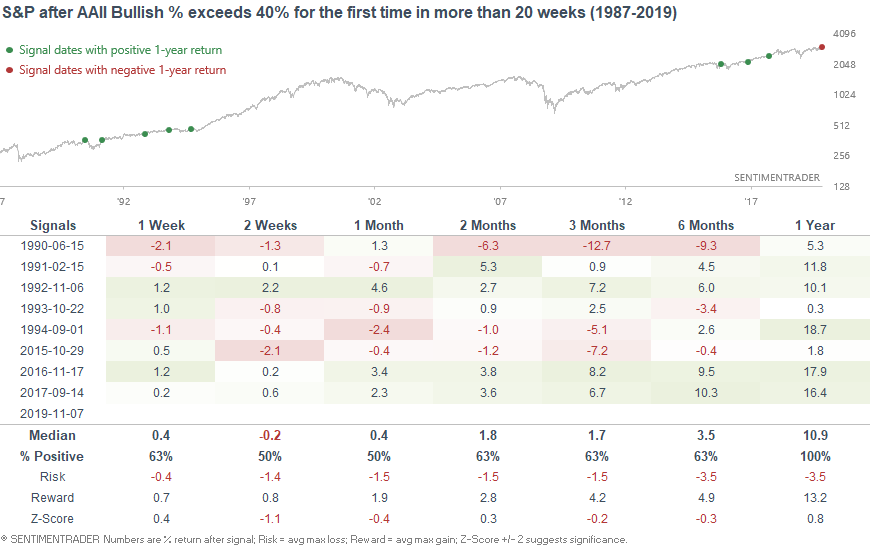
For example, AAII Bullish % has exceeded 40% for the first time in 25 weeks:
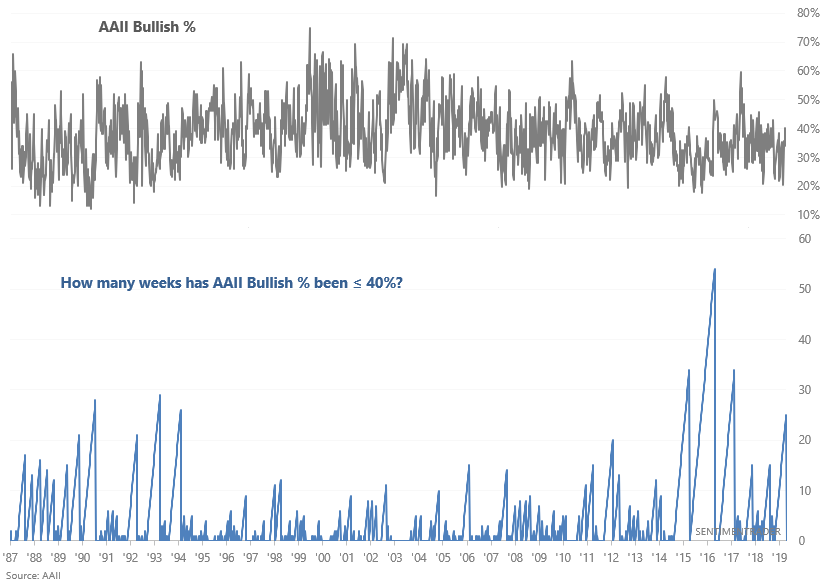
When it did so in the past, risk:reward didn't favor stocks over the next 2 weeks, even though 1 year forward returns were bullish:
In addition, the Smart Money/Dumb Money Confidence Spread is now at one of the most extreme readings over the past 2 decades:
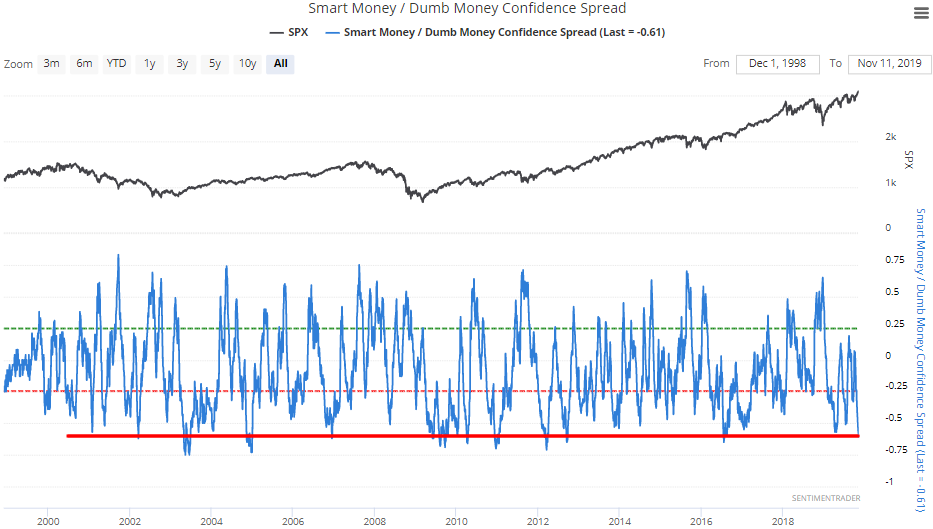
When the Confidence Spread fell below -0.6, the S&P's returns over the next 2 months were consistently worse than random:
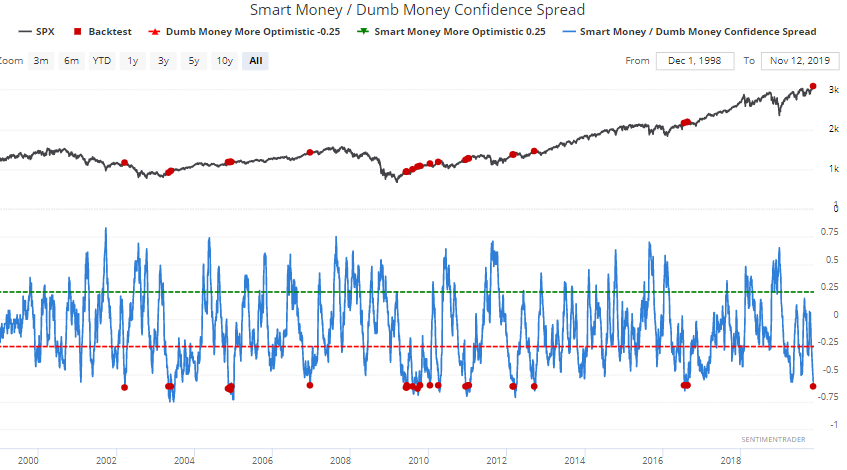
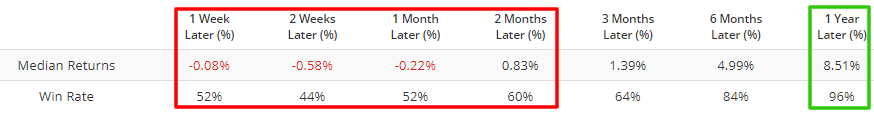
It's also worth noting that such extreme optimism was also almost exclusively bullish for stocks over the next year, with the single exception being 2002.
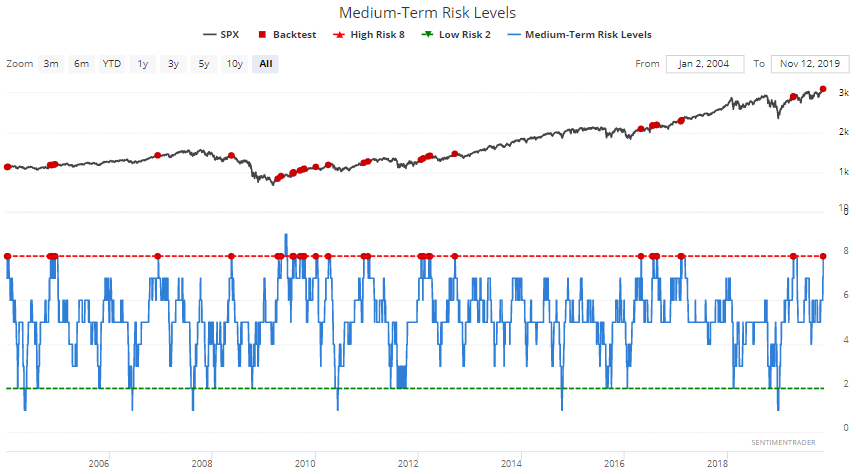
Meanwhile, Medium Term Risk Levels are high:
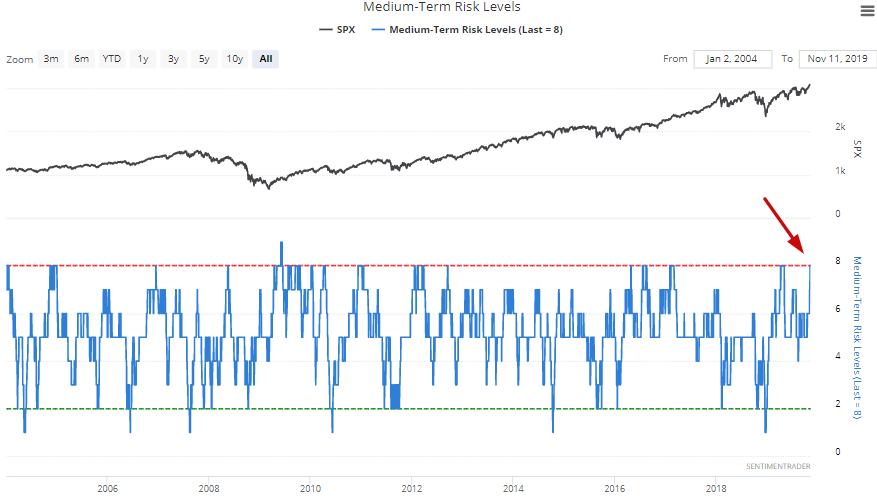
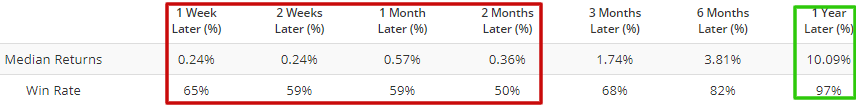
When this happened in the past, the S&P's returns over the next 2 months were more worse than random, but 1 year forward returns were almost exclusively bullish:
But as stocks continue to rally this year, several sentiment indicators (including long term sentiment indicators) continue to demonstrate investor pessimism. For example, mutual funds and ETFs (within the U.S. and outside) continue to experience strong outflows. Here's a 20 week average for Fund Flows (Combined Total):
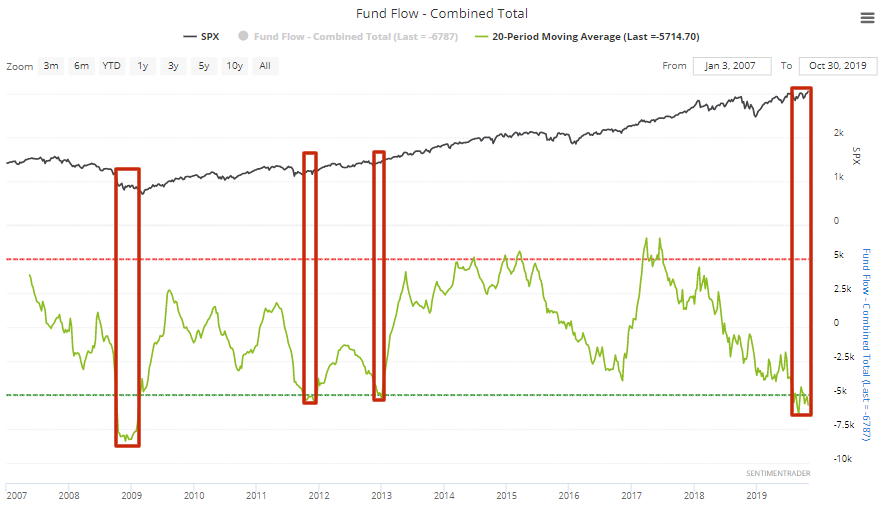
From a long term perspective (e.g. 1 year), this is bullish for equities.
Volatility
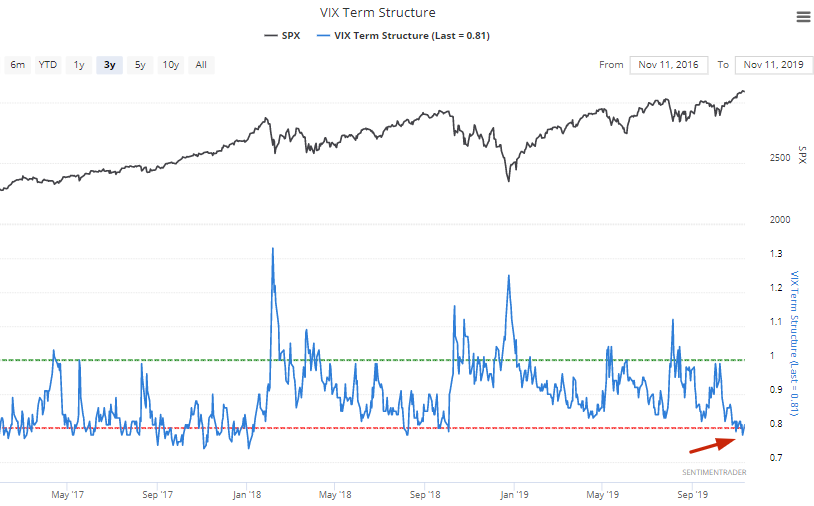
With stocks in an uptrend, volatility remains low. VIX's term structure (1 month VIX futures vs. 3 month VIX futures) fell to 0.78 last Friday, which is one of the lowest levels over the past 2 years:
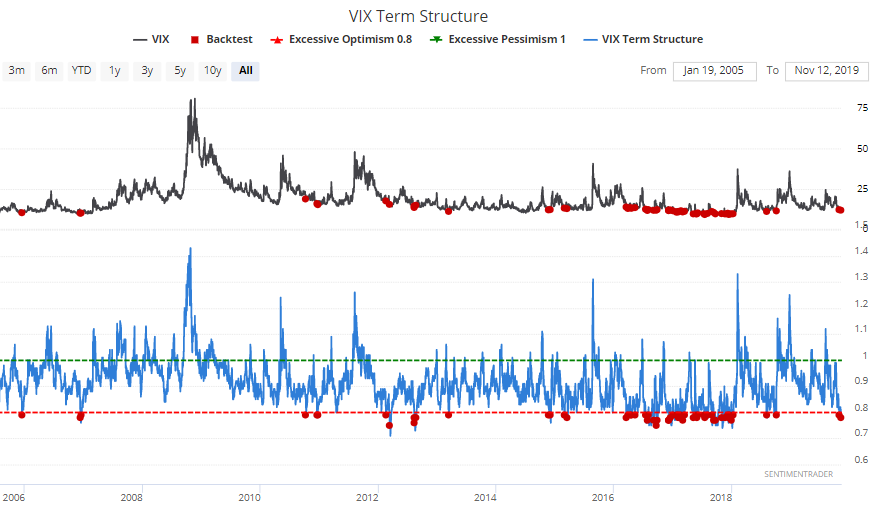
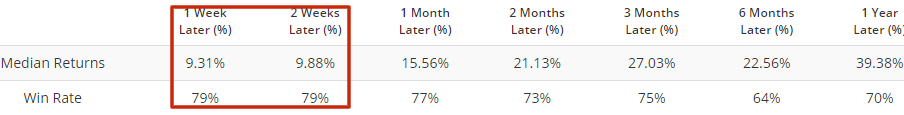
When VIX's term structure fell below 0.79 in the past, VIX often jumped over the next 1-2 weeks:
Conclusion
- Long term risk:reward doesn’t favor bulls.
- Fundamentals (6-12 months): still bullish because there is no significant U.S. macro deterioration.
- Technicals (3-6 months): neutral/bullish
- Technicals (1-2 months): neutral/bearish
As always, I have more confidence in higher time frame predictions than shorter time frame predictions. The shorter the time frame, the more random and unpredictable events (e.g. a trade war tweet) can impact the markets.
Got any questions/comments? Feel free to email me at [email protected]