Data &
Technology
Research
Reports
Report Solutions
Reports Library
Actionable
Strategies
Free
Resources
Simple Backtest Calculator
Simple Seasonality Calculator
The Kelly Criterion Calculator
Sentiment Geo Map
Public Research Reports
Free Webinar
Pricing
Company
About
Meet Our Team
In the News
Testimonials
Client Success Stories
Contact
Log inLoginSign up
< BACK TO ALL REPORTS

What I'm looking at - breadth warnings, USD's drop, gold's rally

Troy Bombardia
2020-02-22
The stock market's drop has triggered several breadth warnings.

Here's what I'm looking at:


Breadth warnings - Hindenburg Omen

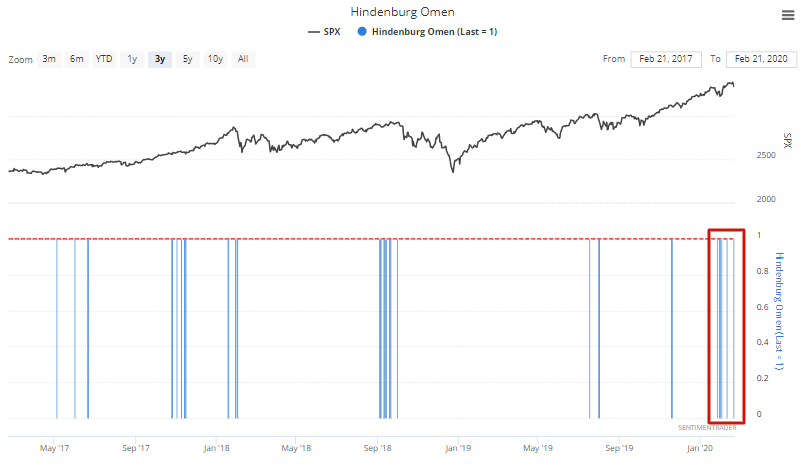
The Hindenburg Omen has triggered again for the 6th time over the past 19 trading days. Some market watchers have noted that the Hindenburg Omen hasn't been a particularly effective bearish signal recently (it has marked more bottoms than tops). That's primarily because many of the S&P 500's recent pullbacks have been shallow, so any indicator thusfar has "failed" at predicting a pullback. It doesn't mean that the Hindenburg Omen overall is ineffective. No indicator works 100% of the time - indicators will invariably go through stretches when they work extremely well and other stretches when they don't work well.

With that being said, a cluster of 6 Hindenburg Omen signals in 20 days is bearish for stocks over the next 3 months.

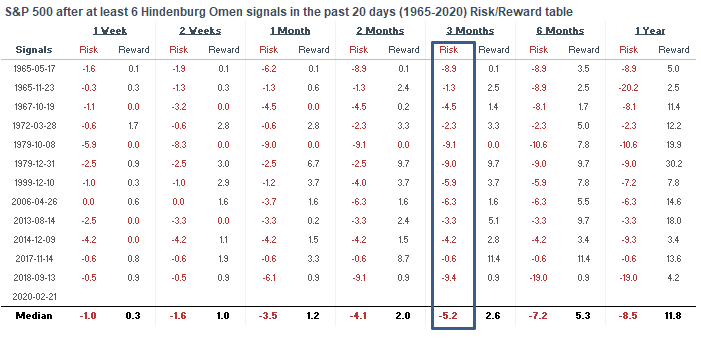
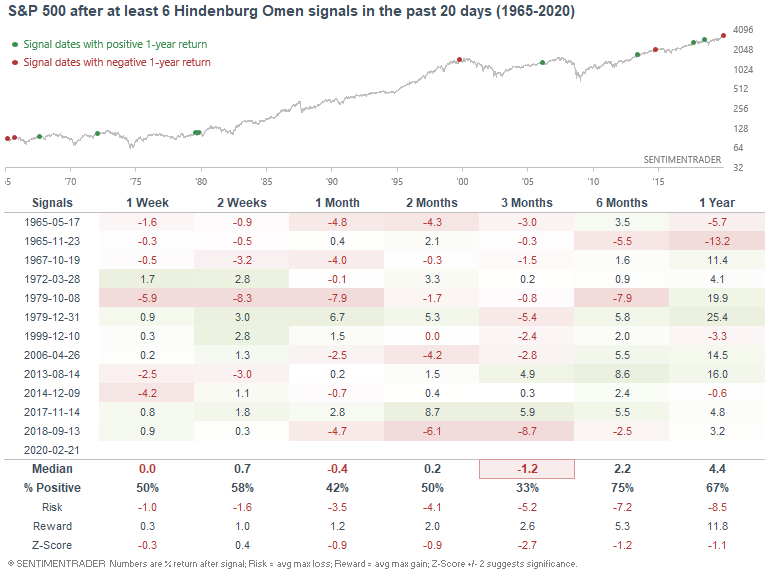
Several of the 3 month forward cases saw large drawdowns:


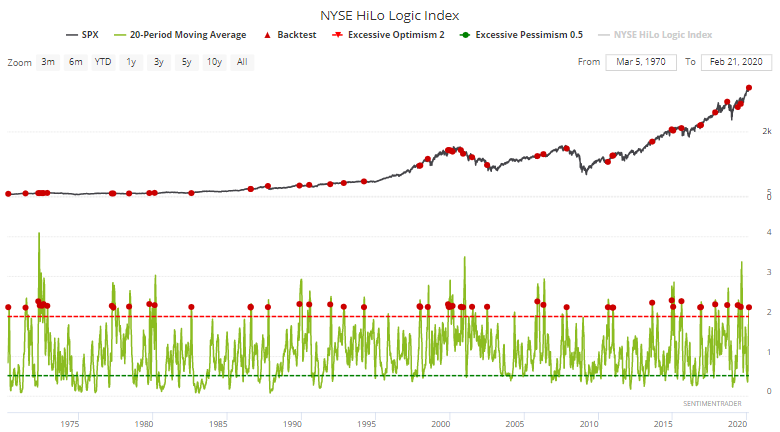
Breadth warning - HiLo Logic Index

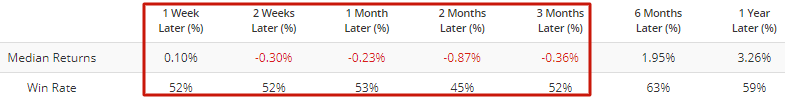
The HiLo Logic Index, a "split" breadth indicator which is of great use when applied to trading models, has remained elevated over the past few weeks. Its 20 day average is currently above 2.21, which historically led to worse-than-random returns for the S&P 500 over the next 1-3 months. 
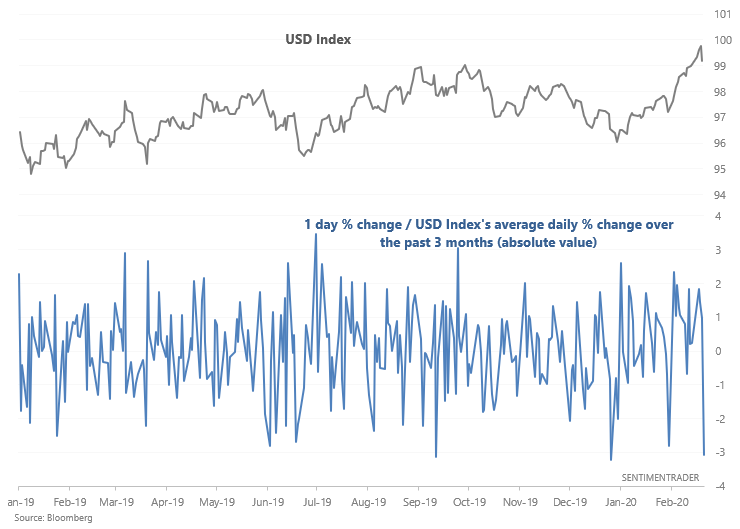

USD Index

It wasn't just tech's decline today that was shocking. The USD Index dropped sharply after a strong rally that pushed the USD to multi-year highs. If we look at the USD Index's 1 day % change vs. a 3 month average of daily % changes, this was a rather abrupt reversal in the USD's uptrend.

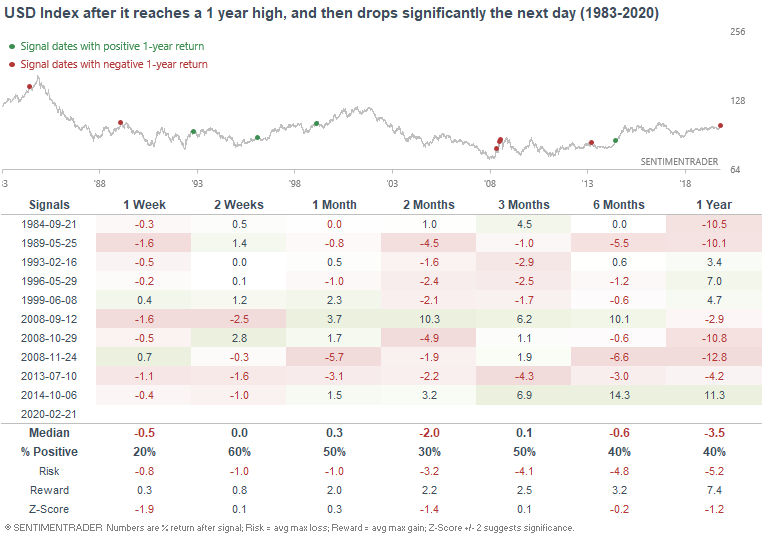
When the USD Index reached at least a 1 year high and then dropped like a stone (defined by the above chart < -3), the USD Index's returns over the next week were bearish. Most sudden reversals in the USD's uptrend led to more downside over the coming weeks.


Gold

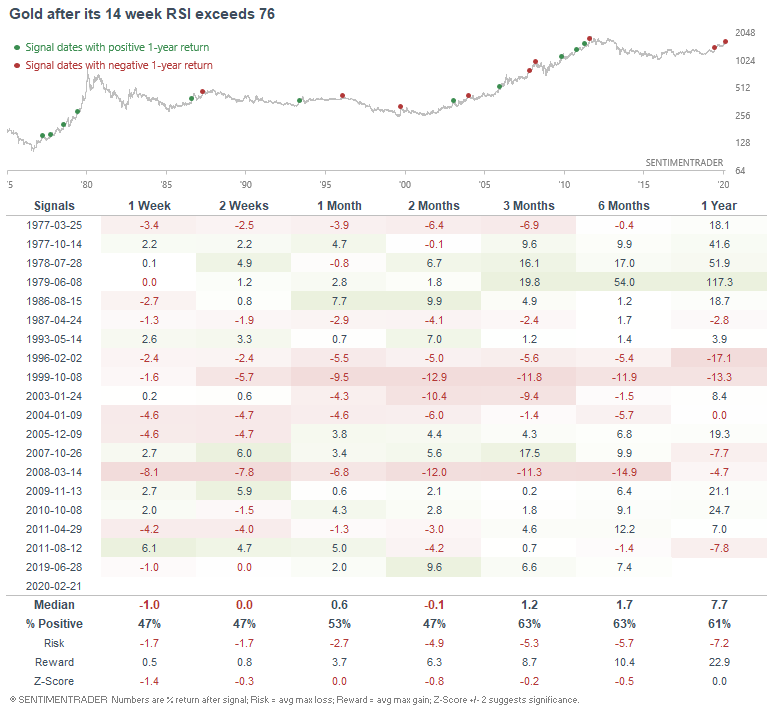
And finally, gold's surge has pushed its weekly RSI above 14.

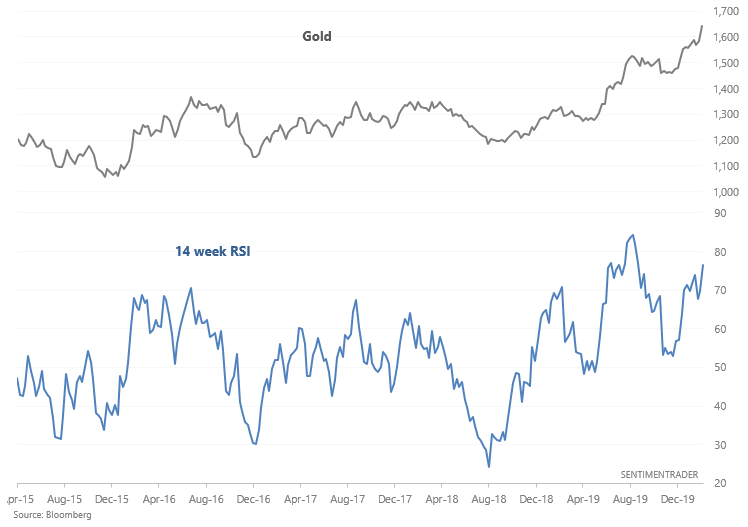
This led to worse than random returns for gold over the next week.

Sorry, you don't have access to this report

Upgrade your subscription plan to get access
Go to Dasboard
DATA &
TECHnologies
IndicatorEdge
‍
BackTestEdge
‍
Other Tools
‍
DataEdge API
RESEARCH
reports
Research Solution
‍
Reports Library
‍
actionable
Strategies
Trading Strategies
‍
Smart Stock Scanner
‍
FREE
RESOUrCES
Simple Backtest
Calculator
Simple Seasonality
Calculator
The Kelly Criterion
Calculator
Sentiment Geo Map
‍
Public Research Reports
‍
Free Webinar
COMPANY
‍
About
‍
Meet our Team
‍
In the News
‍
Testimonials
‍
Client Success Stories
Pricing
Bundle pricing
‍
Announcements
‍
FAQ
© 2024 Sundial Capital Research Inc. All rights reserved.
Setsail Marketing
TermsPrivacyAffiliate Program
Risk Disclosure: Futures and forex trading contains substantial risk and is not for every investor. An investor could potentially lose all or more than the initial investment. Risk capital is money that can be lost without jeopardizing ones’ financial security or life style. Only risk capital should be used for trading and only those with sufficient risk capital should consider trading. Past performance is not necessarily indicative of future results.

Hypothetical Performance Disclosure: Hypothetical performance results have many inherent limitations, some of which are described below. No representation is being made that any account will or is likely to achieve profits or losses similar to those shown; in fact, there are frequently sharp differences between hypothetical performance results and the actual results subsequently achieved by any particular trading program. One of the limitations of hypothetical performance results is that they are generally prepared with the benefit of hindsight. In addition, hypothetical trading does not involve financial risk, and no hypothetical trading record can completely account for the impact of financial risk of actual trading. for example, the ability to withstand losses or to adhere to a particular trading program in spite of trading losses are material points which can also adversely affect actual trading results. There are numerous other factors related to the markets in general or to the implementation of any specific trading program which cannot be fully accounted for in the preparation of hypothetical performance results and all which can adversely affect trading results.

Testimonial Disclosure: Testimonials appearing on this website may not be representative of other clients or customers and is not a guarantee of future performance or success.