
What I'm looking at: breadth thrusts, financial conditions, USD, copper
Here's what I'm looking at:
Breadth thrusts
As Jason mentioned in his Daily Portfolio Update:
"The good was undeniably the momentum registering in so many indexes and individual stocks. That is clearly not showing any signs of abating yet. The bad is the extreme nature of so many of the core indicators we follow, which have had a good record at preceding poor returns in the shorter-term."
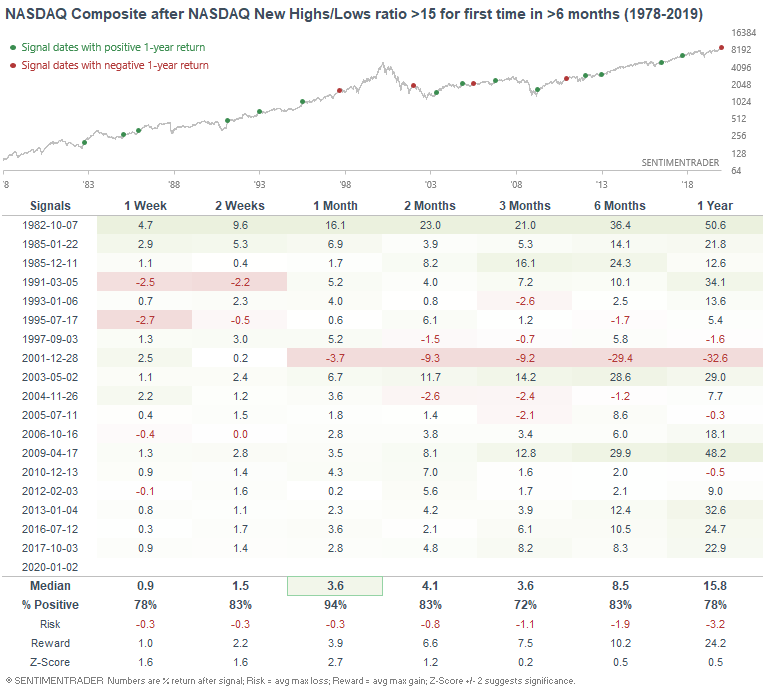
With the U.S. stock market trending higher, various indices continue to see breadth thrusts. For example, the NASDAQ Composite's 52 week New High / New Low ratio has spiked to the highest level since early-2018:

Such breadth thrusts in the past usually led to more gains for the NASDAQ Over the next month:
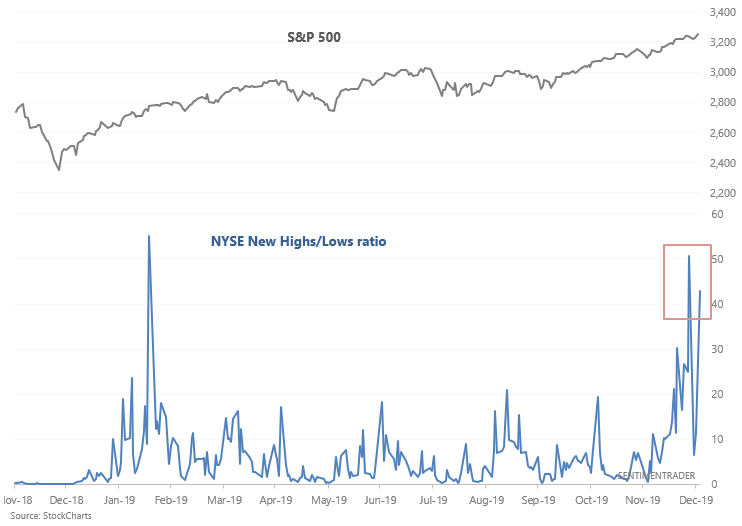
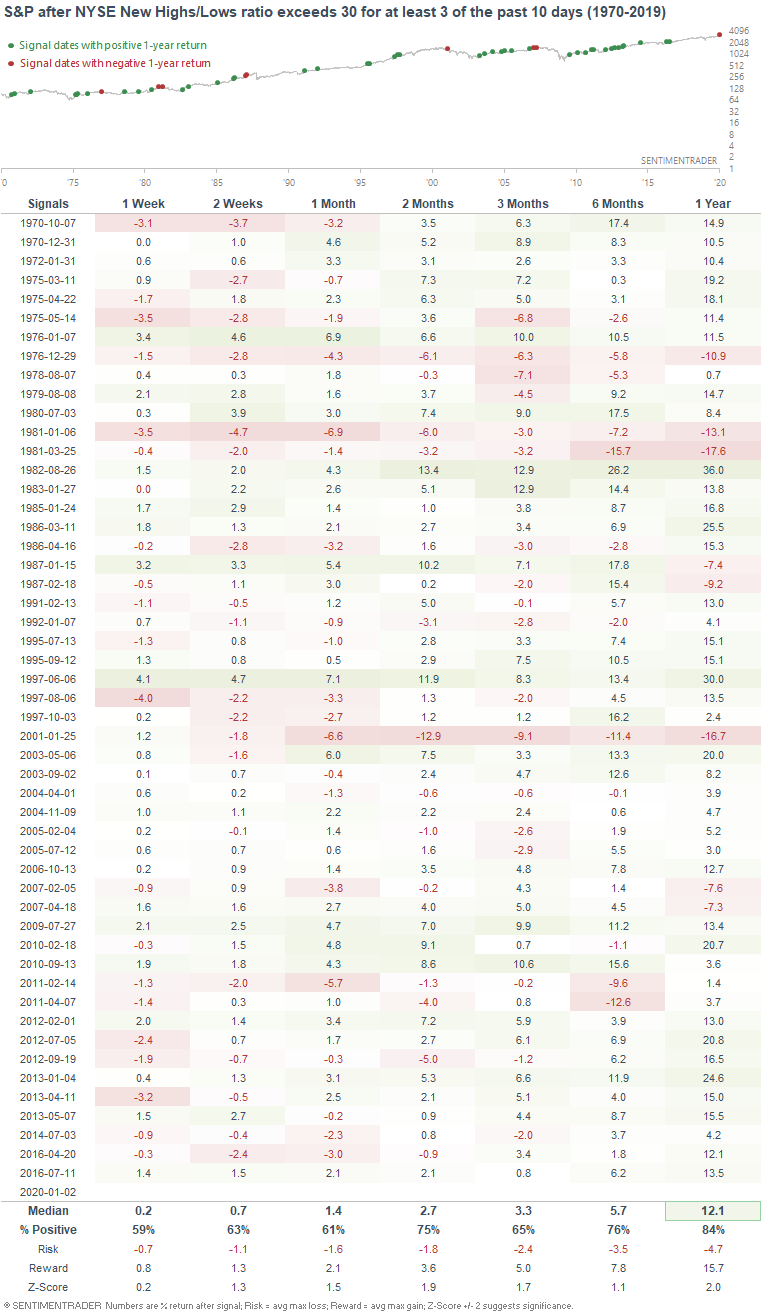
Similarly, the S&P 500 continues to see breadth thrusts. 3 of the past 10 days (2 weeks) have seen the New Highs/New Lows ratio exceed 30:
When this happened in the past, the S&P's returns over the next 2 months were more bullish than random, but the stronger edge occurred with the 1 year forward returns:
Financial Conditions
The Goldman Sachs U.S. Financial Conditions Index continues to trend downwards, demonstrating loosening financial conditions. In Goldman's own words, their Financial Conditions Index "is defined as a weighted average of riskless interest rates, the exchange rate, equity valuations, and credit spreads, with weights that correspond to the direct impact of each variable on GDP".
As a result, the Financial Conditions Index's 270 day rate-of-change (slightly under 13 months) has fallen to -1.3%.
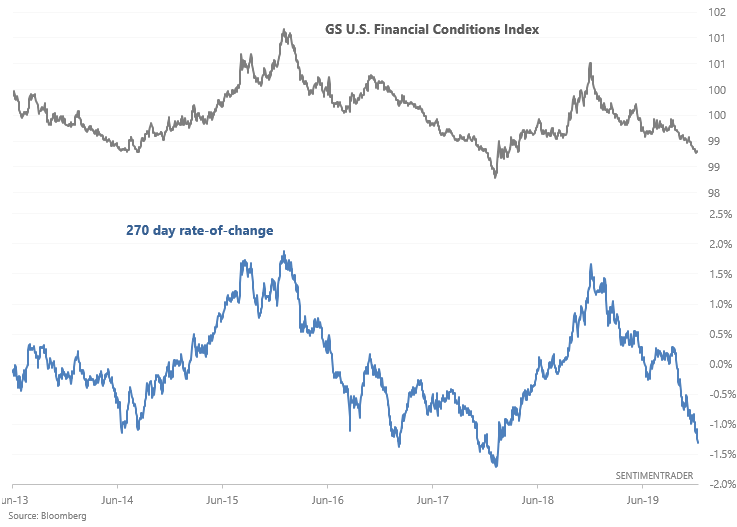
When financial conditions eased this much over a 270 day period, the S&P's returns over the next year were usually bullish, even if there were corrections along the way. This typically happened 1-1.5 years after a major period of market/economic turbulence:
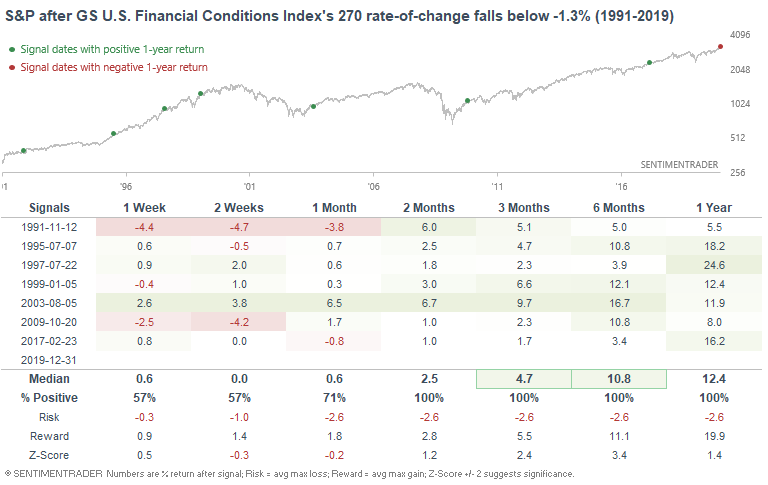
- 1991: occurred after a recession
- 1995: occurred after the 1994 bond market crisis
- 1997: occurred after an economic slowdown in 1995
- 1999: occurred after a stock market crash which many at the time thought was the end of the 1990s bull market
- 2003: occurred after a massive 2000-2002 bear market
- 2009: occurred after a massive 2007-2009 bear market
- 2017: occurred after a massive global economy and markets scare from 2015-2016
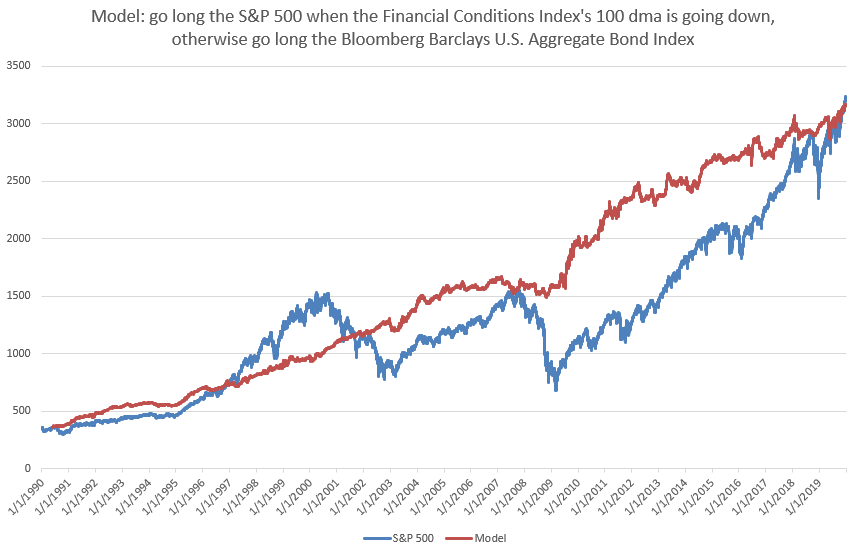
From a trend following perspective, it's better to be bullish on stocks when financial conditions are easing (Financial Conditions Index's 100 dma is going down) than to be bullish on stocks when financial conditions are tightening (Financial Conditions Index's 100 dma is going up).
U.S. Dollar
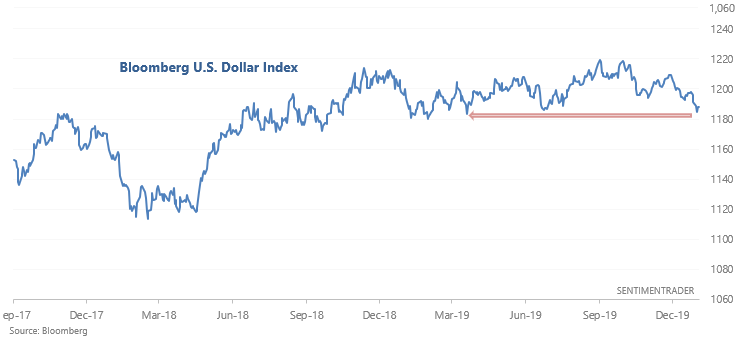
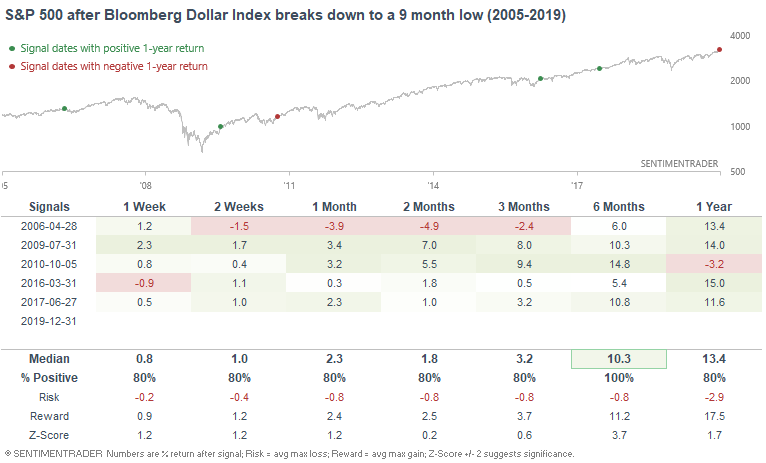
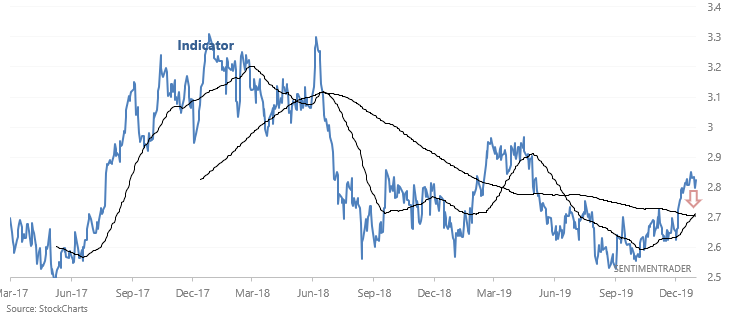
2019 saw extremely low volatility in forex markets, and perhaps that is coming to an end. The U.S. Dollar is starting to trend downwards, and the Bloomberg U.S. Dollar Index recently broke down to a 9 month low:
Such breakdowns in the past were usually followed by new lows over the next month for the Bloomberg Dollar Index:
*The sample size is a little small
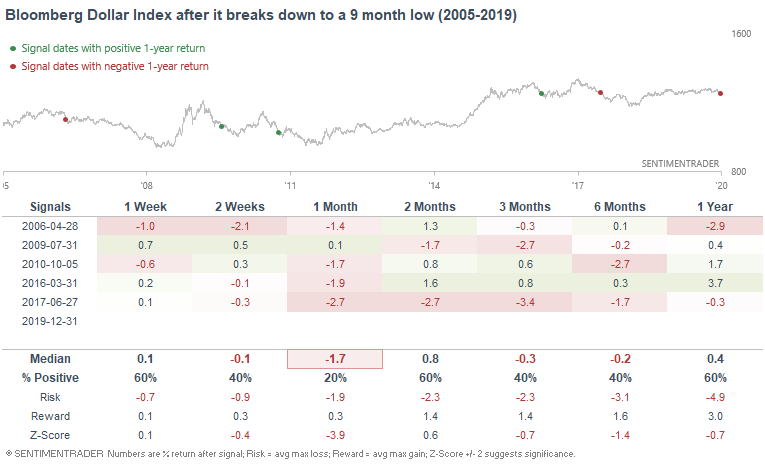
For what it's worth, the S&P typically rallied over the next 6 months:
Copper
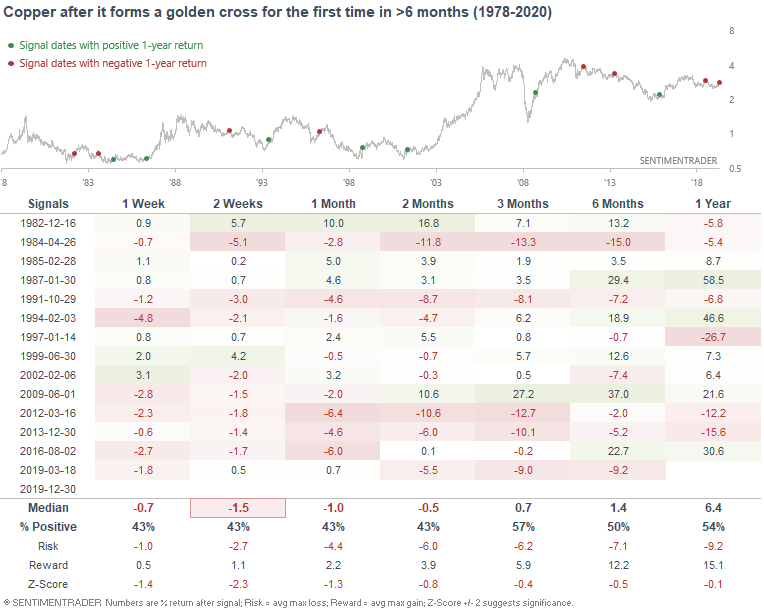
And lastly, copper recently formed a golden cross after a long downtrend:
The first attempt at a long term turnaround didn't always work and led to weak returns for copper over the next few weeks. This has been particularly effective since the GFC, probably because commodities have gone many years without a major bull market:
My trading portfolio
My trading portfolio is allocated 50% in the Macro Index Model and 50% in the Simple Trading Model With Fundamentals. At the moment I have instituted a discretionary override and gone 100% long bonds (instead of long stocks) due to the extreme nature of many of our core indicators, even though some of these core indicators aren't in the models.
Year-to-date 2020:
- My trading account is up 0.17%
- Currently 100% in bonds