What I'm looking at - breadth & sentiment, yield curve, volatility, Consumer Comfort
Here's what I'm looking at:
Breadth & sentiment
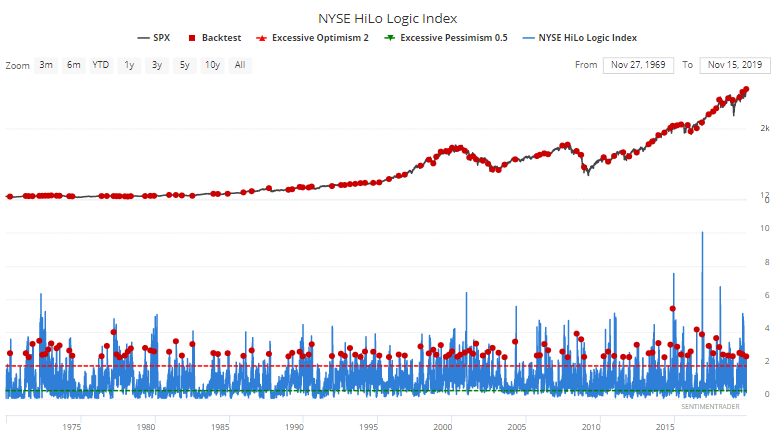
Breadth has been rather weak recently, with relatively few stocks making highs along with the broad index. This has caused the NYSE HiLo Logic Index to exceed 2.5:
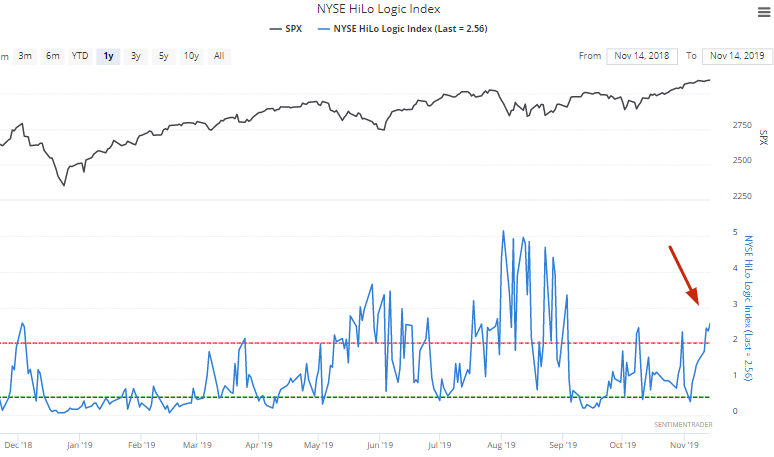
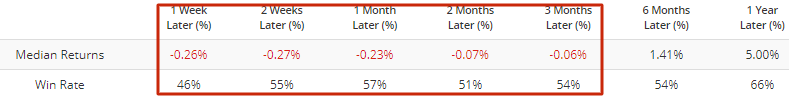
Such high readings represent a relatively split market, which hasn't been great for stocks in the past. The following table demonstrates every case in which this Index exceeded 2.5, and what the S&P 500 did next:
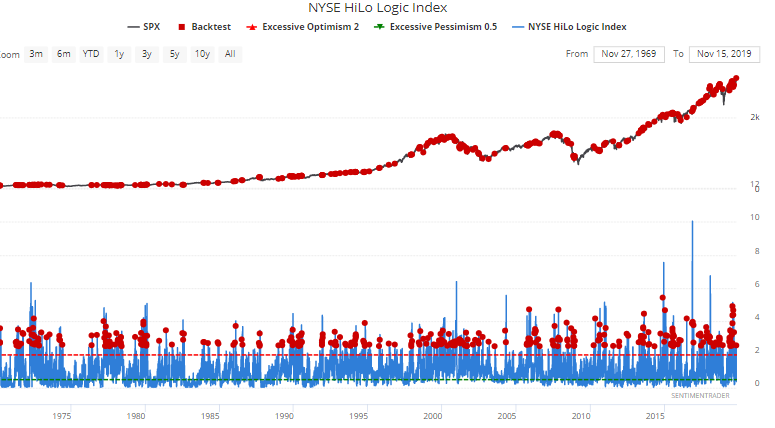
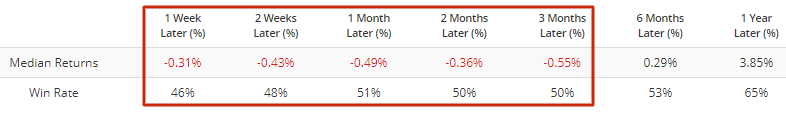
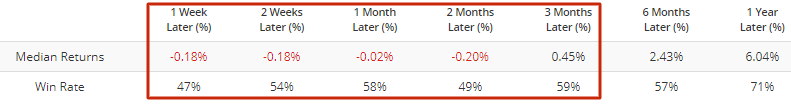
As you can see, the S&P's returns are consistently worse than average over the next 3 months. However, many of these cases are overlaps. So let's look at unique cases over a 50 day period:
Even in an uptrend (i.e. when the S&P is above its 200 dma), the S&P's returns are still worse than average:
Meanwhile, the Equity Put/Call ratio has dropped to lowest level this year:
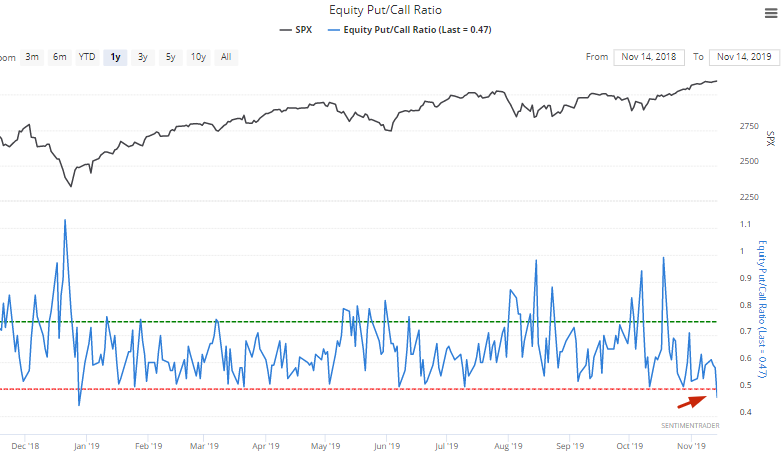
I prefer our Equity Put/Call Ratio (De-trended), which removes the trend in this ratio (and hence makes analyzing this ratio more useful over long periods of time).
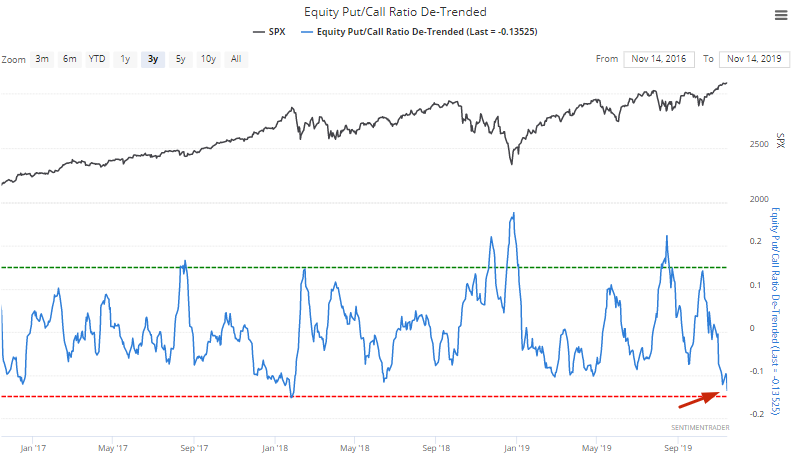
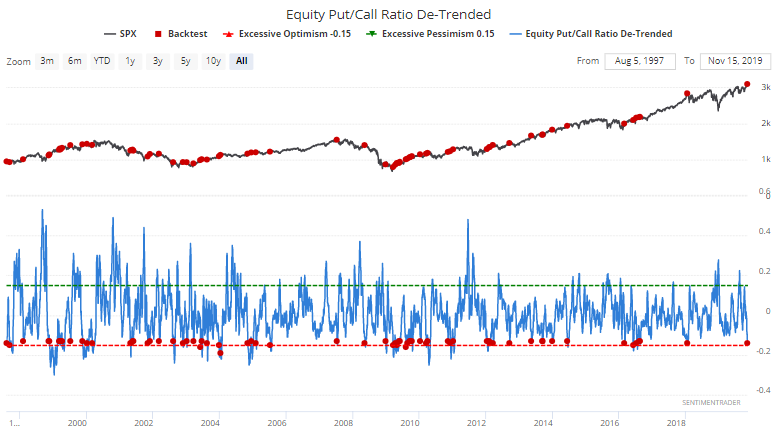
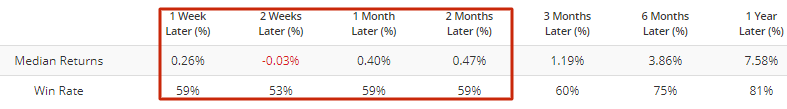
This ratio has fallen to the lowest level since January 2018, just before stocks hit the skids and vol spiked. Historically, cases in which this ratio fell below -0.13 signaled worse-than-average returns for stocks over the next few weeks and months:
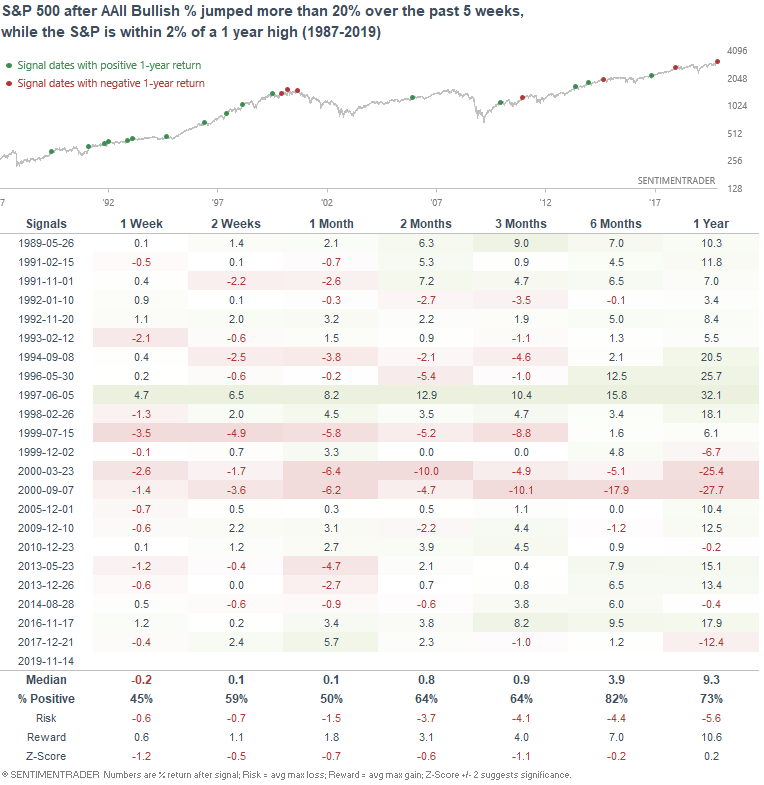
In addition, AAII Bullish % has jumped more than 20% over the past 5 weeks:
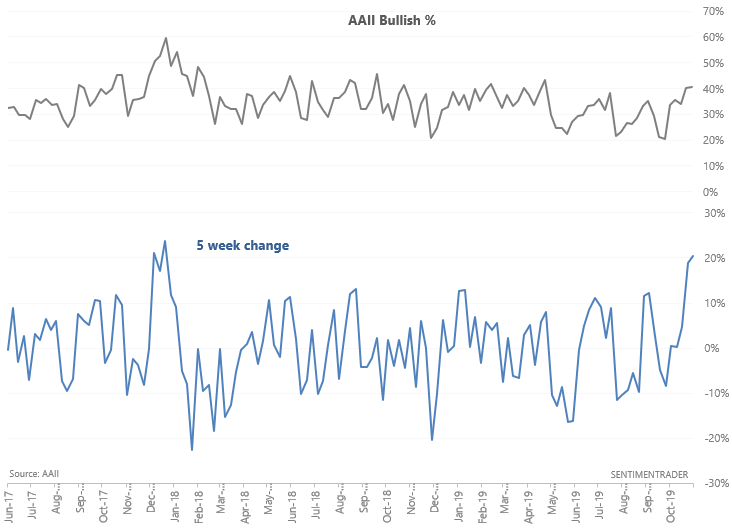
Such jumps in sentiment while the S&P is at or close to a 1 year high saw the S&P experience worse-than-average returns over the next few weeks and months:
Yield curve
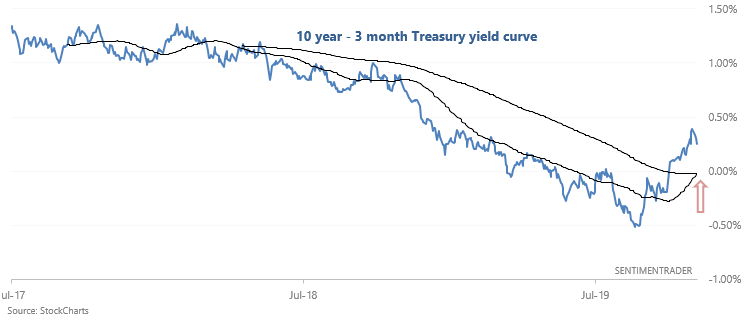
Continuing with my yield curve steepening theme, the 10 year - 3 month Treasury yield's 50 dma has crossed above its 200 dma for the first time since April 2018. In other words, the yield curve is steepening after a long period of flattening:
As I've mentioned in the past, steepening yield curves aren't usually great for stocks, since the yield curve tends to steepen in a recession. The following table demonstrates what the S&P did next after the yield curve formed a golden cross for the first time in more than 1 year:
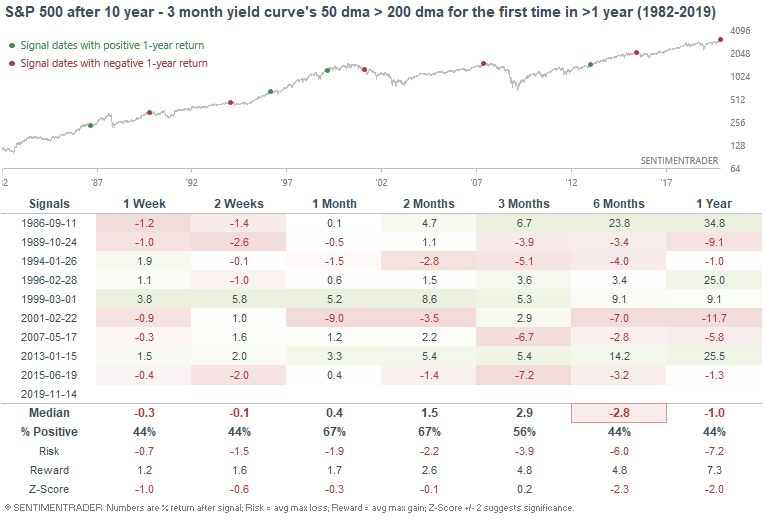
Returns over the next year are consistently worse than average, due to the number of signals during bear markets (e.g. 2007, 2001). However, I continue to emphasize that the yield curve is just one of multiple macro factors to consider. Macro almost always fails when you put excessive emphasis on one factor since the nature of the U.S. economy changes over time.
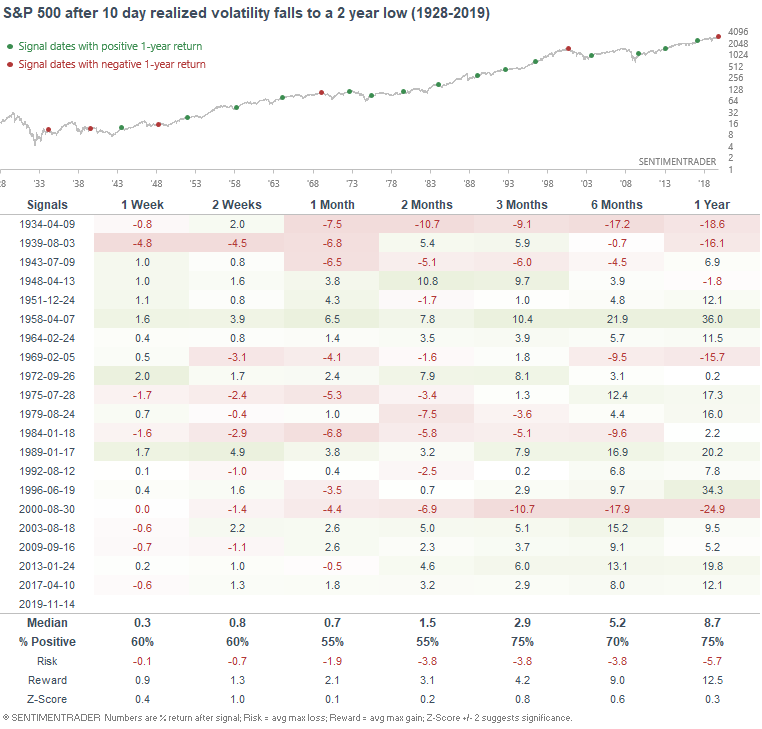
Volatility
As Luke Kawa noted, the S&P 500's 10 day realized volatility has fallen to a 10 day low:
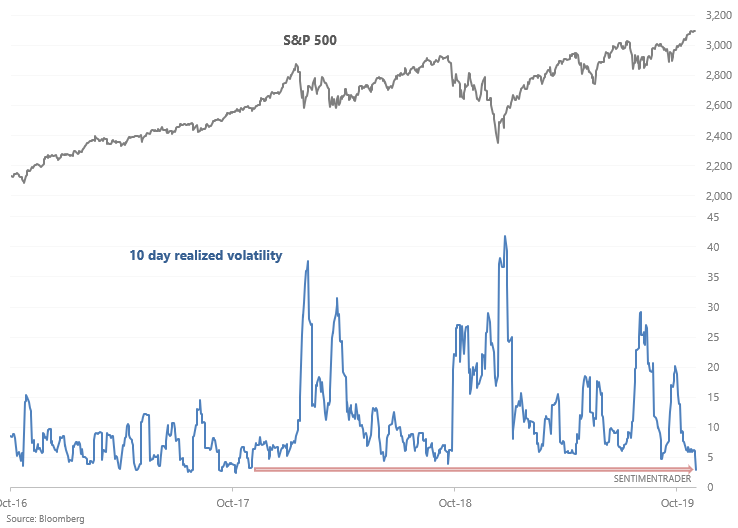
When it did so in the past, the S&P's returns over the next 2 months weren't necessarily bearish, although there were some decent losses in there:
Consumer Comfort
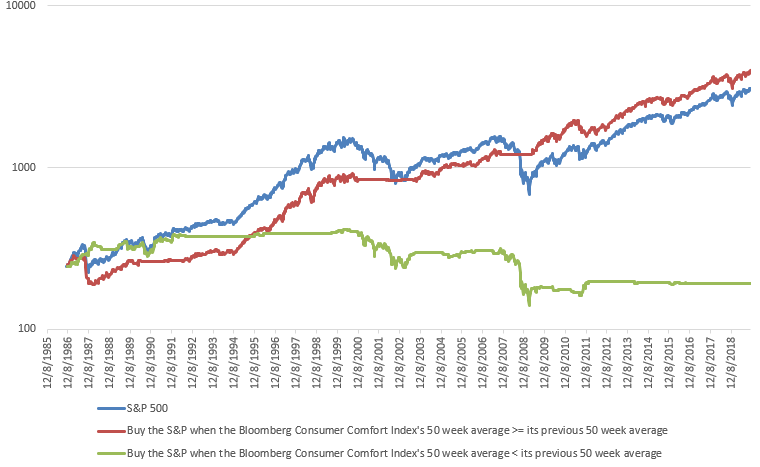
As Zerohedge noted, the Bloomberg Consumer Comfort Index has fallen to the lowest level since February.
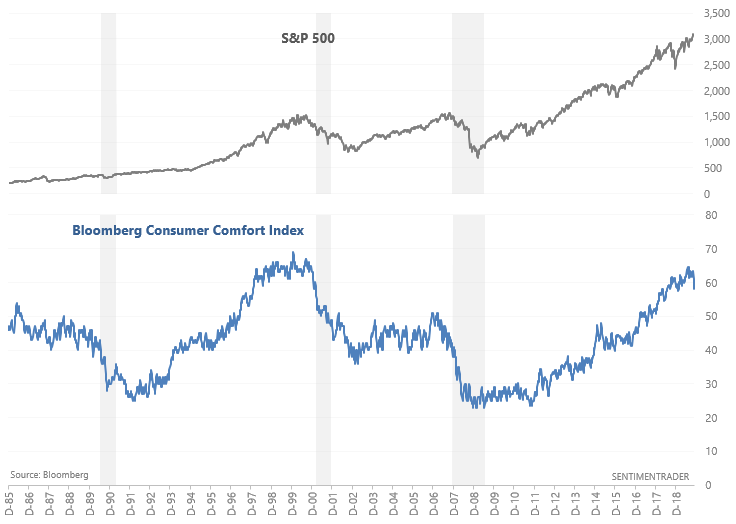
The decline over the past month is quite significant, and has caused the index's 50 week average to fall for the first time since 2016. Since this index does not have a defined peak ("too high" can become even higher), I find it more useful when used as a trend following indicator. I.e. it's better to buy stocks when this index is trending up than when this index is trending down.
The following chart (red line) demonstrates what happens if you buy and hold the S&P 500 when the Bloomberg Consumer Comfort Index's 50 week average is >= its previous 50 week average. (Otherwise, hold cash.)