What I'm looking at - breadth (from multiple angles), VIX spike, volume spike
Here’s what I’m looking at:
Breadth
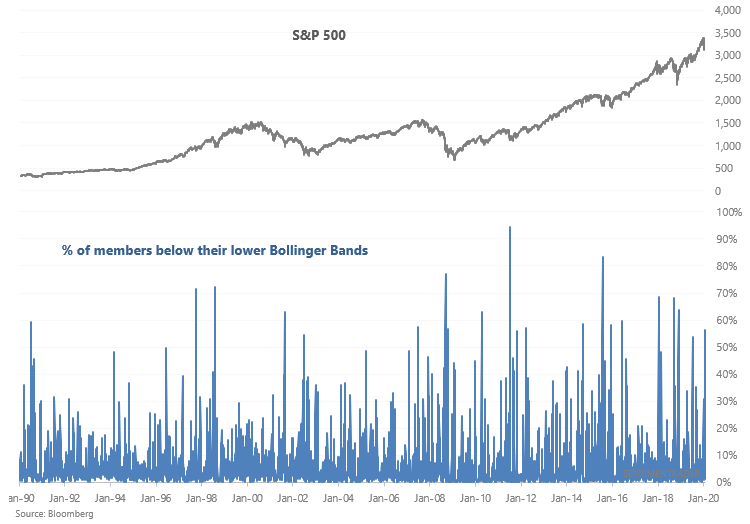
As the stock market falls, more than 56% of the S&P 500's members are now below their lower Bollinger Bands:
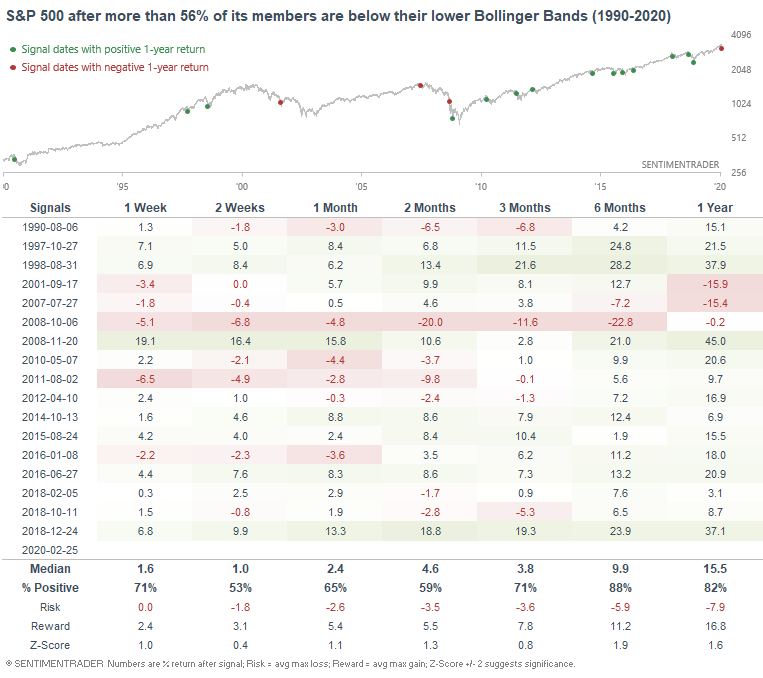
It's easy to assume that this is short term bullish for the S&P - after all, that is the whole point of Bollinger Bands. But history suggests that on a 1-2 week forward basis, the S&P's forward returns weren't extremely more bullish than random. But on a longer term basis, 6 month forward returns were good:
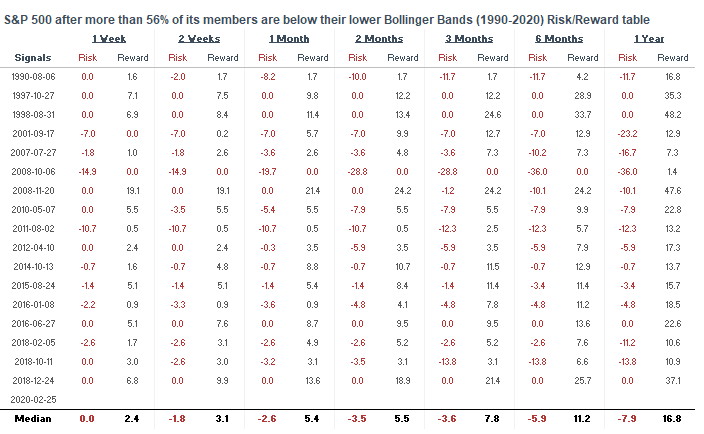
Here's the risk:reward table:
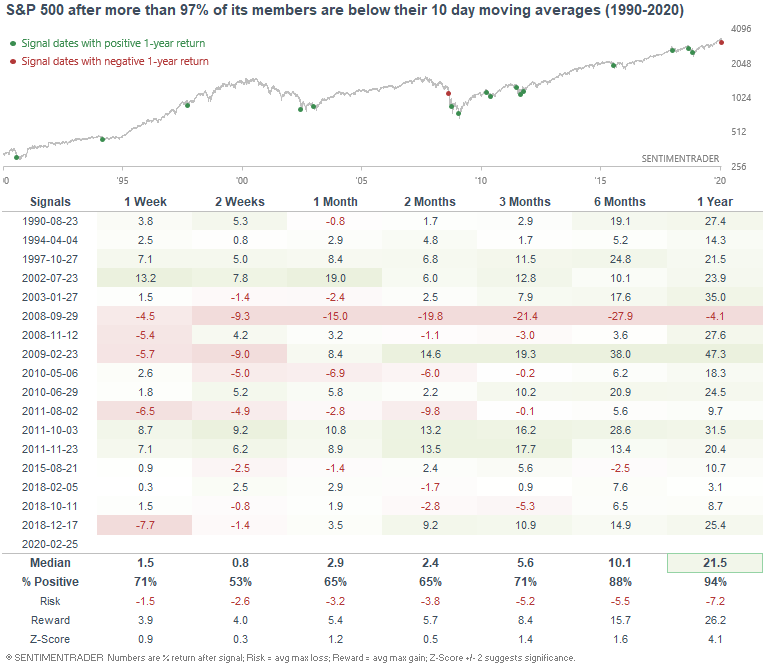
In the meantime, the sharp selloff has pushed more than 97% of the S&P 500's members below their 10 day moving average:
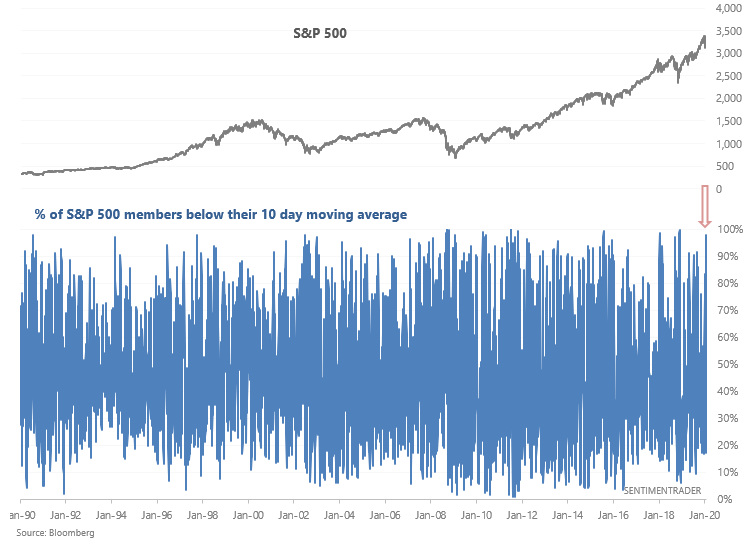
When so many stocks were in a short term downtrend, the stock market's decline wasn't necessarily over in the short term. But on a longer term basis (6-12 months), the S&P's forward returns were good:
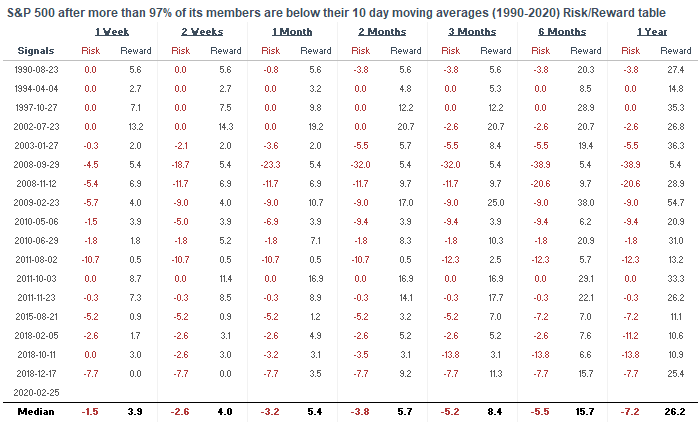
Here's the risk:reward table:
And finally, 90% of NYSE issues fell on Monday and Tuesday:
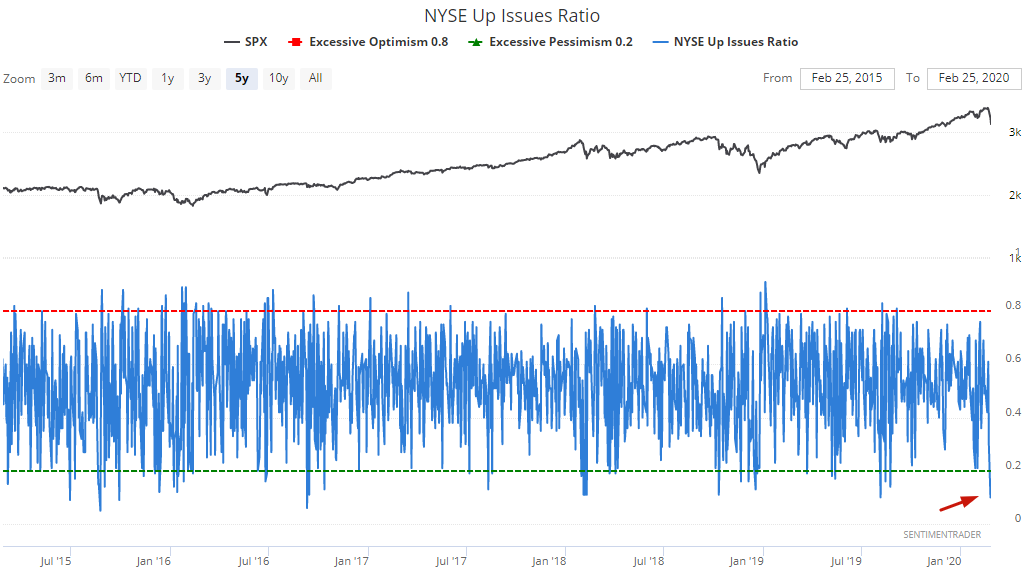
There have only been a few other historical cases with 2 days of such widespread selling. Historically, the S&P rallied over the next 2-12 months:
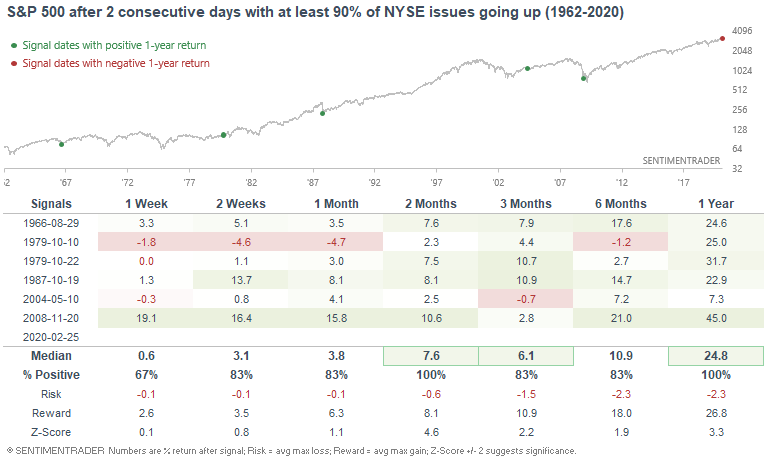
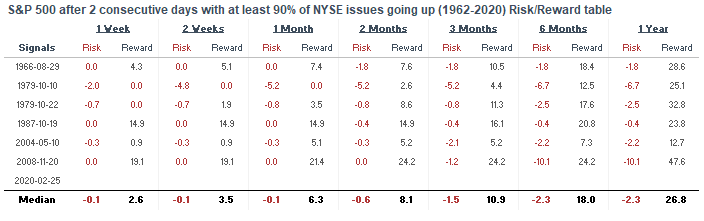
Here's the risk:reward table.
VIX RSI
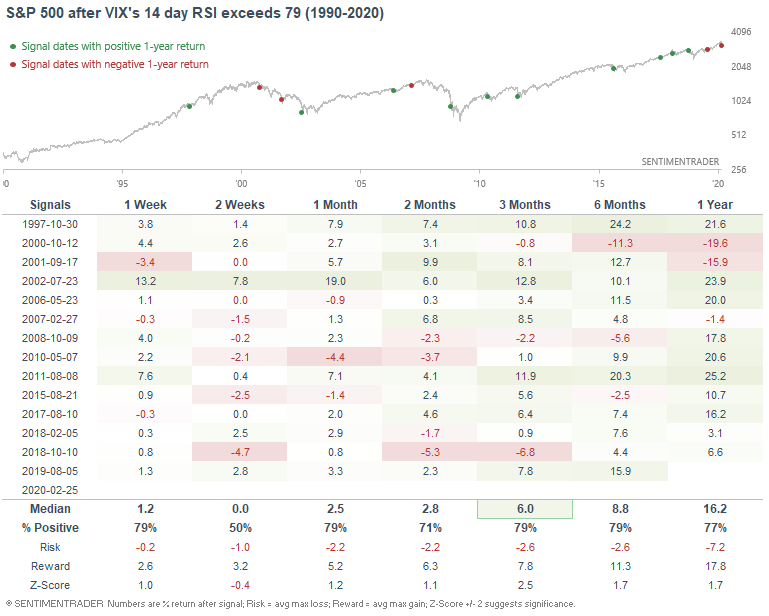
The stock market's selloff on Tuesday pushed VIX even higher. VIX's RSI is now at 79....
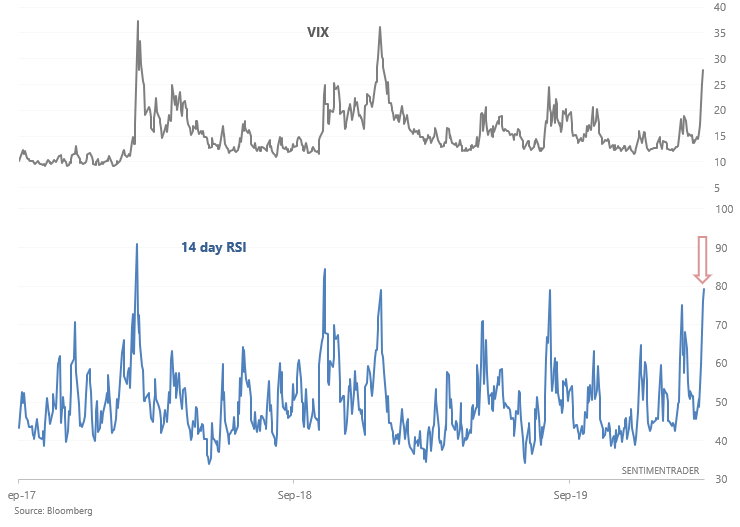
...a level which in the past, meant that VIX had very little room left to run:
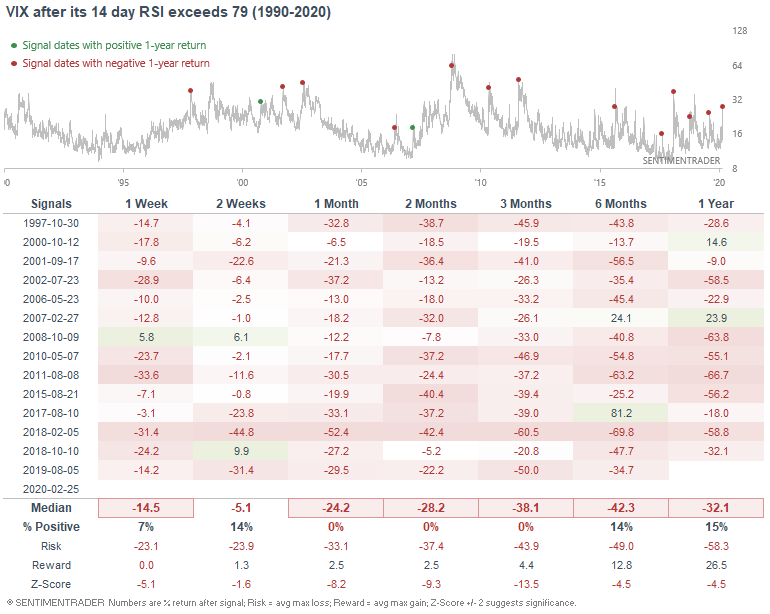
The majority of the cases saw VIX peak immediately. Others saw a marginal higher high.
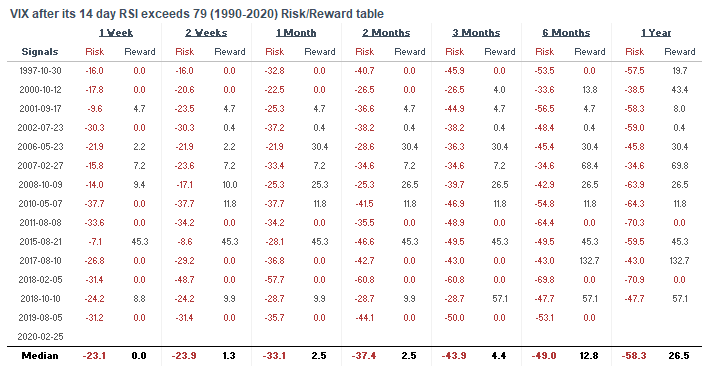
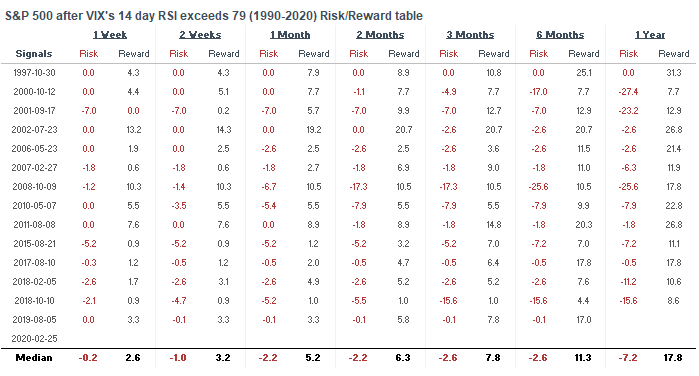
While this wasn't good for VIX from a risk:reward perspective, it wasn't extremely bullish for the S&P. The S&P's forward returns were more bullish than random, but this didn't always signal an all-clear sign. When the S&P falls, bounces, and makes a lower low, VIX's 2nd spike is often lower than the first.
Here's the S&P's risk:reward table:
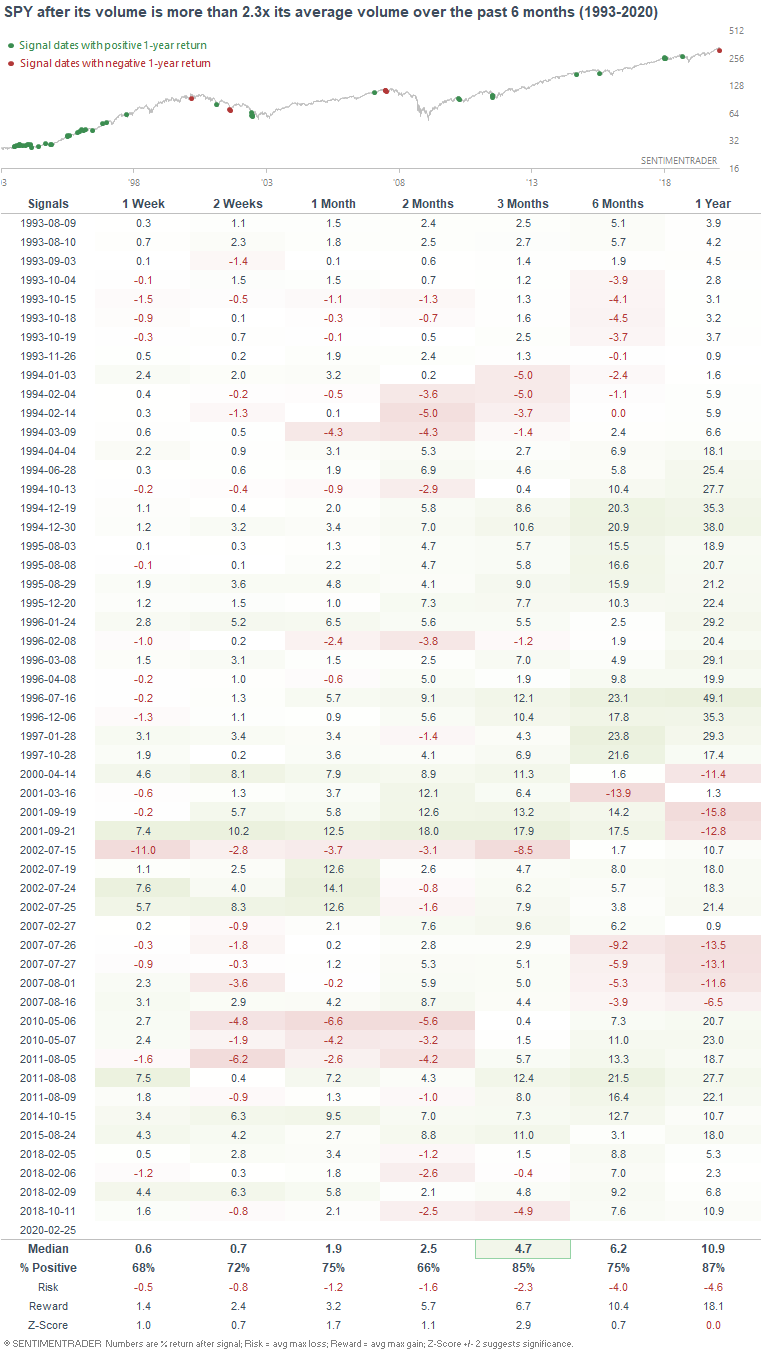
Volume spike
And lastly, the selloff has seen a surge in SPY's volume. SPY's volume on Tuesday was more than 2.3x the average of the past 6 months:
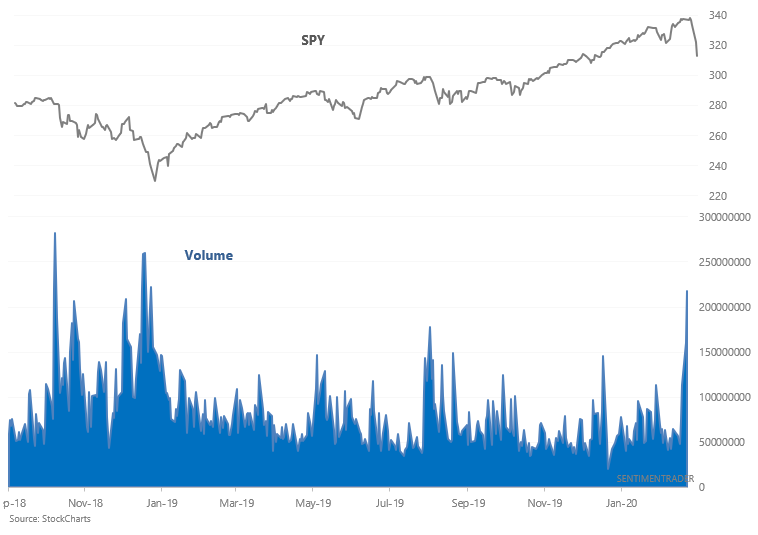
The S&P's return over the next 3 months was mostly bullish since volume spikes usually accompany stock market selloffs:
How I allocate my assets
Instead of sharing how I manage my own trading portfolio, here's how I allocate all my assets for the sake of full transparency. Some of these percentages are approximate, particularly for private assets (since private assets don't have a value on a day to day basis).
- 40% emerging market real estate.
- 20% trading portfolio. My trading portfolio is allocated 50% in the Macro Index Model and 50% in the Simple Trading Model With Fundamentals. Right now I am 25% long stocks and 75% long bonds (went long yesterday)
- 20% is a buy and hold position for the S&P 500 which I won't sell unless I see better opportunities in private markets. This IS NOT a trading position - here I care about the earnings yield. I expect this portion of the portfolio to see weak returns over the next 5-10 years given that valuations are high (and hence earnings yields are low).
- 20% in short term Treasury bond ETFs. This is a temporary placeholder. When opportunities arise I will sell these cash-like instruments to fund private market investments.
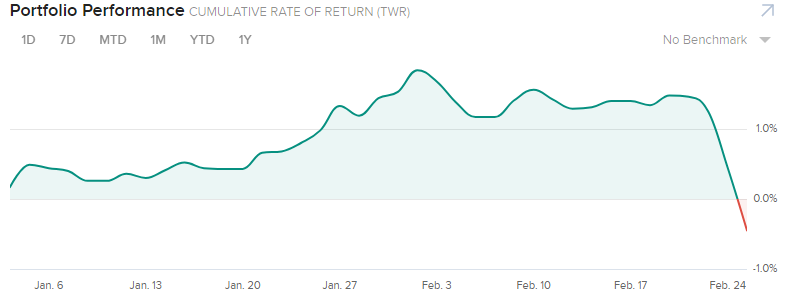
YTD 2020 performance for my public markets portfolio (trading portfolio, buy and hold position, temporary placeholder):
- -0.45%