Data &
Technology
Research
Reports
Report Solutions
Reports Library
Actionable
Strategies
Free
Resources
Simple Backtest Calculator
Simple Seasonality Calculator
The Kelly Criterion Calculator
Sentiment Geo Map
Public Research Reports
Free Webinar
Pricing
Company
About
Meet Our Team
In the News
Testimonials
Client Success Stories
Contact
Log inLoginSign up
< BACK TO ALL REPORTS

What I'm looking at - Australia, developed markets, corporate bonds

Troy Bombardia
2020-03-20
The past 5 weeks have been absolutely brutal for global markets. In many aspects this can only be compared to the worst of the 2008 crash.

Here's what I'm looking at:


Australia

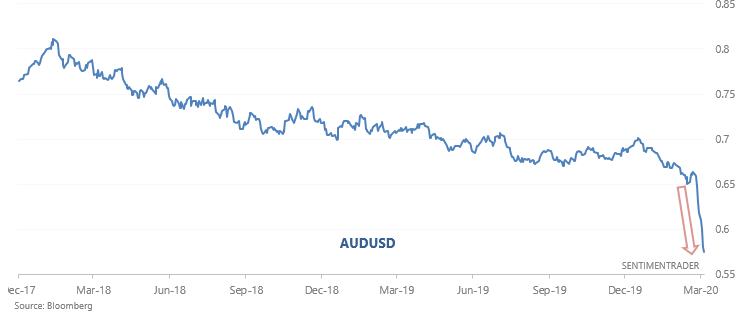
I've been thinking about diversifying my assets across different hard currencies after talking to a friend, and I started looking at Australia. The past few years have been rough for the Australian Dollar, to say the least, and the past few weeks have been brutal.

Here's AUDUSD:

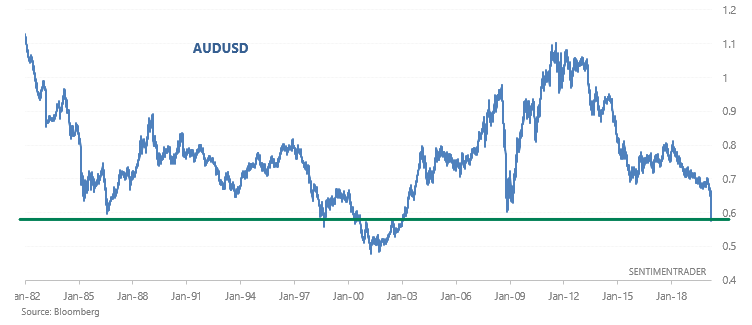
Here's the same chart, on a longer term basis:

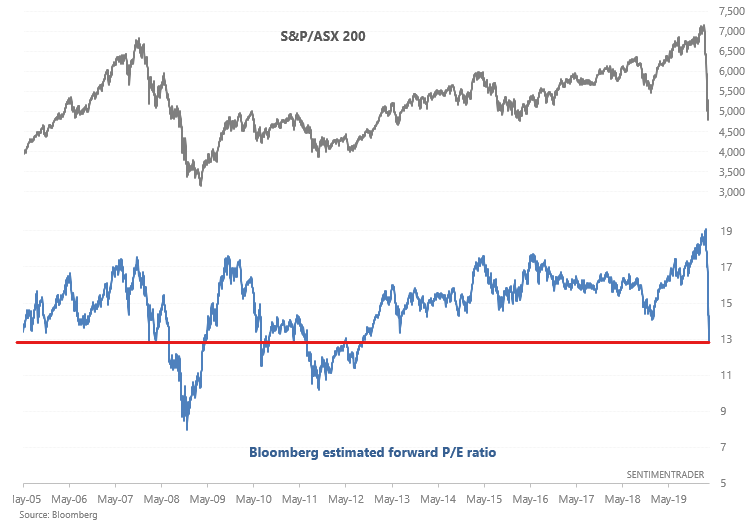
While the S&P/ASX 200 index has dropped -34.1% during this coronavirus-driven crash, the AUDUSD's decline has caused EWA (Australian ETF) to fall -43.2% from top to bottom.

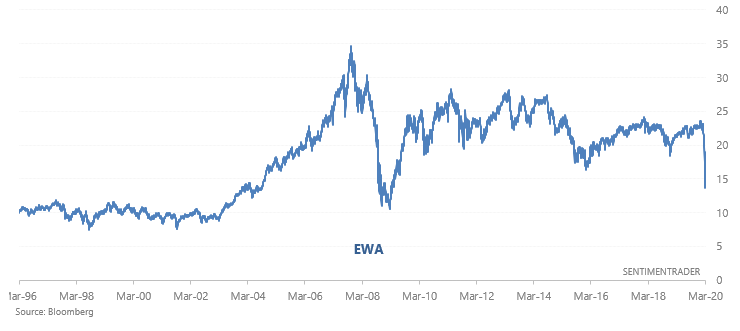
From a longer term perspective, this means that Australian equities valuations is MUCH more attractive. Earning yields - the reciprocal of valuations - matter on a long term basis (i.e. 10-20 years).


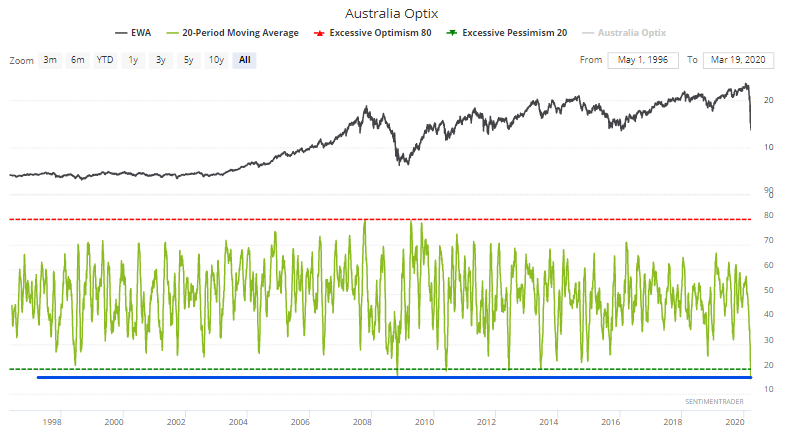
From a trading perspective, Australia Optix's 20 dma is the lowest its ever been - even lower than in 2008. Back then Australian equities chopped a bit lower, but the key point is that the worst of the selling was over.

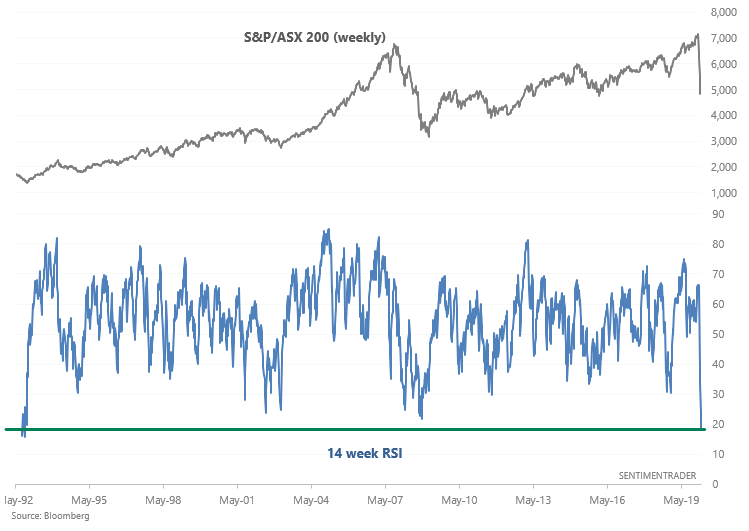
Meanwhile, the S&P/ASX 200's weekly RSI is among the lowest ever. Once again, lower than what we saw in 2008:

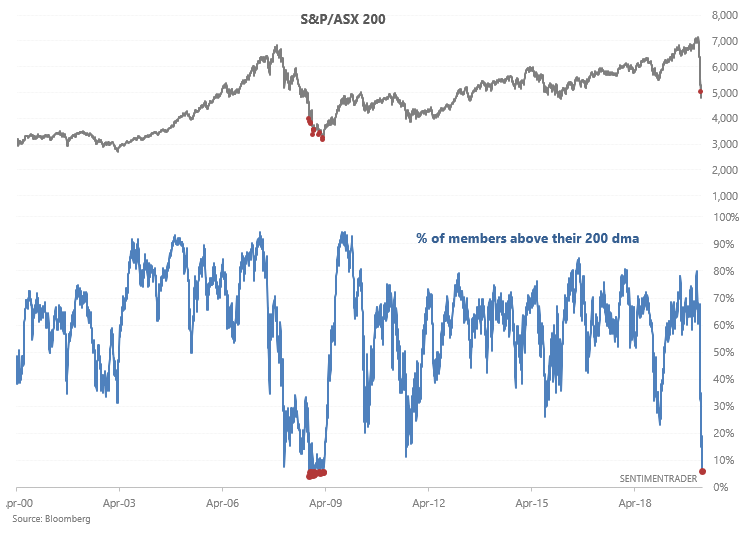
And the % of S&P/ASX members above their 200 dma can only be compared to that of 2008. Once again, back then the worst of the selloff for Australian equities was over. The S&P/ASX 200 surged over the next year, but not before making new lows.


Developed markets

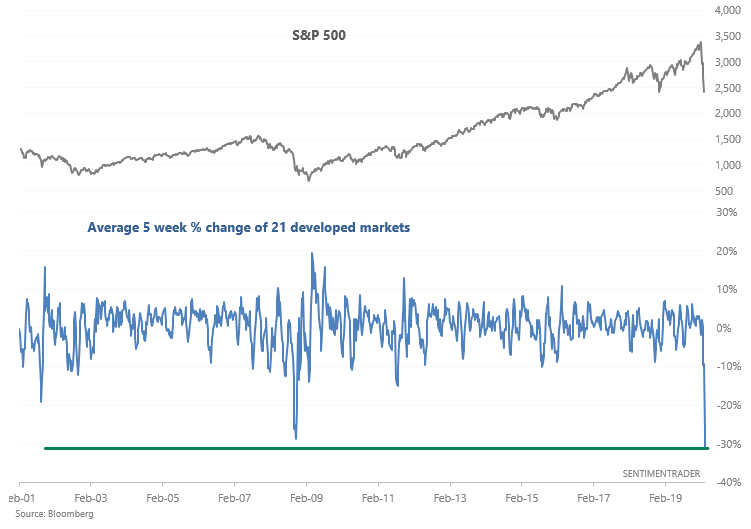
Internet usage has been up more than 20% of the past few weeks, no doubt driven by worldwide panic over coronavirus. Markets-websites have also seen a surge in traffic (everyone is glued to their screen when markets crash). There haven't been a lot of safe places for investors to hide. To get a sense of how widespread and shocking the selloff was, we can look at the average 5 week % change of 21 developed markets in the MSCI World Index (excluding Denmark and Ireland):

The average stock index has fallen -31.3% over the past 5 weeks, worse than in 2008:

And the median stock index has fallen -31.8%, also worse than in 2008.

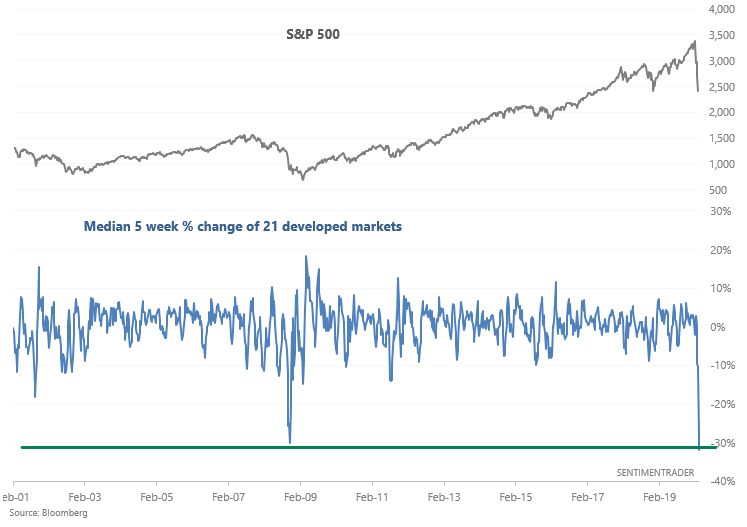
By then the worst of the selling was over. Most crashes are followed by a retest or marginal new lows. V-shaped rallies are rare, but not impossible. Focus on long term risk:reward if you're going to buy now.
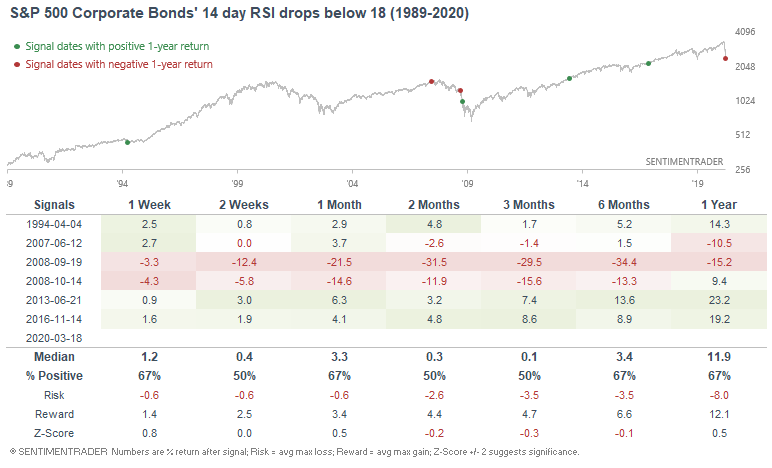

Bonds

While bonds surged in the initial phases of the recent stock market crash, bonds are falling now. Corporate bonds' 14 day RSI is at its lowest reading ever.

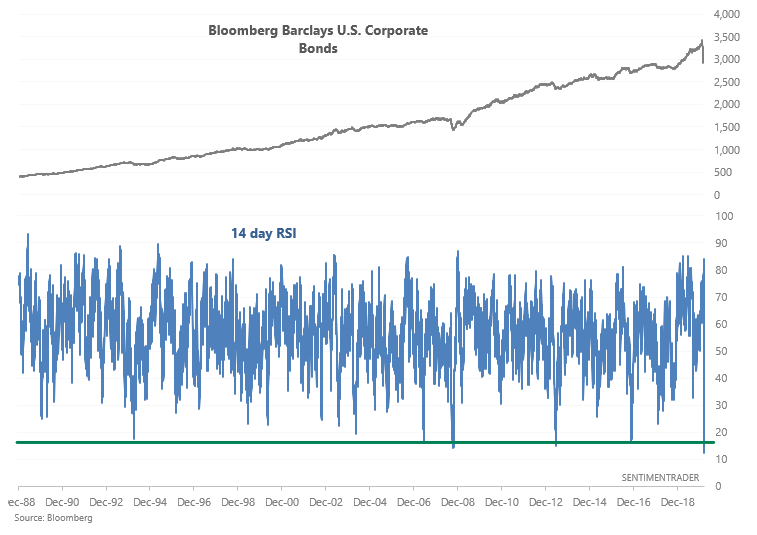
This happened during the 1994 Great Bond Massacre, 2007-2008 global financial crisis, June 2013 taper tantrum, 2016 post-election risk-on environment, and now. Bearish historical cases in the following table were in September and October 2008. But I don't think it's very comparable, given than the Bloomberg Barclays U.S. Corporate Bond's RSI has never been this low before.

Sorry, you don't have access to this report

Upgrade your subscription plan to get access
Go to Dasboard
DATA &
TECHnologies
IndicatorEdge
‍
BackTestEdge
‍
Other Tools
‍
DataEdge API
RESEARCH
reports
Research Solution
‍
Reports Library
‍
actionable
Strategies
Trading Strategies
‍
Smart Stock Scanner
‍
FREE
RESOUrCES
Simple Backtest
Calculator
Simple Seasonality
Calculator
The Kelly Criterion
Calculator
Sentiment Geo Map
‍
Public Research Reports
‍
Free Webinar
COMPANY
‍
About
‍
Meet our Team
‍
In the News
‍
Testimonials
‍
Client Success Stories
Pricing
Bundle pricing
‍
Announcements
‍
FAQ
© 2024 Sundial Capital Research Inc. All rights reserved.
Setsail Marketing
TermsPrivacyAffiliate Program
Risk Disclosure: Futures and forex trading contains substantial risk and is not for every investor. An investor could potentially lose all or more than the initial investment. Risk capital is money that can be lost without jeopardizing ones’ financial security or life style. Only risk capital should be used for trading and only those with sufficient risk capital should consider trading. Past performance is not necessarily indicative of future results.

Hypothetical Performance Disclosure: Hypothetical performance results have many inherent limitations, some of which are described below. No representation is being made that any account will or is likely to achieve profits or losses similar to those shown; in fact, there are frequently sharp differences between hypothetical performance results and the actual results subsequently achieved by any particular trading program. One of the limitations of hypothetical performance results is that they are generally prepared with the benefit of hindsight. In addition, hypothetical trading does not involve financial risk, and no hypothetical trading record can completely account for the impact of financial risk of actual trading. for example, the ability to withstand losses or to adhere to a particular trading program in spite of trading losses are material points which can also adversely affect actual trading results. There are numerous other factors related to the markets in general or to the implementation of any specific trading program which cannot be fully accounted for in the preparation of hypothetical performance results and all which can adversely affect trading results.

Testimonial Disclosure: Testimonials appearing on this website may not be representative of other clients or customers and is not a guarantee of future performance or success.