What I'm doing - applying the Stock/Bond ratio to models
Today's post is different. I don't have any particularly interesting stats, so I'd like to show you what I'm working on. This work is not complete, but here's a quick glance.
As you know, I like trading models because they give us clear buy and sell signals. A popular long term model is the following:
- Buy and hold the S&P 500 if the S&P 500 is >= its 12 month moving average, OR the Unemployment Rate is <= its 12 month moving average
- Otherwise, SELL.
You can do 1 of 6 things when you SELL:
- Model: Shift into 100% cash
- Model (long/short): Short the S&P 500 Total Return Index
- Model (Multi-Asset Aggregate Bonds): Buy and hold the Bloomberg Barclays US Aggregate Bond Total Return Index
- Model (Multi-Asset Corporate Bonds): Buy and hold the Bloomberg Barclays US Corporate Bond Total Return Index
- Model (Multi-Asset Treasury Bonds): Buy and hold the Bloomberg Barclays US Treasury Bond Total Return Index
- Model (Gold): Buy gold
This model outperforms buy and hold primarily by avoiding the big bear markets. However, it does not help us avoid corrections. Could we use various indicators on SentimenTrader to help us avoid some corrections? I don't want to use too many indicators, because doing so would essentially be curve fitting. Are there indicators that have a large sample size which can be used to boost this model's returns? After some preliminary screening, I'm testing the following indicators:
- Stock/Bond Ratio
- SPY Liquidity Premium,
- NYSE HiLo Logic Index
- Hindenburg Omen
- Medium-Term Risk Levels
- Risk Appetite Index
- Intermediate Term Optimism Index (Optix)
- Smart Money / Dumb Money Confidence Spread
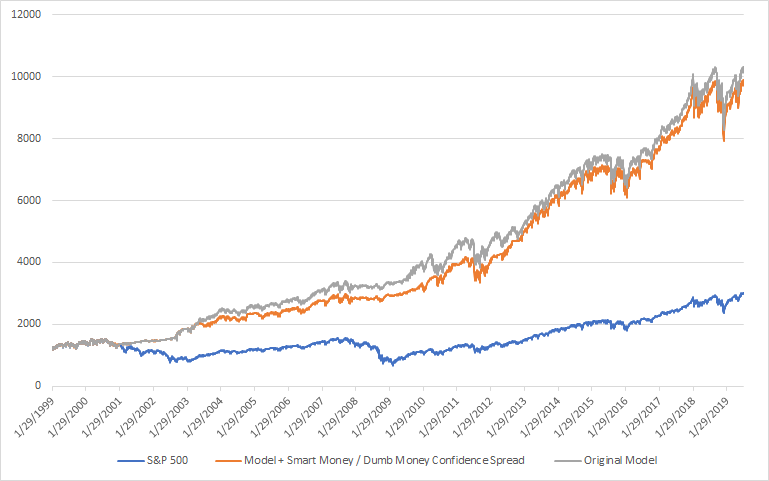
Here are the results for the Stock/Bond Ratio. These results are not final, and may need corrections/adjustments.
Adding SELL signals
The new model looks like this:
- Buy and hold the S&P 500 if the S&P 500 is >= its 12 month moving average, OR the Unemployment Rate is <= its 12 month moving average
- Otherwise, SELL.
- Also, SELL if at any point over the past 2 months the Stock/Bond Ratio was >2.5
When you SELL, Buy and hold the Bloomberg Barclays US Aggregate Bond Total Return Index
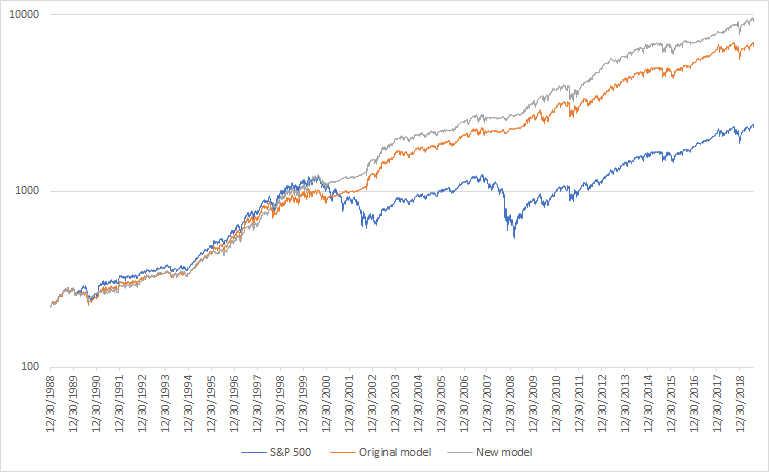
Here are the strategy's returns:
As you can see, selling stocks when the Stock/Bond ratio exceeds 2.5 is beneficial for one's portfolio. Doing so increases your returns and decreases your volatility/drawdowns because it helps avoid some (but not all) corrections.
Intermediate Term Optimism Index
Our Intermediate Term Optimism Index has crossed above 65 right now, which is our threshold for Excessive Optimism.
While this is not extreme by any means (the Intermediate Term Optimism Index was much higher in April and July 2019), it is still above-average. Readings above 65 in the past have been slightly more bearish than random for stocks.
The following chart looks at what happens when:
- You buy the S&P 500 if over the past 2 months the Intermediate Term Optimism Index has been above 65. (in blue)
- You buy the Bloomberg Barclays U.S. Aggregate Bond Index if over the past 2 months the Intermediate Term Optimism Index has been above 65. (in orange)
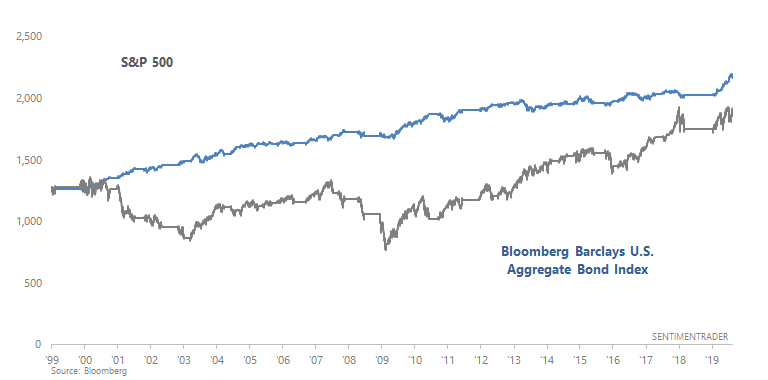
As you can see, it's slightly better to avoid stocks when the Intermediate Term Optimism Index is above 65. However, the edge isn't strong. Overall, it's better to wait until this indicator exceeds 75.
In the future, we will try to add the Intermediate Term Optimism Index to our models and see if doing so increases the models' returns.
Smart Money
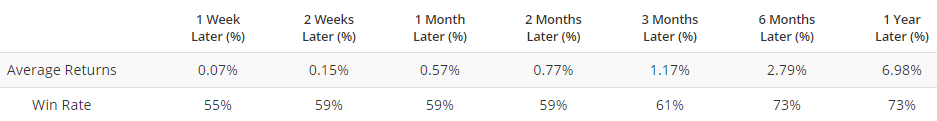
Similarly, the Smart Money / Dumb Money Confidence Spread has fallen below -0.25, which is our threshold for Excessive Optimism.
When this happened in the past, the S&P's returns over the next 2 months were slightly less bullish than random.
The following chart looks at what happens when:
- You buy the S&P 500 if over the past 2 months the Smart Money / Dumb Money Confidence Spread falls below -0.25
- You buy the Bloomberg Barclays U.S. Aggregate Bond Index if over the past 2 months the Smart Money / Dumb Money Confidence Spread falls below -0.25
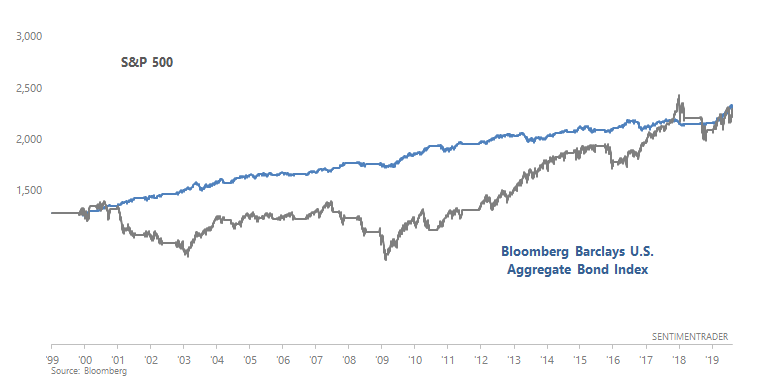
While "buy the S&P 500" results weren't much worse than "buy bonds" results, buying bonds was the less volatile option as this SELL signal avoided many corrections.
Overall, stock market sentiment is not excessively optimistic right now. Optimism is rising, but that is to be expected as price is also rising.
In the future, we will try to add the Smart Money / Dumb Money Confidence Spread to our models and see if doing so increases the models' returns.
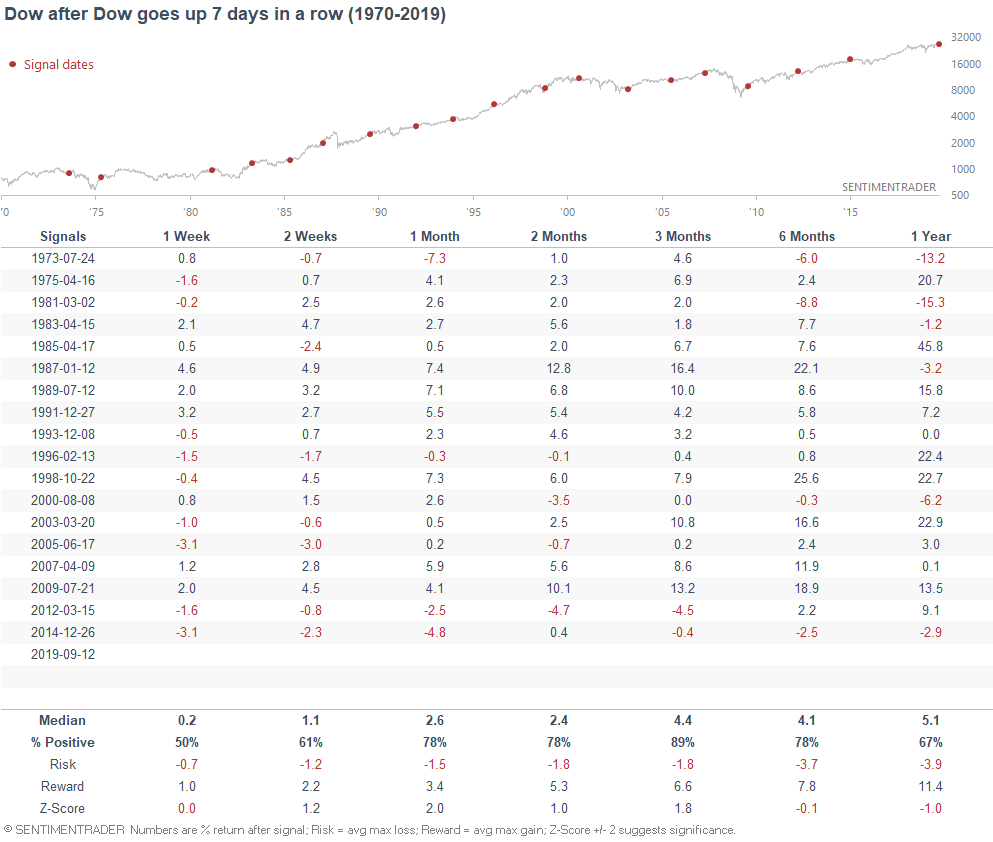
Dow 7 days
And lastly, the Dow has gone up 7 days in a row. From 1970-present, this has mostly been a positive for stocks over the next 3 months.