Data &
Technology
Research
Reports
Report Solutions
Reports Library
Actionable
Strategies
Free
Resources
Simple Backtest Calculator
Simple Seasonality Calculator
The Kelly Criterion Calculator
Sentiment Geo Map
Public Research Reports
Free Webinar
Pricing
Company
About
Meet Our Team
In the News
Testimonials
Client Success Stories
Contact
Log inLoginSign up
< BACK TO ALL REPORTS

What Happens When Volatility Spikes as Stocks Churn Near Highs

Jason Goepfert
2021-10-13
Even though the S&P 500 isn't far from its former highs, its 10-day historical, realized volatility has spiked to a multi-month high.

For those who were indoctrinated on technical analysis textbooks, we were taught that when stocks turn volatile during a bull market, then trouble is brewing.

It's simply not true. Or at least not consistently enough to be a useful heuristic.

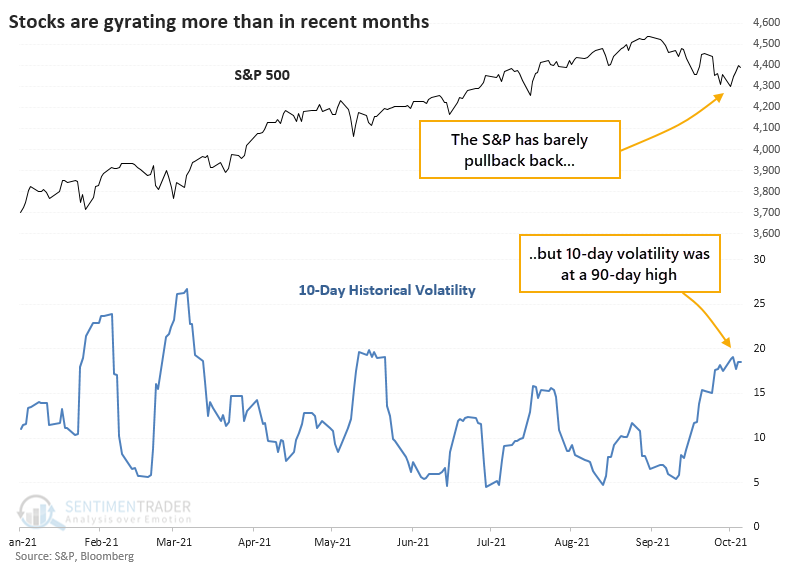
It's an issue now because the S&P 500 is mired in its longest pullback in a year. Despite a relatively shallow pullback, though, the index has been gyrating wildly, with over a week of days with 1% daily moves. That has pushed the index's 10-day realized volatility to a 90-day high.

S&P 500 realized volatility

Instead of reading tea leaves, let's look at the evidence. When we go back to 1928 and look at every time when the S&P was close to a former high and its 10-day volatility rose to a multi-month high, the S&P's returns over the next two months were nothing special. It showed a positive return only half the time, with a median return well below random.

But that was about it for the bearish side of things. Over the next six months, the index rose after 20 out of 22 signals.


What else we're looking at

  • Full returns following rising volatility when stocks are near a high
  • Decision time for Roku's stock, and how to trade it using options
  • The Hang Seng index has triggered a reversal signal

Stat box

The largest ETF in the U.S., SPY, has closed in the bottom 25% of its intraday range for 4 consecutive sessions. That's tied for the 2nd-longest streak of weak closes in the fund's history.

Etcetera

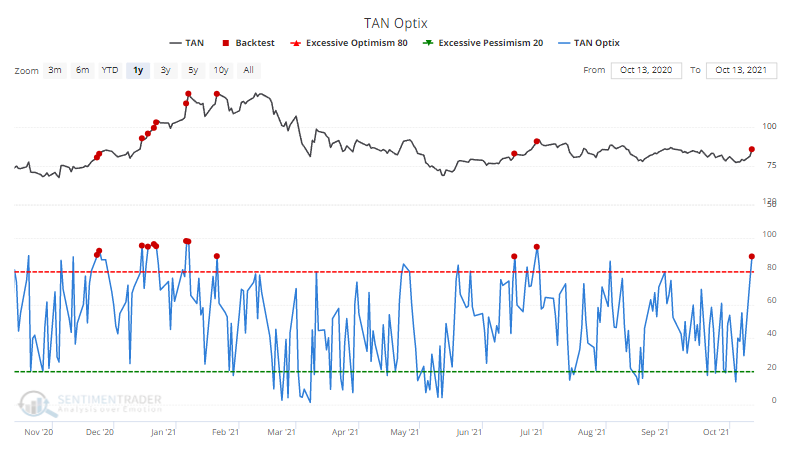
Sun shines on solar stocks. A jump in solar stocks pushed the TAN fund higher and the Optimism Index soared close to 90% for one of the handful of times in the past year.

tan solar sentiment optimism index

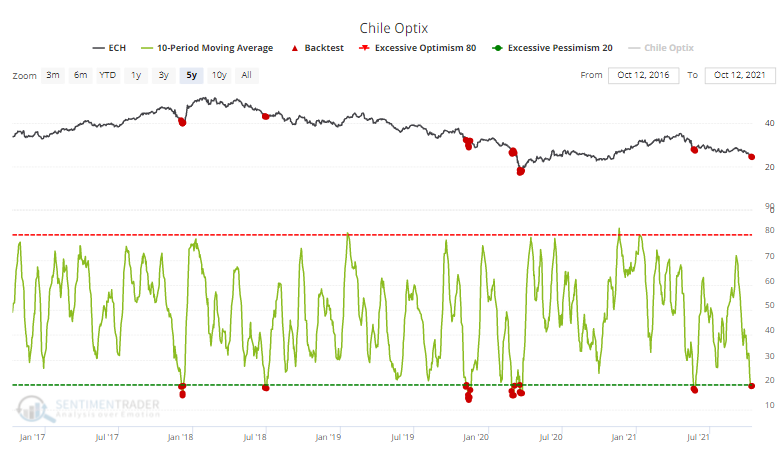
Chile peppered with selling. The ECH fund focused on Chilean stocks is showing the most pessimism out of any ETFs we follow over the past 10 days. Our Backtest Engine shows that the fund rallied 82% of the time since its inception after optimism was this low.

ech chile sentiment optimism index

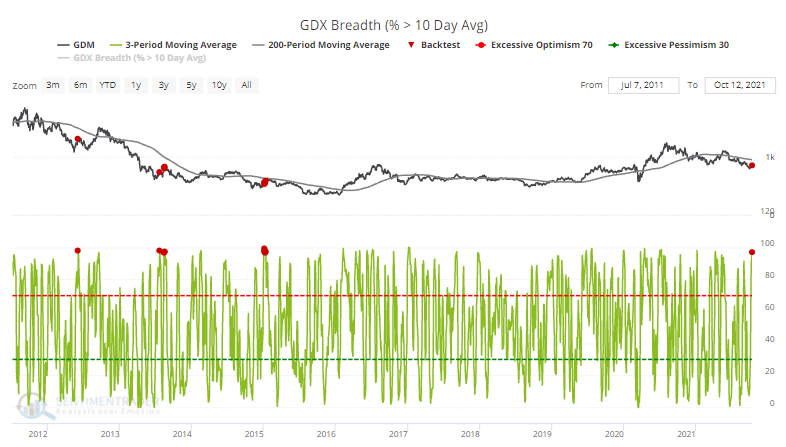
Big test for gold miners. Over the past three days, an average of 97% of gold mining stocks have held above their 10-day moving averages, even while the GDX fund is trading below a declining 200-day moving average. Similar setups (red dots in the chart from our Backtest Engine) showed that miners rolled over quickly after the others.

gdx members above 10 day moving average

DATA &
TECHnologies
IndicatorEdge
‍
BackTestEdge
‍
Other Tools
‍
DataEdge API
RESEARCH
reports
Research Solution
‍
Reports Library
‍
actionable
Strategies
Trading Strategies
‍
Smart Stock Scanner
‍
FREE
RESOUrCES
Simple Backtest
Calculator
Simple Seasonality
Calculator
The Kelly Criterion
Calculator
Sentiment Geo Map
‍
Public Research Reports
‍
Free Webinar
COMPANY
‍
About
‍
Meet our Team
‍
In the News
‍
Testimonials
‍
Client Success Stories
Pricing
Bundle pricing
‍
Announcements
‍
FAQ
© 2024 Sundial Capital Research Inc. All rights reserved.
Setsail Marketing
TermsPrivacyAffiliate Program
Risk Disclosure: Futures and forex trading contains substantial risk and is not for every investor. An investor could potentially lose all or more than the initial investment. Risk capital is money that can be lost without jeopardizing ones’ financial security or life style. Only risk capital should be used for trading and only those with sufficient risk capital should consider trading. Past performance is not necessarily indicative of future results.

Hypothetical Performance Disclosure: Hypothetical performance results have many inherent limitations, some of which are described below. No representation is being made that any account will or is likely to achieve profits or losses similar to those shown; in fact, there are frequently sharp differences between hypothetical performance results and the actual results subsequently achieved by any particular trading program. One of the limitations of hypothetical performance results is that they are generally prepared with the benefit of hindsight. In addition, hypothetical trading does not involve financial risk, and no hypothetical trading record can completely account for the impact of financial risk of actual trading. for example, the ability to withstand losses or to adhere to a particular trading program in spite of trading losses are material points which can also adversely affect actual trading results. There are numerous other factors related to the markets in general or to the implementation of any specific trading program which cannot be fully accounted for in the preparation of hypothetical performance results and all which can adversely affect trading results.

Testimonial Disclosure: Testimonials appearing on this website may not be representative of other clients or customers and is not a guarantee of future performance or success.