Data &
Technology
Research
Reports
Report Solutions
Reports Library
Actionable
Strategies
Free
Resources
Simple Backtest Calculator
Simple Seasonality Calculator
The Kelly Criterion Calculator
Sentiment Geo Map
Public Research Reports
Free Webinar
Pricing
Company
About
Meet Our Team
In the News
Testimonials
Client Success Stories
Contact
Log inLoginSign up
< BACK TO ALL REPORTS

What happens when stocks soar during a bear market

Jason Goepfert
2020-05-12
The S&P 500 has soared more than 7% above its 50-day moving average, the most since 2011. Yet it's still below its 200-day average.

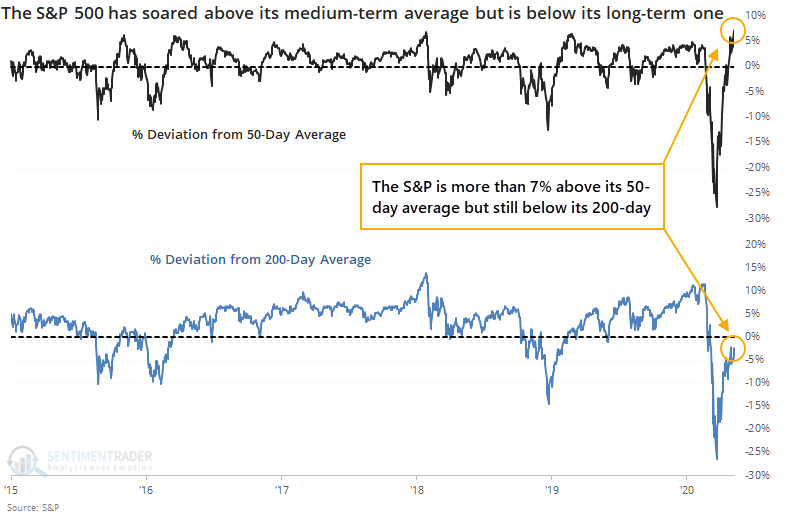
When stocks rocketed higher out of a selloff in the fall of 2011, buyers pushed the S&P 500 more than 7% above its 50-day moving average. It hasn't been that far above its medium-term average in the nearly 9 years since, until Friday.

The biggest difference between that time period and the current one is that the October 2011 rally also pushed the S&P above its long-term 200-day average. This time, stocks declined enough that even with the rally, the S&P is still trading below its 200-day.

When stocks have rebounded so much during a long-term downtrend, returns over the coming weeks and months are more fraught than if the long-term environment was more positive. And whether investors have enough oomph to keep pushing stocks higher in the coming week(s) will signify whether this is more likely the kick-off of a new bull market, or just a bear market rally.

Below, we can see the S&P's forward returns if the first week following these signals was negative.

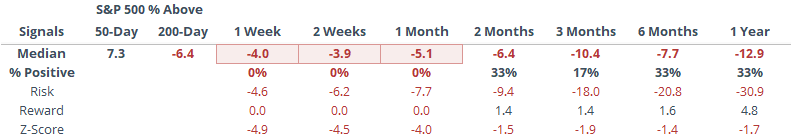
Only once did this lack of buying interest reverse itself over the next 3 months. Something to keep in mind depending on how the next week goes.


This is an abridged version of our recent reports and notes. For immediate access with no obligation, sign up for a 30-day free trial now.

We also looked at:

  • A more detailed look at how stocks perform after these 50/200-day divergences
  • The Cumulative Advance/Decline Line hasn't bounced nearly as much as the S&P 500
  • The Nasdaq has rallied for 6 straight days - what that means for the broader market
  • Our Optimism Index on QQQ is the highest in almost a decade
  • Mutual fund timers are piling into Rydex funds
  • The equal-weight S&P 500 can't keep up with the cap-weight version
  • Internet stocks have skyrocketed
  • What happens when the Nasdaq 100 is up more than 40% over 7 weeks
DATA &
TECHnologies
IndicatorEdge
‍
BackTestEdge
‍
Other Tools
‍
DataEdge API
RESEARCH
reports
Research Solution
‍
Reports Library
‍
actionable
Strategies
Trading Strategies
‍
Smart Stock Scanner
‍
FREE
RESOUrCES
Simple Backtest
Calculator
Simple Seasonality
Calculator
The Kelly Criterion
Calculator
Sentiment Geo Map
‍
Public Research Reports
‍
Free Webinar
COMPANY
‍
About
‍
Meet our Team
‍
In the News
‍
Testimonials
‍
Client Success Stories
Pricing
Bundle pricing
‍
Announcements
‍
FAQ
© 2024 Sundial Capital Research Inc. All rights reserved.
Setsail Marketing
TermsPrivacyAffiliate Program
Risk Disclosure: Futures and forex trading contains substantial risk and is not for every investor. An investor could potentially lose all or more than the initial investment. Risk capital is money that can be lost without jeopardizing ones’ financial security or life style. Only risk capital should be used for trading and only those with sufficient risk capital should consider trading. Past performance is not necessarily indicative of future results.

Hypothetical Performance Disclosure: Hypothetical performance results have many inherent limitations, some of which are described below. No representation is being made that any account will or is likely to achieve profits or losses similar to those shown; in fact, there are frequently sharp differences between hypothetical performance results and the actual results subsequently achieved by any particular trading program. One of the limitations of hypothetical performance results is that they are generally prepared with the benefit of hindsight. In addition, hypothetical trading does not involve financial risk, and no hypothetical trading record can completely account for the impact of financial risk of actual trading. for example, the ability to withstand losses or to adhere to a particular trading program in spite of trading losses are material points which can also adversely affect actual trading results. There are numerous other factors related to the markets in general or to the implementation of any specific trading program which cannot be fully accounted for in the preparation of hypothetical performance results and all which can adversely affect trading results.

Testimonial Disclosure: Testimonials appearing on this website may not be representative of other clients or customers and is not a guarantee of future performance or success.