
What Happens When Bonds' Buffer is Broken

When stocks have been falling, bonds haven't provided much of a haven. And it's scaring some investors that held ingrained beliefs about the nature of the two assets to backstop each other.
Over the past 60 days, the correlation of daily changes between the S&P 500 and 10-year Treasury yields has turned decidedly negative. This means that on days when the S&P fell, note yields often rose, meaning bond prices declined along with stocks. When both stocks and bonds fall together, then a large part of most investors' portfolios take a hit.
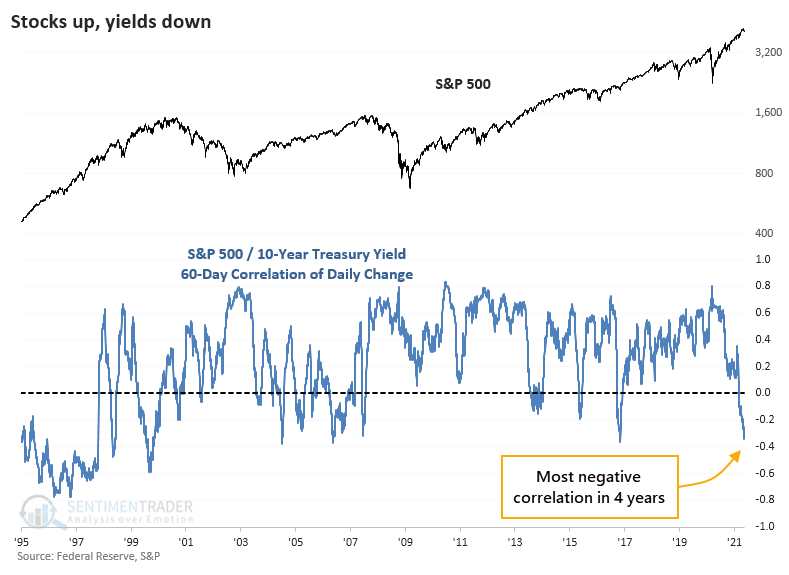
The chart above shows that the correlation is now among the most negative in 25 years. Zooming out for a longer view, a negative correlation was more the rule than the exception.
Once the relationship between stocks and yields turned this negative, stocks struggled. Over the next 3 months, the S&P 500 rose only 27% of the time and suffered a negative median return.
While Risk Parity strategies have struggled lately, they tended to rebound over the next 6-12 months after these signals.

| Stat Box For the 1st time in more than 3 months, gold crossed above its 200-day moving average. Of the 22 other times it has ended a streak of several months below its average, it showed a positive return 3 months later 45% of the time, averaging -1.4%. |
What else we're looking at
- Full details about S&P 500 returns following negative correlations with rates
- Forward returns in yields and Risk Parity strategies, too
- An in-depth look at commodities versus stocks and returns during on/off regimes
- Updating absolute and relative trends among sector, industry, and country ETFs