Data &
Technology
Research
Reports
Report Solutions
Reports Library
Actionable
Strategies
Free
Resources
Simple Backtest Calculator
Simple Seasonality Calculator
The Kelly Criterion Calculator
Sentiment Geo Map
Public Research Reports
Free Webinar
Pricing
Company
About
Meet Our Team
In the News
Testimonials
Client Success Stories
Contact
Log inLoginSign up
< BACK TO ALL REPORTS

What happens in Month 2 of Year 1

Jason Goepfert
2021-02-01
The 2nd month in a post presidential election year has been a struggle for most sectors.

February of 2021 represents the 2nd month of the Post-Election Year in the 4-Year Election Cycle.

Is there a way to categorize the typical stock market performance during February of Post-Election Years? Yes...in a word, "Poor", both on an absolute and a relative basis.

For each of the 48 months of the election cycle, Jay looked at the average return for all sectors during that particular month (#1 for January of the Post-Election year to #48 for December of the Election Year) starting in January 1929 through December 2020.  This represents a total of 23 completed 4-year election cycles.

Here's the kicker...in terms of average monthly return, Month 2 ranked 47 out of 48 months at -1.10%. The chart below shows the average return among all sectors for the month.

Sector performance during year 2 February presidential seasonal cycle

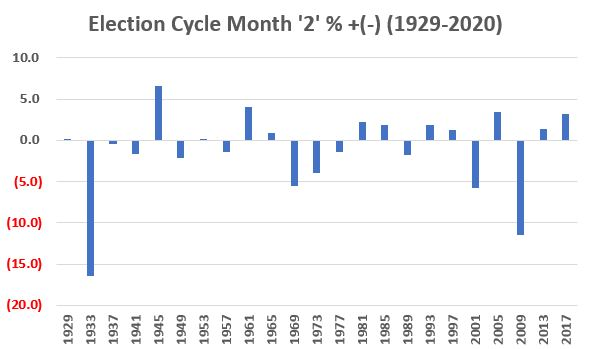
Despite all of this apparent negativity, it should be recognized that Month 2 showed a positive return in 12 out of 23 cycles since 1929. So, you should NOT assume that February of 2021 is doomed to be a bad month for stocks. What you DO need to recognize is that when Month 2 is good, it is OK. And when Month 2 is bad it is often very bad.  


What else we're looking at

  • After a big rally and relative calm, prices have started to gyrate
  • During the first year after a presidential election, some sectors have struggled mightily

Stat Box

Last week, the smallest of options traders bought 28.7 million calls to open. This is a direct bet on higher prices, and it's 30% higher than any other week in more than 20 years.


Sentiment from other perspectives

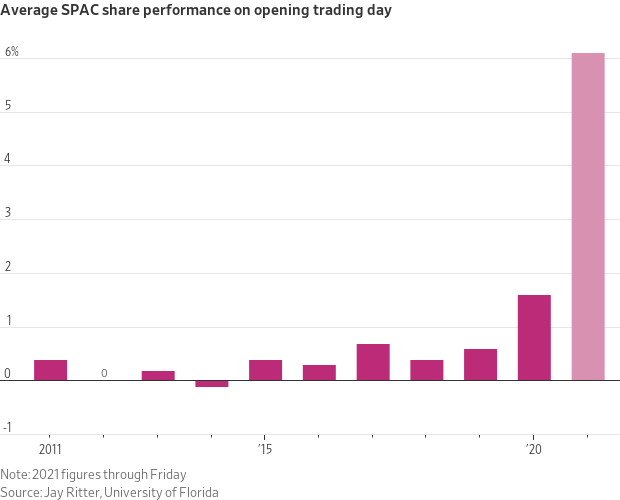
As if it couldn't get any more speculative, day traders are now piling into companies before those companies even have anything to operate. Blank check companies are just pools of cash, and these SPACs have been jumping as traders rush in. Source: Wall Street Journal

spac ipo performance


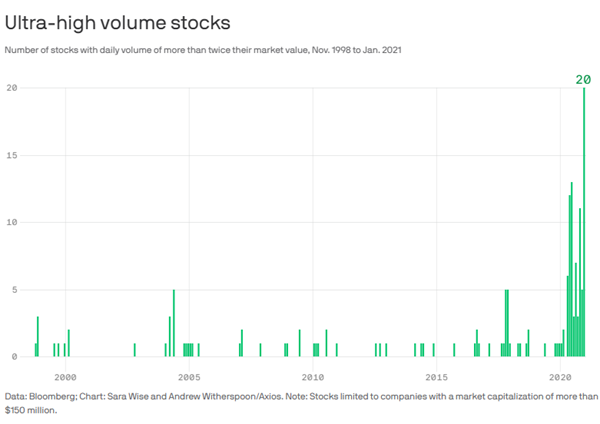
A record number of companies have doubled their trading volume. Another sign of the gambling frenzy that has overtaken the stock (and now commodity) market, there haven't been this many stocks with a 100% increase in trading volume in at least 22 years. Source: Axios

ultra high volume stocks

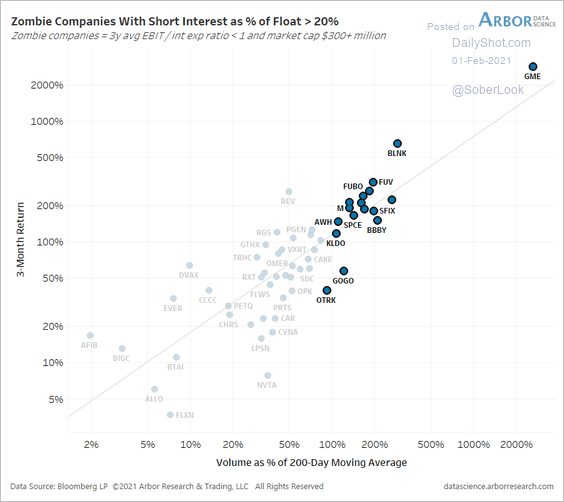
Squeezing zombies. A lot of these high-volume stocks are dead men walking. The highest-volume stocks have been those with so much debt they can't cover their interest payments. But a lot of folks have shorted them, so they've become trading targets. Source: Arbor Research via Daily Shot

zombie companies high short interest volume

DATA &
TECHnologies
IndicatorEdge
‍
BackTestEdge
‍
Other Tools
‍
DataEdge API
RESEARCH
reports
Research Solution
‍
Reports Library
‍
actionable
Strategies
Trading Strategies
‍
Smart Stock Scanner
‍
FREE
RESOUrCES
Simple Backtest
Calculator
Simple Seasonality
Calculator
The Kelly Criterion
Calculator
Sentiment Geo Map
‍
Public Research Reports
‍
Free Webinar
COMPANY
‍
About
‍
Meet our Team
‍
In the News
‍
Testimonials
‍
Client Success Stories
Pricing
Bundle pricing
‍
Announcements
‍
FAQ
© 2024 Sundial Capital Research Inc. All rights reserved.
Setsail Marketing
TermsPrivacyAffiliate Program
Risk Disclosure: Futures and forex trading contains substantial risk and is not for every investor. An investor could potentially lose all or more than the initial investment. Risk capital is money that can be lost without jeopardizing ones’ financial security or life style. Only risk capital should be used for trading and only those with sufficient risk capital should consider trading. Past performance is not necessarily indicative of future results.

Hypothetical Performance Disclosure: Hypothetical performance results have many inherent limitations, some of which are described below. No representation is being made that any account will or is likely to achieve profits or losses similar to those shown; in fact, there are frequently sharp differences between hypothetical performance results and the actual results subsequently achieved by any particular trading program. One of the limitations of hypothetical performance results is that they are generally prepared with the benefit of hindsight. In addition, hypothetical trading does not involve financial risk, and no hypothetical trading record can completely account for the impact of financial risk of actual trading. for example, the ability to withstand losses or to adhere to a particular trading program in spite of trading losses are material points which can also adversely affect actual trading results. There are numerous other factors related to the markets in general or to the implementation of any specific trading program which cannot be fully accounted for in the preparation of hypothetical performance results and all which can adversely affect trading results.

Testimonial Disclosure: Testimonials appearing on this website may not be representative of other clients or customers and is not a guarantee of future performance or success.