
What extreme price swings suggest about our current environment

Key points:
- The S&P 500 has suffered a large number of 1% daily moves over the past 2 months
- But there have been few days with 2% moves, and no days with 3% swings
- A high - but not extreme - volatility environment occurred 62% of the time during bull markets
High volatility, yes, but not extreme
One of the market tropes being bandied about now is that since stocks are swinging wildly from day to day, it necessarily means that the bull market is over. Only during bear markets do we see volatility like this.
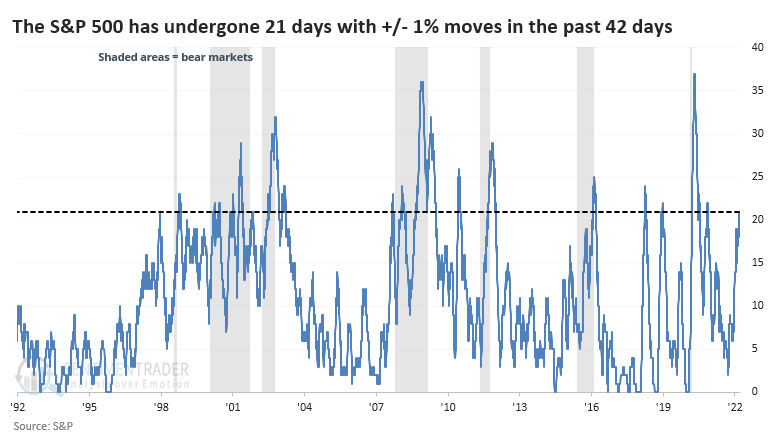
It certainly has been volatile. Over the past 2 months, the S&P 500 has had a closing gain or loss of more than 1% on 21 sessions, exactly half the sessions. That's high.
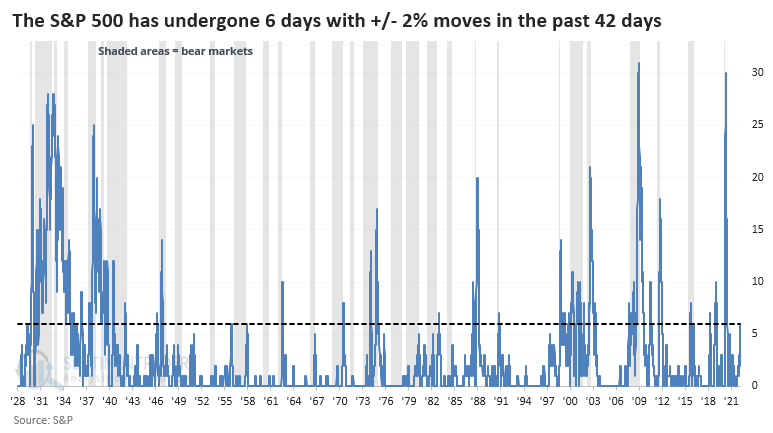
The chart below shows the number of +/- 1% daily changes in the S&P over a rolling 42-day stretch, with the gray shading highlighting bear markets. Most of the heavy clusters of 1% swings certainly seemed to be during bear markets.
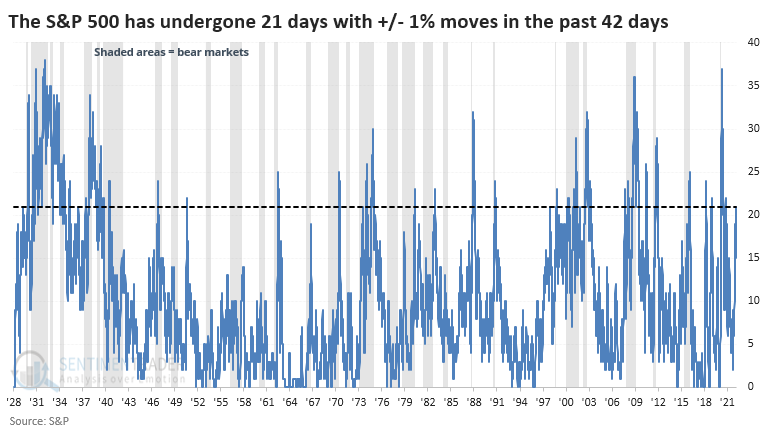
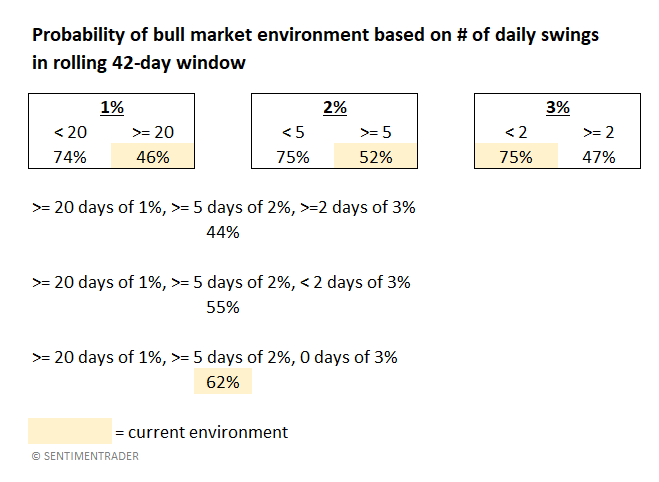
It gets noisy as we zoom out, but going back to 1928, it looks like pretty much the same thing. But there were 3,038 days when the rolling count of 1% days met or exceeded 20, and 1,397 of those days were during bull markets. So, if we were witnessing a big cluster of 1% daily swings, there was still a 46% chance we were in a bull market environment (note that many of those occurred at the end of bear markets and the start of new bull markets).
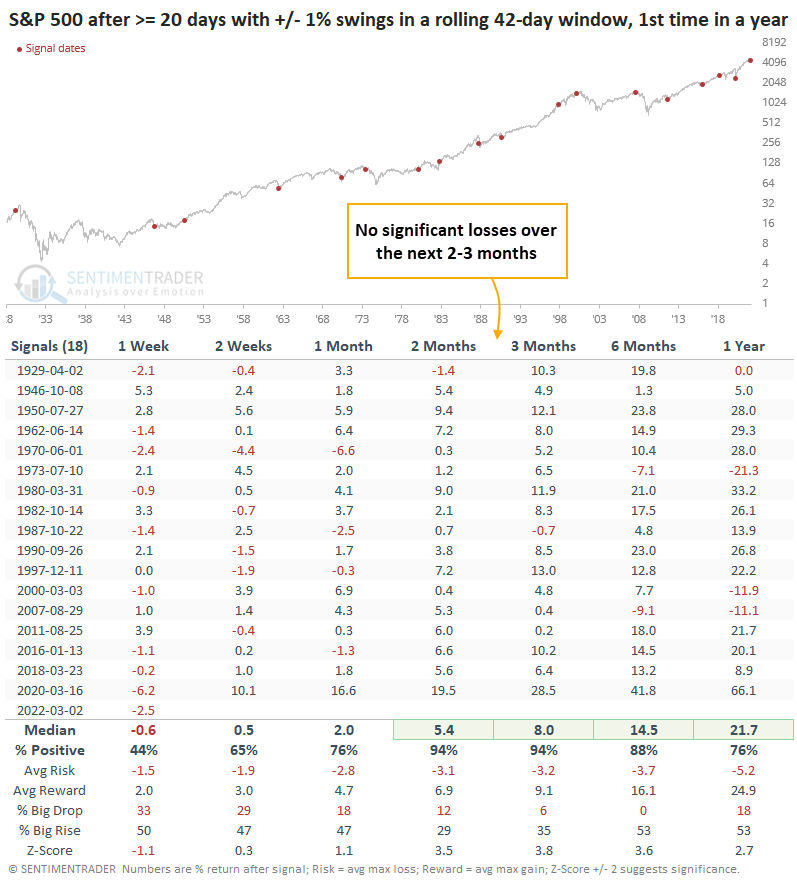
If stocks enter a period of high volatility, with more than 20 days of 1% swings during a 2-month span, then it didn't necessarily mean a bear market was imminent. In fact, it never did. Stocks eventually fell into a bear market after the signals in 1973, 2000, and 2007, but not before rebounding first.
There has also been a rise in even more significant swings, with 6 days of daily changes larger than 2%. Still, it's far from the extreme volatility investors suffered during recent bear markets.
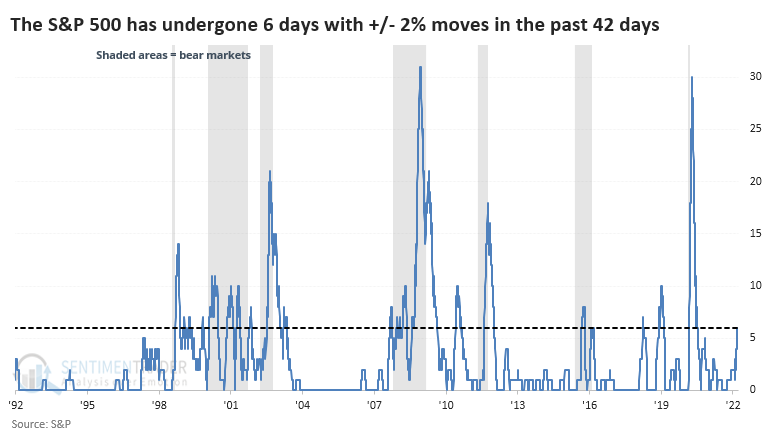
Zooming out, there were 4,489 days with 5 or more swings of +/-2% during a 42-day window, and 2,316 of those were during bull markets. That means there was a 52% chance we were in a bull market even with a relatively high number of large daily changes.
Truly extreme daily moves have been missing
Curiously, there have been no daily swings of 3% or more in the S&P since January. This is a relatively rare stretch of high - but not truly extreme - price swings.
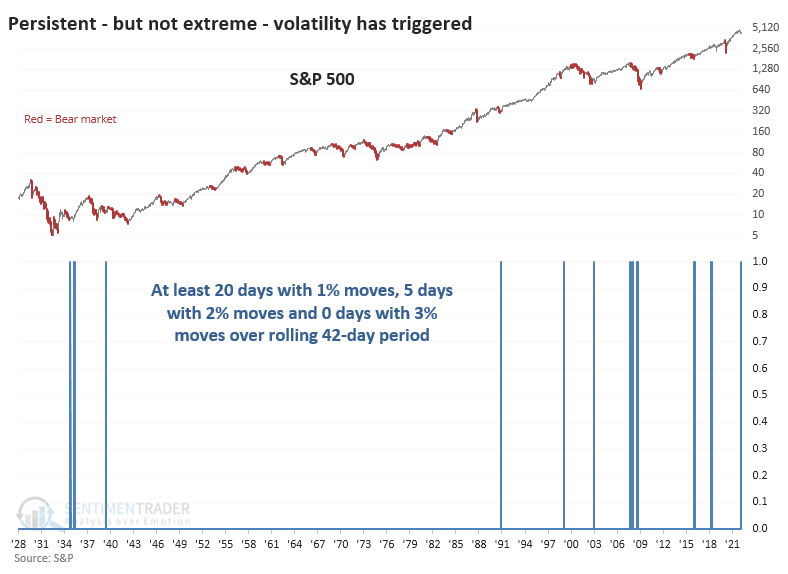
Since 1928, there have been 154 days when the S&P at least 1% on 20 or more days, 2% on 5 or more days, but underwent no swings of 3% or more. Out of those days, 95 occurred during bull markets. So, there was a 62% probability that we were in a bull market environment if we saw price action like we're seeing now.
This seems like an important distinction. If these 42-day stretches included at least 2 days with a daily swing of 3% or more, then the chance that we were in a bull market environment dropped to 44%.
What the research tells us...
When investors are uncertain, they become less optimistic. When they become less optimistic, they are more prone to sell. That activity triggers higher day-to-day volatility in both directions. Bull markets tend to see fewer big swings and even fewer massive swings of 3% or more. The more clustered days of extreme price swings we see, the less likely we're in a bull market environment. Even though the past 2 months have seen a high number of 1% swings, we have witnessed relatively few 2% swings and no 3% swings. That should be considered a good sign. If we undergo higher volatility in the days and weeks ahead, with more 2% and 3% daily moves, then the probability that we're still in a bull market environment drops dramatically.