Data &
Technology
Research
Reports
Report Solutions
Reports Library
Actionable
Strategies
Free
Resources
Simple Backtest Calculator
Simple Seasonality Calculator
The Kelly Criterion Calculator
Sentiment Geo Map
Public Research Reports
Free Webinar
Pricing
Company
About
Meet Our Team
In the News
Testimonials
Client Success Stories
Contact
Log inLoginSign up
< BACK TO ALL REPORTS

What Do Options Traders Know?

Jason Goepfert
2021-09-14
Even as realized volatility in the S&P 500 dips close to record lows, options traders are pricing in higher volatility.

Options traders don't trust the calm conditions.

The S&P 500 declined for 5 consecutive sessions, but the overall loss was tiny. Historically, that combination has preceded a rebound - calm conditions tend to persist until that one moment when they don't, and the trend changes.

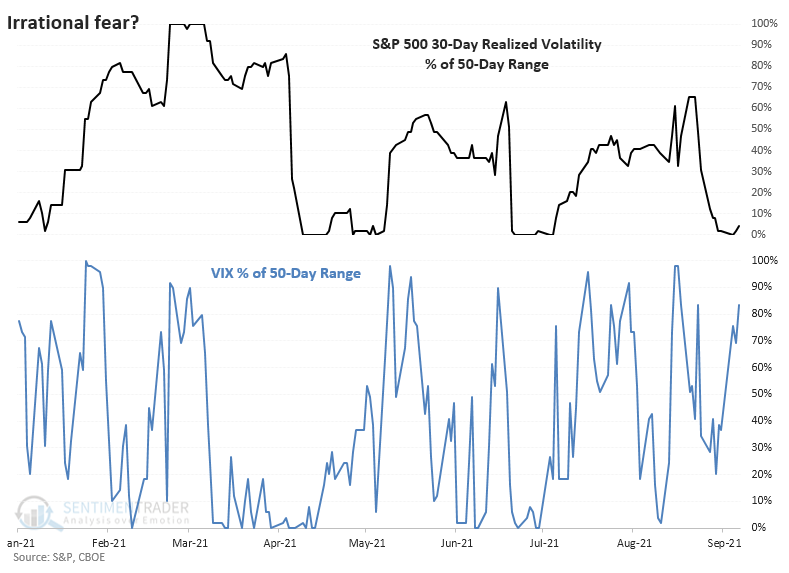
Conditions have been pretty much perfect for stock investors all year. A slow, steady drumbeat of gains is nirvana. But the VIX "fear gauge" of implied future volatility has been holding up for weeks, which is unusual since it's occurring at the same time that actual, realized volatility in the S&P 500 index has dripped close to all-time lows.

This becomes clearer when we look at realized volatility versus its 50-day trading range. It's scraping the bottom of it. But the VIX has been priced at the upper end of its own range.

S&P historical volatility versus VIX

So who knows more, equity investors or volatility traders? A look at historical signals shows that in the short-term, options traders are "smarter," while in the medium-term, investors have been.

Over the next 1-4 weeks, the S&P had great difficulty holding any meaningful gains when this signal triggered while the index was hovering within 1% of its prior highs, as it was last week. Even so, over the next two months, it rallied every time. And longer-term, there were no major losses.


What else we're looking at

  • Full details on S&P 500 and VIX forward returns after divergences in their ranges
  • An update on absolute and relative trends in industry, sector, and country ETFs
  • What happens after persistent - but small - declines in the S&P 500

Stat box

Fewer than 40% of stocks in the S&P 500 have outperformed the index over the past three months, and this has persisted for more than 40 sessions. According to Dean's calculations, that just set a record for the longest stretch of individual-stock underperformance since 1928.

Etcetera

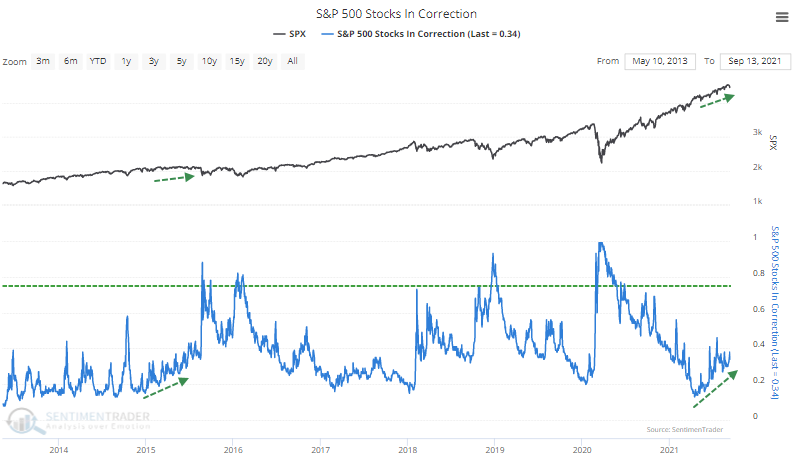
Rolling corrections. Since April, there has been a rolling correction among stocks in the S&P 500. Even as the index has marched steadily higher, more and more stocks are trailing their 52-week highs by more than 10%, similar activity to 2015.

s&p 500 stocks in correction

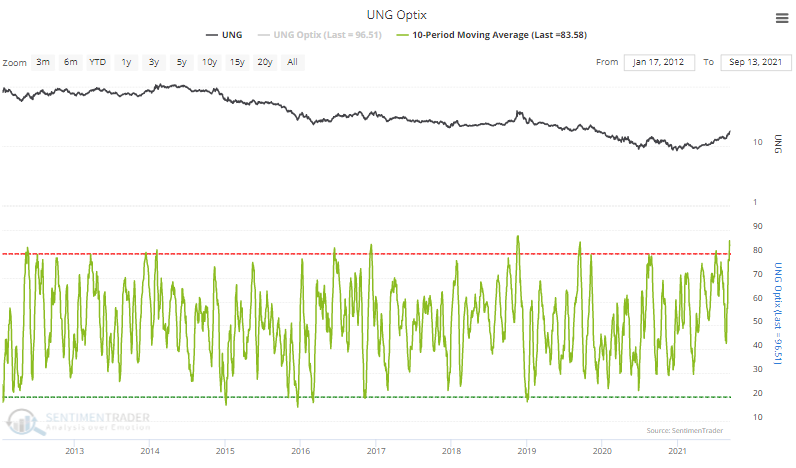
Unnatural gas. The 10-day Optimism Index on the UNG natural gas fund has climbed above 83%, the 2nd-highest reading since the fund's inception.

ung natural gas sentiment

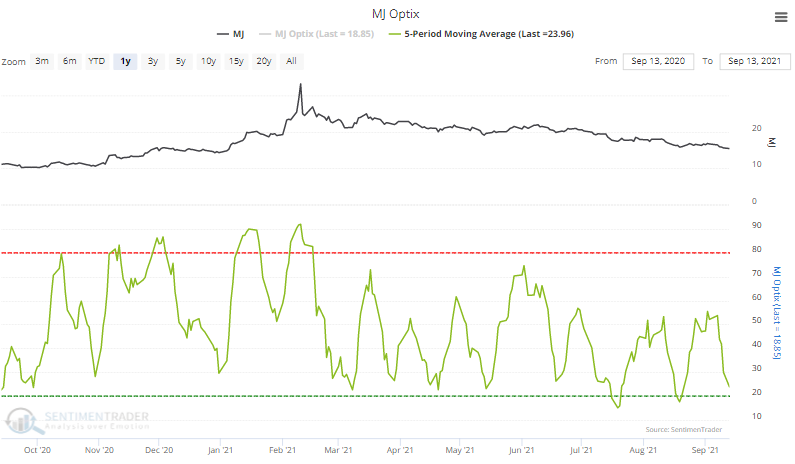
Pot has gone to pot. The 5-day average Optimism Index for the MJ cannabis fund has been smoked and is now at the lower end of the range over the past year.

mj cannabis sentiment

DATA &
TECHnologies
IndicatorEdge
‍
BackTestEdge
‍
Other Tools
‍
DataEdge API
RESEARCH
reports
Research Solution
‍
Reports Library
‍
actionable
Strategies
Trading Strategies
‍
Smart Stock Scanner
‍
FREE
RESOUrCES
Simple Backtest
Calculator
Simple Seasonality
Calculator
The Kelly Criterion
Calculator
Sentiment Geo Map
‍
Public Research Reports
‍
Free Webinar
COMPANY
‍
About
‍
Meet our Team
‍
In the News
‍
Testimonials
‍
Client Success Stories
Pricing
Bundle pricing
‍
Announcements
‍
FAQ
© 2024 Sundial Capital Research Inc. All rights reserved.
Setsail Marketing
TermsPrivacyAffiliate Program
Risk Disclosure: Futures and forex trading contains substantial risk and is not for every investor. An investor could potentially lose all or more than the initial investment. Risk capital is money that can be lost without jeopardizing ones’ financial security or life style. Only risk capital should be used for trading and only those with sufficient risk capital should consider trading. Past performance is not necessarily indicative of future results.

Hypothetical Performance Disclosure: Hypothetical performance results have many inherent limitations, some of which are described below. No representation is being made that any account will or is likely to achieve profits or losses similar to those shown; in fact, there are frequently sharp differences between hypothetical performance results and the actual results subsequently achieved by any particular trading program. One of the limitations of hypothetical performance results is that they are generally prepared with the benefit of hindsight. In addition, hypothetical trading does not involve financial risk, and no hypothetical trading record can completely account for the impact of financial risk of actual trading. for example, the ability to withstand losses or to adhere to a particular trading program in spite of trading losses are material points which can also adversely affect actual trading results. There are numerous other factors related to the markets in general or to the implementation of any specific trading program which cannot be fully accounted for in the preparation of hypothetical performance results and all which can adversely affect trading results.

Testimonial Disclosure: Testimonials appearing on this website may not be representative of other clients or customers and is not a guarantee of future performance or success.