
What credit spreads are telling us about the banking crisis

Key points
- The collapse of Silicon Valley Bank - and a sharp plunge in the banking and financial sectors - has raised serious concerns
- Nevertheless, the primary "canary in the coal mine" - i.e., credit spreads - remain noticeably below previous "panic" levels
- As long as these spreads remain muted in their response, it makes sense to stay calm
Credit spreads measure stress in the financial system
A credit spread measures the relationship between two interest rates. A give credit spread will typically remain within a "normal" range. However, when there are significant distortions and stress within the financial system, these spreads will widen as the yield on the lower-rated instrument will tend to "spike" relative to the higher-rated instrument (i.e., the perceived "safer" security) as investors engage in a so-called "flight to quality" to protect themselves in the face of a perceived risk.
So when credit spreads spike, it warns investors that something significant (invariably something perceived as "significantly bad") is impacting the financial markets. On the flip side of this scenario, when something perceived as significantly bad happens (ex., collapse of SVB) BUT credit spreads DO NOT spike, it can be an important signal that perhaps things are not as bad as they appear in the news.
Note that unlike most all research presented on Sentimentrader, the information below is more anecdotal than quantitative. It is intended to be more informational/educational than a specific trading idea. We will look at the history of four different credit spreads during previous financial crises and compare that action to more recent actions.
Once again, the thought to take away is this: When credit spreads widen sharply, it is a warning of real trouble. When perceived crisis occurs, but credit spreads do not spike, it is typically a time to ignore the hype and remain calm.
BBB - AAA Corporate Bond Yield Spread
This spread shows the option-adjusted spread on BBB-rated corporate bonds minus the spread on AAA-rated corporate bonds. A high and rising spread shows stress in the credit markets.
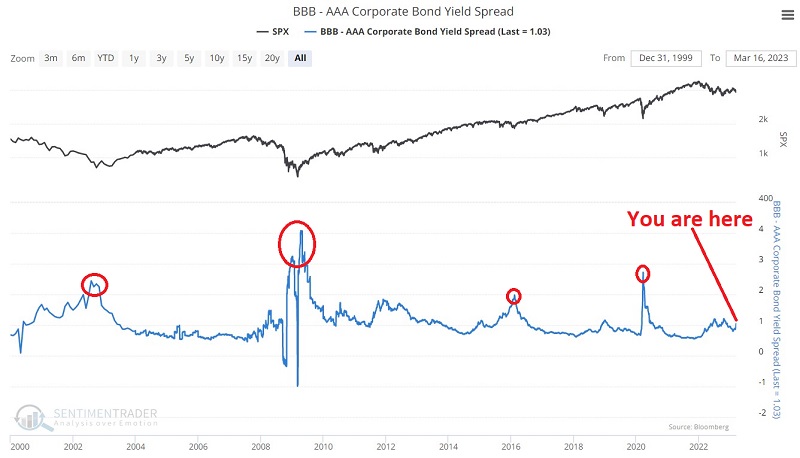
Note the large spikes in 2002, 2008, 2016, and 2020. While the spread has widened a bit recently, it is nowhere near the level of these earlier spikes.
CDX Index (Credit Default Swaps)
A credit default swap (CDS) allows various parties to swap the exposure of default of an underlying credit (i.e. bond). For example, an investor in a relatively risky bond might be uncomfortable that the bond issuer could default on their payments. To hedge that risk, the investor buys a CDS. When they purchase the CDS, the investor pays another trader (the seller) a periodic payment. That other trader then takes on the risk that the issuer of the bond will default. If that happens, the seller is responsible for paying the bond investor an agreed-upon amount. This allows the original investors to offset some of their risks, the seller to generate a stable flow of income, and the bond market to enjoy more liquidity.
Of course, just like selling options, the seller of a CDS takes on possibly significant risks, and a major system-wide event could trigger a massive wave of trouble since this market has become so huge.
As posted to the site, the indicator tracks an index created by Dow Jones, which monitors the spread between credit default swaps on high-yield (i.e. junk) bonds and Treasury securities. The higher the index, the wider the spread...this means that credit investors are increasingly worried about defaults and are willing to pay higher prices for default protection.
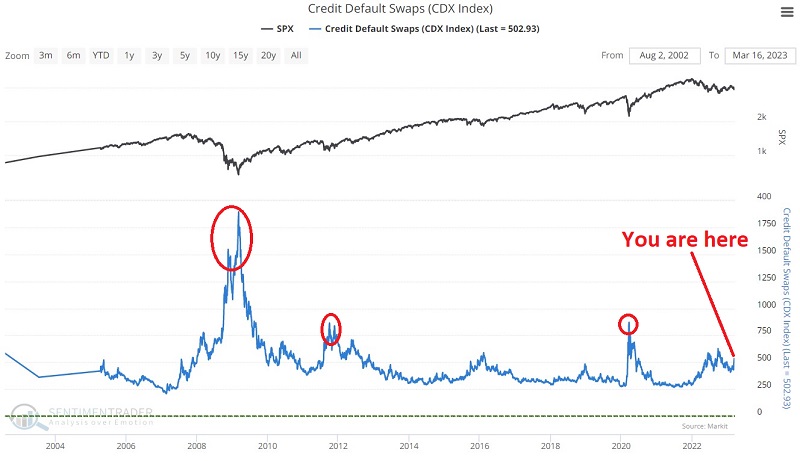
Note the large spikes in 2008, 2011, and 2020. While this spread has widened a bit recently, it too is nowhere near the level of these earlier spikes.
The TED Spread
The TED spread (Treasury - Eurodollars rate) is the difference between the three-month Treasury bill and the three-month LIBOR based in U.S. dollars, so the difference between the interest rate on short-term U.S. government debt and the interest rate on interbank loans. It's considered a measure of credit risk since short-term U.S. debt is considered "risk-free." The larger the spread, the more stress there is in the credit markets.
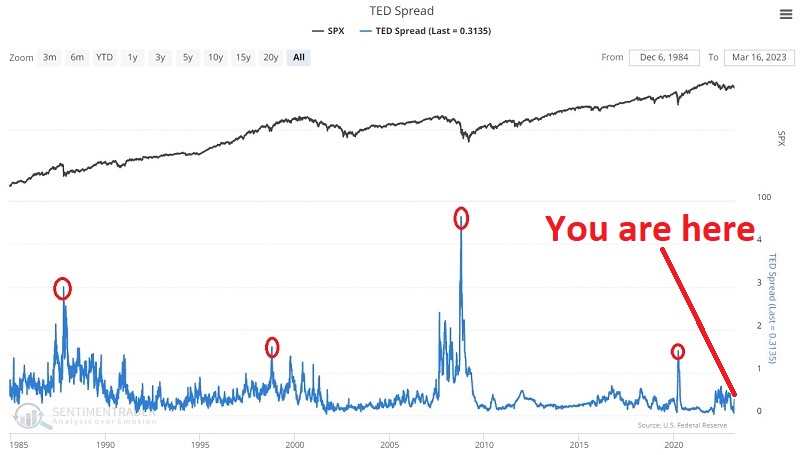
Note the large spikes in 1987, 1998, 2008, and 2020. During the recent "banking crisis," this spread - which deals directly with interbank loans - has remained notably muted.
The ICE Bank of America U.S. High Yield Index Option-Adjusted Spread
This spread represents the calculated spreads between below investment grade (those rated B.B. or below) and a spot Treasury curve. When credit concerns occur, this spread typically widens as investors move away from riskier high-yield bonds and towards treasury securities' perceived safety. 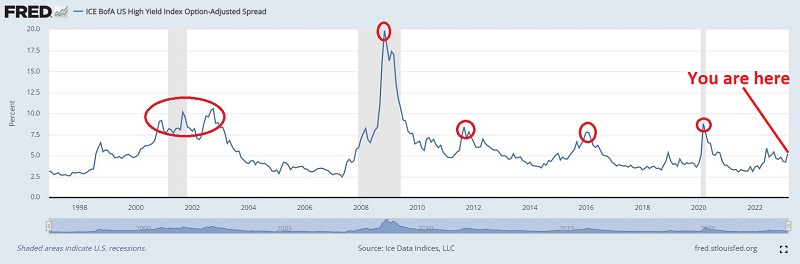
Note the large spikes in 2000-2002, 2011, 2016 2020. So far, the recent rise in this spread is nowhere near the level of these previous spikes.
What the research tells us…
Historically when there is stress in the financial system, credit spreads will widen. Typically, the more significant and impactful the stress, the more credit spreads will widen. Collectively the four spreads shown above have generated helpful warning signals to investors. Interestingly, despite the recent media hysteria regarding SVB and other banks, these spreads have remained relatively muted in their response. This suggests that the prominent players in the financial markets are not viewing the latest "crisis" as a four-alarm fire. That said, investors should keep a close on these spreads in the future. If they start to rise notably, it should be taken as a significant warning sign for stocks, bonds, and the economy.