Data &
Technology
Research
Reports
Report Solutions
Reports Library
Actionable
Strategies
Free
Resources
Simple Backtest Calculator
Simple Seasonality Calculator
The Kelly Criterion Calculator
Sentiment Geo Map
Public Research Reports
Free Webinar
Pricing
Company
About
Meet Our Team
In the News
Testimonials
Client Success Stories
Contact
Log inLoginSign up
< BACK TO ALL REPORTS

What a week

Jason Goepfert
2020-03-02
The Nasdaq Composite is the only "big four" index to hold above its 200-day average. Our CNN Fear & Greed proxy model fell to 0%.

In response to the historic selloff last week, we published the longest report since Christmas Eve 2018 that details many of the developments in price action (with context), wholesale selling pressure, and changes in sentiment.

We have no idea what will happen with the coronavirus. All we know is that investors behave in a generally similar way at certain points. And when looking at the decline through a variety of prisms, there was a consistent medium-term outlook. It says little about the very short-term (except to expect volatility) or the long-term (several similar environments morphed into bear markets).

Nasdaq holds up

Over a little over a week's time, the S&P 500, Dow Industrials, and Russell 2000 all fell below their 200-day averages. With its late recovery on Friday, the Nasdaq Composite remained the only one of the "big four" indexes to hold above its average, which is relatively unusual.

It suggests either (or both) that investors still believe in tech's growth story or (and) that tech has had a bigger run than the other indexes.

Nasdaq only index above 200 day average

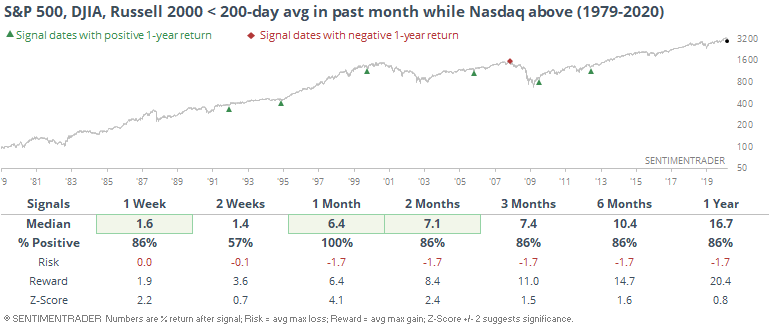
Each of the other times this happened, stocks rebounded over the next month. Among the other indexes, the Dow joined the S&P with a perfect record of bouncing back over the next month. The Russell lagged.


Maximum fear

Volatility expectations and other technical factors are part of the CNN Fear & Greed model. Our proxy of that model dropped to maximum pessimism on Friday with a reading of 0%. 

CNN Fear & Greed proxy model at 0%

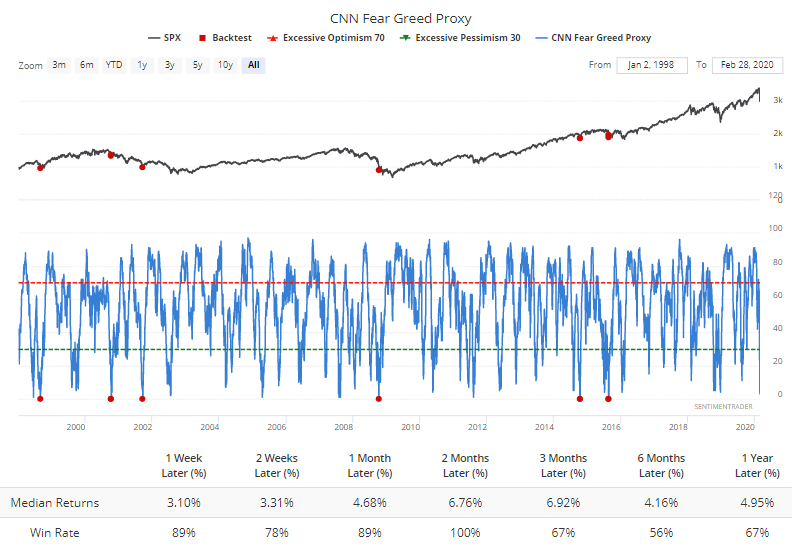
Our model doesn't exactly match the one on CNN's website since we use a slightly different input for the high-yield bond market. That allows us to generate much more history, and include it in our custom Backtest Engine for clients.

All the other times this model dropped to zero since 1998, stocks rallied over the next two months according to the Engine.

This is an abridged version of our recent reports and notes. For immediate access with no obligation, sign up for a 30-day free trial now.

We also looked at:

  • Quick corrections from all-time highs
  • What happens after 90% of stocks fall 10%
  • The S&P 500 cycled from a high to multi-month low
  • Seasonal selloffs
  • Corrections during election years
  • Worst breadth markets have ever seen (or close to it)
  • What happens after big spikes in 52-week lows
  • Biggest oversold readings in 60 years in McClellan Oscillator
  • Technical signal deterioration
  • Weeks when "everything gets sold"
  • The week in options trading
  • Volatility explosions
  • Wall Street panics
  • Volume and liquidity jumps
  • Massive fund outflows
  • Preying on fear
DATA &
TECHnologies
IndicatorEdge
‍
BackTestEdge
‍
Other Tools
‍
DataEdge API
RESEARCH
reports
Research Solution
‍
Reports Library
‍
actionable
Strategies
Trading Strategies
‍
Smart Stock Scanner
‍
FREE
RESOUrCES
Simple Backtest
Calculator
Simple Seasonality
Calculator
The Kelly Criterion
Calculator
Sentiment Geo Map
‍
Public Research Reports
‍
Free Webinar
COMPANY
‍
About
‍
Meet our Team
‍
In the News
‍
Testimonials
‍
Client Success Stories
Pricing
Bundle pricing
‍
Announcements
‍
FAQ
© 2024 Sundial Capital Research Inc. All rights reserved.
Setsail Marketing
TermsPrivacyAffiliate Program
Risk Disclosure: Futures and forex trading contains substantial risk and is not for every investor. An investor could potentially lose all or more than the initial investment. Risk capital is money that can be lost without jeopardizing ones’ financial security or life style. Only risk capital should be used for trading and only those with sufficient risk capital should consider trading. Past performance is not necessarily indicative of future results.

Hypothetical Performance Disclosure: Hypothetical performance results have many inherent limitations, some of which are described below. No representation is being made that any account will or is likely to achieve profits or losses similar to those shown; in fact, there are frequently sharp differences between hypothetical performance results and the actual results subsequently achieved by any particular trading program. One of the limitations of hypothetical performance results is that they are generally prepared with the benefit of hindsight. In addition, hypothetical trading does not involve financial risk, and no hypothetical trading record can completely account for the impact of financial risk of actual trading. for example, the ability to withstand losses or to adhere to a particular trading program in spite of trading losses are material points which can also adversely affect actual trading results. There are numerous other factors related to the markets in general or to the implementation of any specific trading program which cannot be fully accounted for in the preparation of hypothetical performance results and all which can adversely affect trading results.

Testimonial Disclosure: Testimonials appearing on this website may not be representative of other clients or customers and is not a guarantee of future performance or success.