
What 100+ Years of the Shiller P/E Ratio Tells Us

As we will highlight in a moment, the stock market is presently "overvalued." That simple statement has obvious negative implications; however, too many investors take the wrong lesson. So, let's start at the end with the following Summary:
Point 1: The stock market is presently "overvalued" on a historical basis.
Point 2: That the stock market is "overvalued" DOES NOT mean investors need to take drastic action immediately. Because the reality is that the stock market can (and, in fact, has been) overvalued for many years.
Point 3: The real lessons to take away are twofold:
- DO NOT get complacent - the more the market goes up, the more investors come to take it for granted that this will continue forever
- DO remain vigilant and be prepared to "play defense" when the economy shows clear signs of impending recession (more on this topic later)
THE STOCK MARKET IN THE LONG RUN
To understand these thoughts, let's look back at 100+ years of stock market history and highlight the important lessons that apply today. The chart below displays 100+ years of stock market history using the Dow Jones Industrial Average.
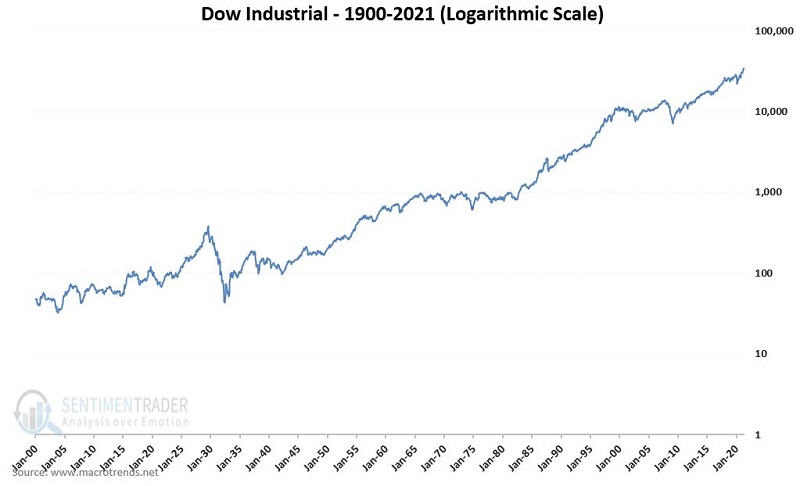
Based on this chart we can state three things:
- In the long run, the stock market goes up
- There are significant declines along the way
- The market can go sideways for long periods of time
BEWARE THE LONG-TERM TRADING RANGE
While the first point above is good news for investors - as it can afford them the opportunity to make their money grow - the second and third points can prove tremendous (if at this point, mostly forgotten) obstacles to long-term success.
We will talk about large declines in a moment. But for now, consider the following fact - the Dow went sideways for:
- 16 years from 1905 to 1921
- 25 years from 1929 to 1954
- 17 years from 1965 to 1982
- 13 years from 1999 to 2012
This means that the stock market was arguably "trading in a range" for 71 of the past 116 years.
Now ponder your answer to this question: If the stock market went sideways from now until 2034 (or 2038 or 2056), how will I make money?
Think that can't happen? Note these periods highlighted on the chart below.
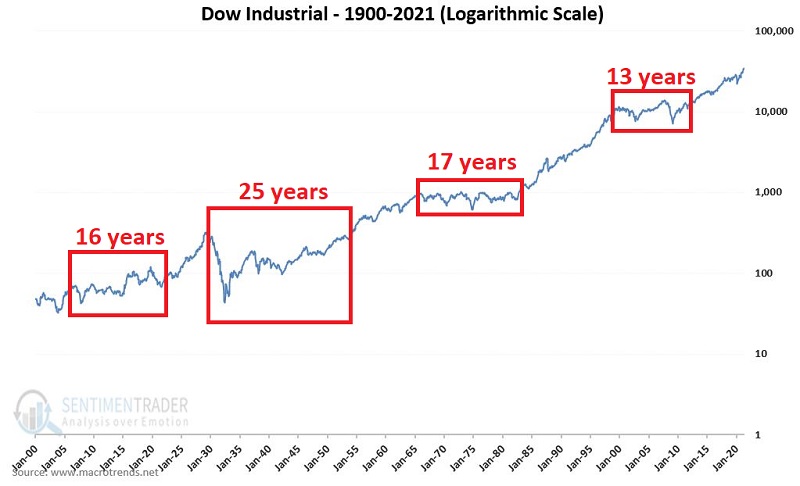
If nothing else, these long periods of no net price gain argue strongly against simply buying and holding an index fund, as the prospect of sitting in an investment for 13 years or more for no net gain is unacceptable.
Again:
- The point is NOT that you should "do something" right now
- The point is that you MUST remain prepared to act decisively when that is what the situation calls for
THE SHILLER P/E RATIO
The chart below displays the Shiller PE Ratio, which:
- Adjusts annual S&P 500 earnings by inflation
- Uses a 10-year average of earnings as the divisor
- Uses the S&P 500 Index as the numerator
The purpose is to give a sense of whether the market is overvalued, undervalued, or somewhere in between.
- High readings suggest the market is "overvalued"
- Low readings suggest the market is "undervalued"
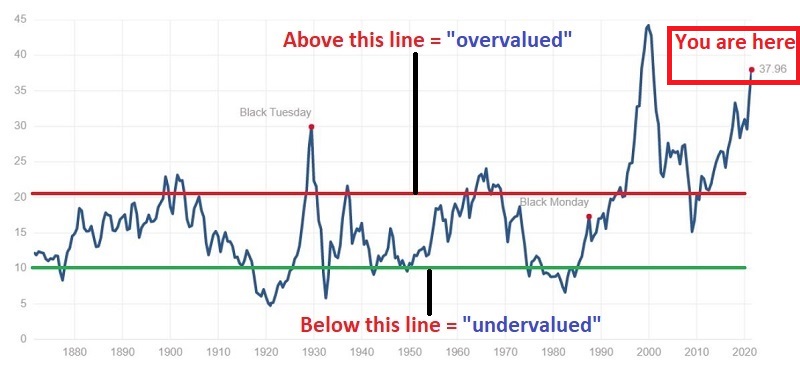
The most important thing to note is that the Shiller PE Ratio (or any valuation measure) is NOT a TIMING tool.
An undervalued reading is not an automatic "buy" signal, and an overvalued reading is not an automatic "sell" signal. Instead, the Shiller PE Ratio is a "perspective" indicator that suggests when overall risk is high or low in the stock market. The best way to think of it is this way:
- In the long run, the stock market mostly moves based on economic conditions
- A recession is an economic equivalent of jumping out of a window
- Valuation measures (such as the Shiller PE) tell you what floor you are on at the time
Crude but accurate.
In other words, if a recession occurs when the market is undervalued, the declines are typically not so severe. On the other hand, if a recession occurs when the market is overvalued, the declines can be near-catastrophic to investors' short-term - and possibly - long-term investment goals.
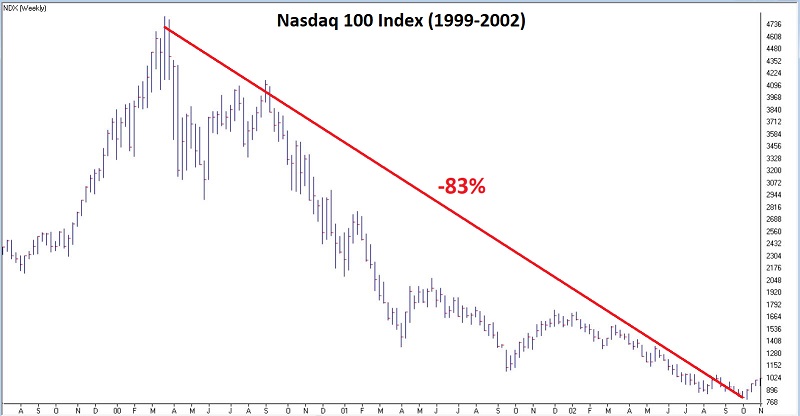
The chart displays the Shiller PE Ratio with the percentage decline suffered by the Dow during several bear markets that started when the Shiller PE Ratio was considered overvalued.
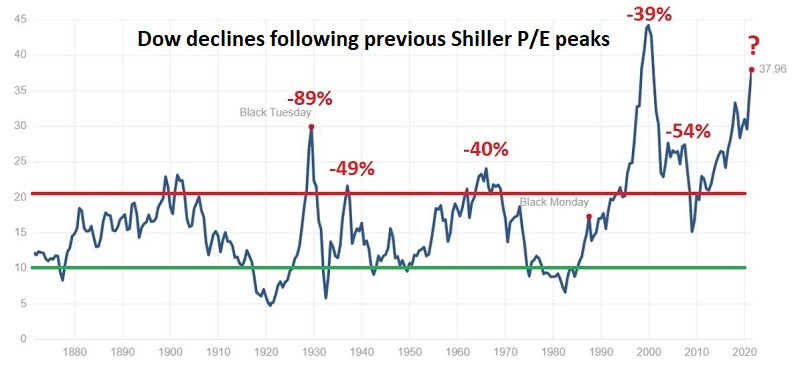
If you look at the highest peak (early 2000), while the Dow lost -39% peak-to-valley, the Nasdaq 100 Index (where most of the true overvaluation existed - think "Dot Com stocks") lost a staggering -83% peak-to-valley over the next 2+ years. The chart below is courtesy of AIQ TradingExpert.
As you can see in the charts above:
- The bear markets highlighted were quite painful and often devastating to investor's wealth
- The stock market should presently be considered "overvalued"
The current Shiller P/E of roughly 38 is the second-highest reading ever (second only to the 1999-2000 peak). Once again, the fact that the market is overvalued on a long-term valuation basis is not necessarily a call to action. It simply alerts us to the potential that the next bear market - whenever it may come - will likely be "one of the painful kind" and that some sort of defensive action will ultimately be wise.
Consider the 3 highest peaks:
- 1929 - Dow declined -89% in the next 3 years
- 2000 - Nasdaq 100 decline -83% in the next 2 years
- 2021(?) - Who knows?
WHEN WILL OVERVALUATION MATTER?
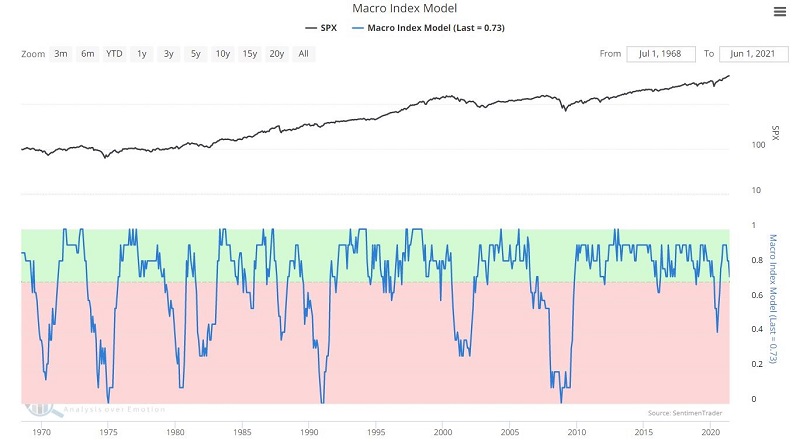
As discussed above, the primary catalyst for a bear market is when the stock market gets a whiff of an impending economic downturn. How can investors stay alert to the possibility of such a downturn? A simple approach is to monitor the Sentimentrader Macro Index Model, which tracks 11 different economic-sensitive indicators.
In the chart below, a drop into the red portion (i.e., below 70%) signals the potential for an economic recession. This is especially significant when the Shiller P/E Ratio tells us that the stock market is overvalued - as it most definitely is today.
SUMMARY
As I stated at the outset, the current high reading for the Shiller P/E is NOT a "call to action." It is more of a "call to pay close attention."
There are always "things" to be concerned about that may upset the apple cart. Yet despite all of the present-day chatter by pundits trying to be the first one to "call" the next recession, the reality is that our objective Macro Index Model remains favorable regarding the U.S. economy, the major market averages are at or near all-time highs, and it is exceedingly easy to dismiss all warning signs.
Nevertheless, the problem is that because valuation levels are presently high, the overall downside risk is presently elevated. While the bull market could easily continue to push higher for some length of time, the point is that you should:
- Avoid the urge to get complacent
- Remind yourself that the market can (and does and will again) move sideways for long periods of time, and that sharp declines almost invariably follow high valuation readings
- Consider strategies that can allow you to profit even if a bear market and/or a long period of low overall returns unfolds