Data &
Technology
Research
Reports
Report Solutions
Reports Library
Actionable
Strategies
Free
Resources
Simple Backtest Calculator
Simple Seasonality Calculator
The Kelly Criterion Calculator
Sentiment Geo Map
Public Research Reports
Free Webinar
Pricing
Company
About
Meet Our Team
In the News
Testimonials
Client Success Stories
Contact
Log inLoginSign up
< BACK TO ALL REPORTS

We're in the Enthusiasm phase of a typical sentiment cycle

Jason Goepfert
2021-01-25
There is currently a high correlation to the Enthusiasm phase of a typical sentiment cycle.

The biggest challenge with this market is the conflict between an impressive recovery from a historic selloff, superimposed against a backdrop of record levels of speculative activity.

Recoveries from a bear market typically take much longer. By the time they've recovered and been at new highs for a while, speculation comes in, markets plateau, divergences form, and sentiment cycles back down during a correction.

If we look at a typical Sentiment Cycle, then we basically went from enthusiasm to panic and right back to enthusiasm, all in record time.

Typical sentiment cycle

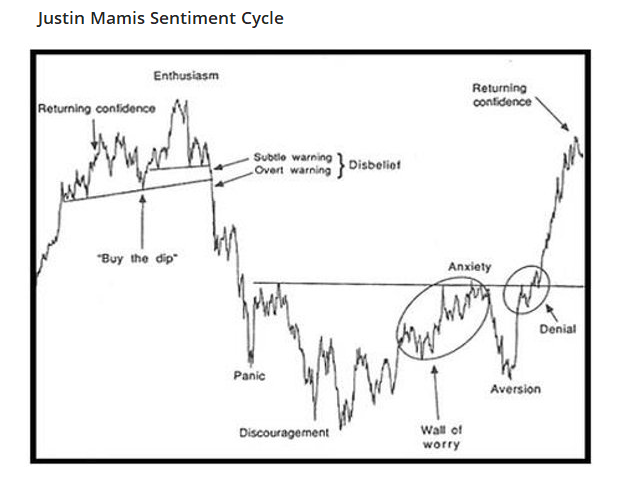
There is little arguing that we're in this part of the cycle. Our Knowledge Base article, "How do I use sentiment?" points out a number of factors typically seen during Enthusiasm. All boxes are checked now.

More objectively, when we look at the correlation between the S&P 500's price path lately versus the Enthusiasm phase of past cycles, there is a high positive correlation.

Sentiment cycle correlation

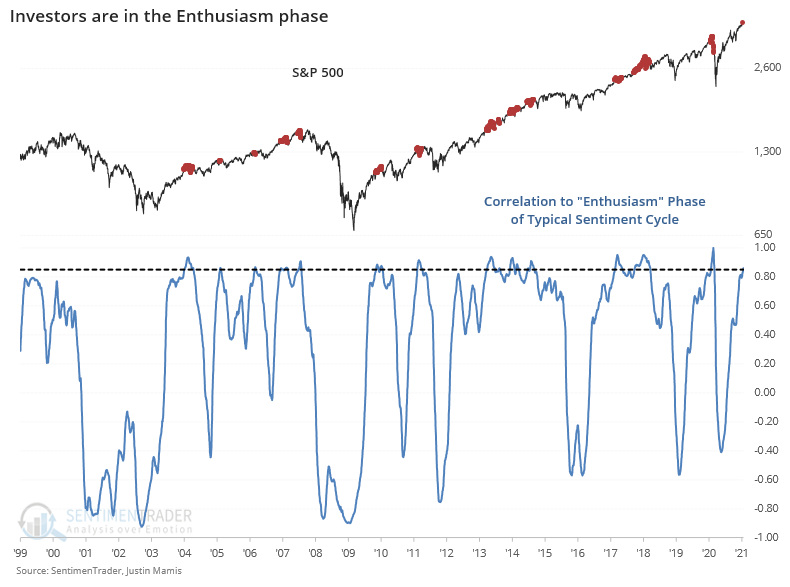
So, investor behavior is like we see near the end, but markets are showing the signs we typically see during the beginning stages of a long-term recovery with thrusts in breadth and the percentage of securities hitting 52-week highs. It's very strange.


What else we're looking at

  • More and more, we're seeing the beginning signs of internal divergences
  • Indexes are rising with fewer internal uptrends
  • Investment-grade bonds have seen some pretty heavy selling pressure
  • What happens when there is relatively high put open interest in a major index
  • The Nasdaq is still in the "sweet spot" following a long-term technical pattern

Stat Box

Smart-money commercial hedgers have been net long the major equity indexes since March. But last week they moved to a $22 billion net short position, the 5th-largest in a year.


Sentiment from other perspectives

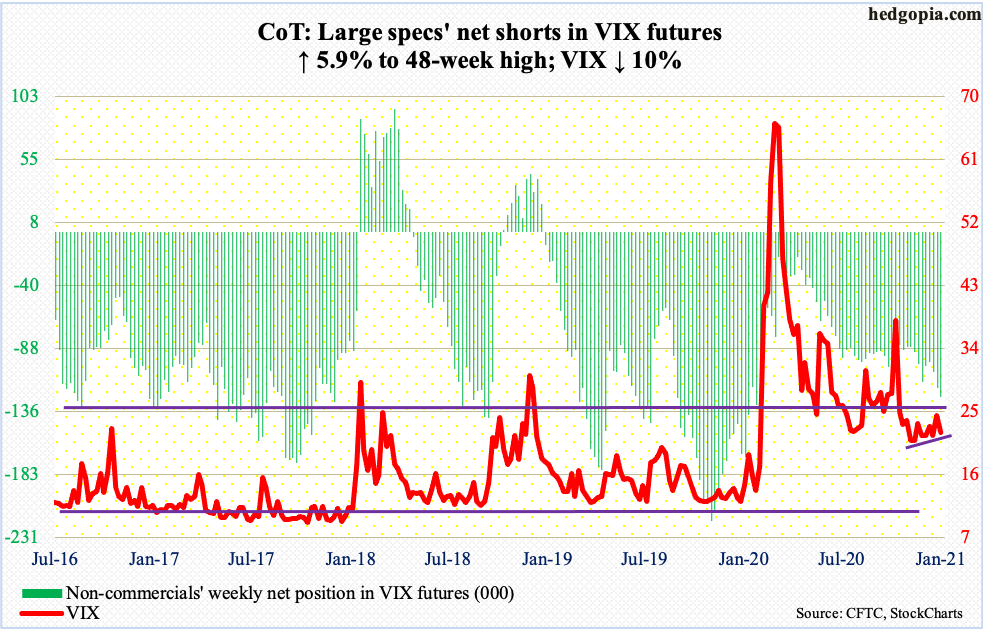
Speculators are starting to think that stocks will keep going up, and volatility will keep going down. They're now holding a relatively large short position against VIX "fear gauge" futures. Source: Hedgopia

speculators in vix futures

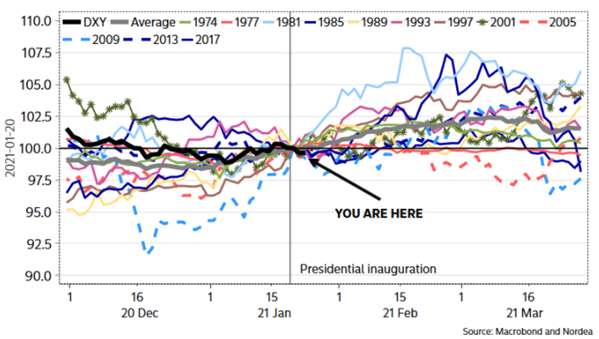
That may be an issue if the recent correlation between the dollar and stocks keeps up. The buck tends to rise after the U.S. elects a new president. Source: Macrobond

dollar dxy following presidential election

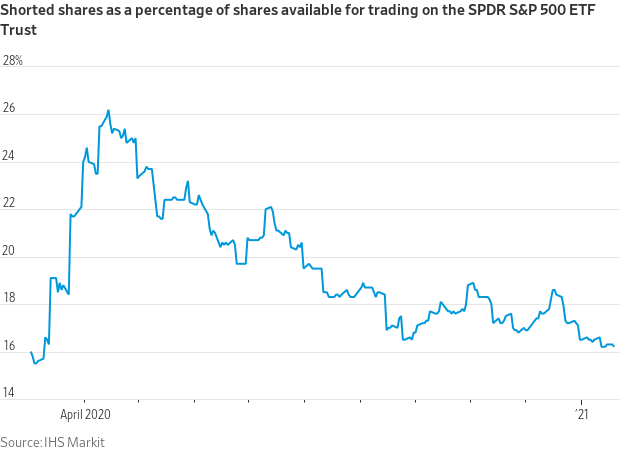
With investors heavily skewing toward an optimistic outlook, there's no benefit in being short, so they've covered their bets against stocks by a large degree. Source: Wall Street Journal

spy short interest

DATA &
TECHnologies
IndicatorEdge
‍
BackTestEdge
‍
Other Tools
‍
DataEdge API
RESEARCH
reports
Research Solution
‍
Reports Library
‍
actionable
Strategies
Trading Strategies
‍
Smart Stock Scanner
‍
FREE
RESOUrCES
Simple Backtest
Calculator
Simple Seasonality
Calculator
The Kelly Criterion
Calculator
Sentiment Geo Map
‍
Public Research Reports
‍
Free Webinar
COMPANY
‍
About
‍
Meet our Team
‍
In the News
‍
Testimonials
‍
Client Success Stories
Pricing
Bundle pricing
‍
Announcements
‍
FAQ
© 2024 Sundial Capital Research Inc. All rights reserved.
Setsail Marketing
TermsPrivacyAffiliate Program
Risk Disclosure: Futures and forex trading contains substantial risk and is not for every investor. An investor could potentially lose all or more than the initial investment. Risk capital is money that can be lost without jeopardizing ones’ financial security or life style. Only risk capital should be used for trading and only those with sufficient risk capital should consider trading. Past performance is not necessarily indicative of future results.

Hypothetical Performance Disclosure: Hypothetical performance results have many inherent limitations, some of which are described below. No representation is being made that any account will or is likely to achieve profits or losses similar to those shown; in fact, there are frequently sharp differences between hypothetical performance results and the actual results subsequently achieved by any particular trading program. One of the limitations of hypothetical performance results is that they are generally prepared with the benefit of hindsight. In addition, hypothetical trading does not involve financial risk, and no hypothetical trading record can completely account for the impact of financial risk of actual trading. for example, the ability to withstand losses or to adhere to a particular trading program in spite of trading losses are material points which can also adversely affect actual trading results. There are numerous other factors related to the markets in general or to the implementation of any specific trading program which cannot be fully accounted for in the preparation of hypothetical performance results and all which can adversely affect trading results.

Testimonial Disclosure: Testimonials appearing on this website may not be representative of other clients or customers and is not a guarantee of future performance or success.