TradingEdge: Mixed sentiment during the continued recovery, with divergent sector momentum


This is a recap of the most notable research published during the week. If there is a piece of research that hadn't been published by Friday, you'll see a [NEW] tag.
Recovery pattern as sentiment shows mixed behavior
For the week ended April 17, the smallest of options traders appeared to get a lot more optimistic than they'd been in weeks. After paring down their speculative call buying in March, they ramped it back up again, spending more than 42% of their total volume on buying call options to open. That's among the most in years. It didn't change much at all last week.
A more comprehensive look at options trader behavior, the Options Speculation Index, shows a jump in speculative activity, but not to the extremes seen over the past few years. It barely ticked lower last week.
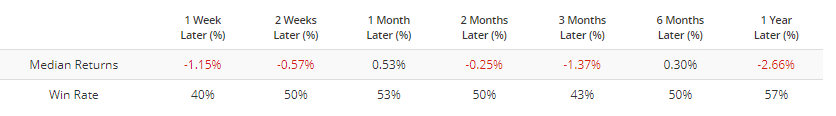
The Backtest Engine shows that when traders spent at least 20% more volume on bullish strategies than bearish ones, the S&P 500 typically rose in the weeks and months ahead, but returns weren't great, with a negative median up to three months later.
As far as rallies from a low, the past few weeks have been epic. It's been well-documented that stocks have enjoyed one of the best-ever stretches over the past couple of weeks, pushing the S&P 500 nearly 30% off its 52-week low.
If we go back to 1928 and look at every time the S&P managed to rally for this long off of a low, we can get a sense of how it performed afterward, depending on whether the rally ended up being a success or failure.
Even if March ends up being a major, successful low, the next couple of months would likely mean a lot of choppy price action.

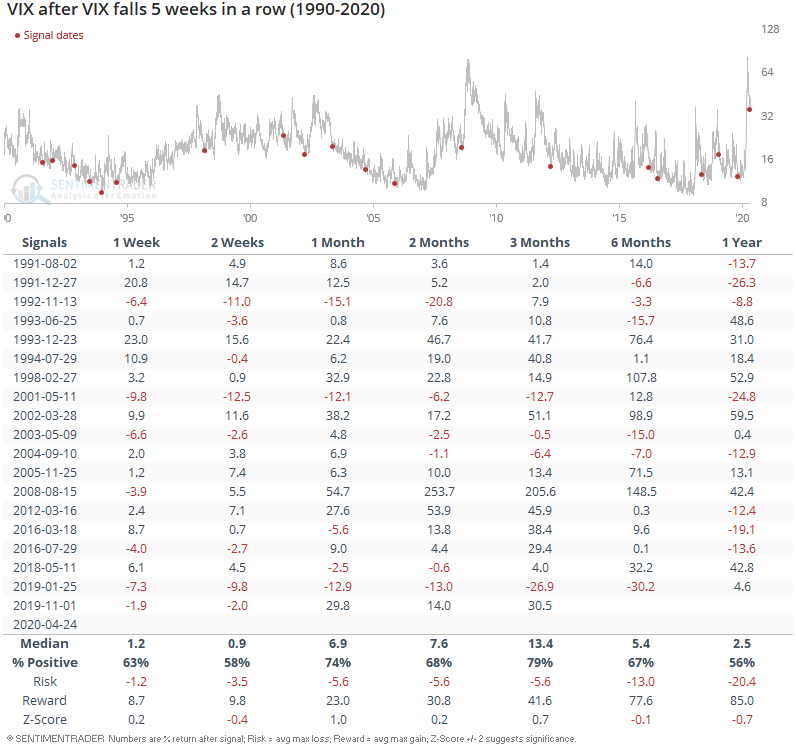
[NEW] Troy notes that the VIX continues to fall and is now down 5 weeks in a row:
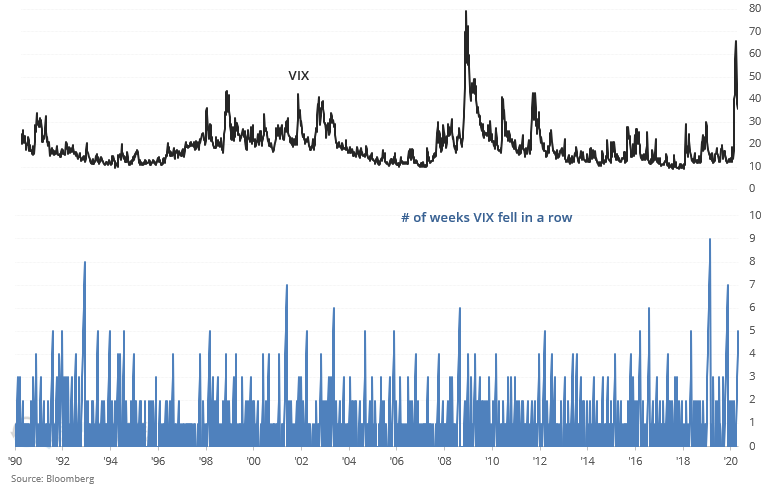
When this happened in the past, VIX could jump in the short term (over the next month), particularly if this came after a recent VIX spike:
[NEW] Troy notes that investors and traders are rushing headlong towards tech stocks, which have done relatively well during the global coronavirus lockdown. QQQ Optix's 20-day average is at a multi-year high. The last time optimism was this high was in January 2018, just before stocks crashed after a long period of calm markets:
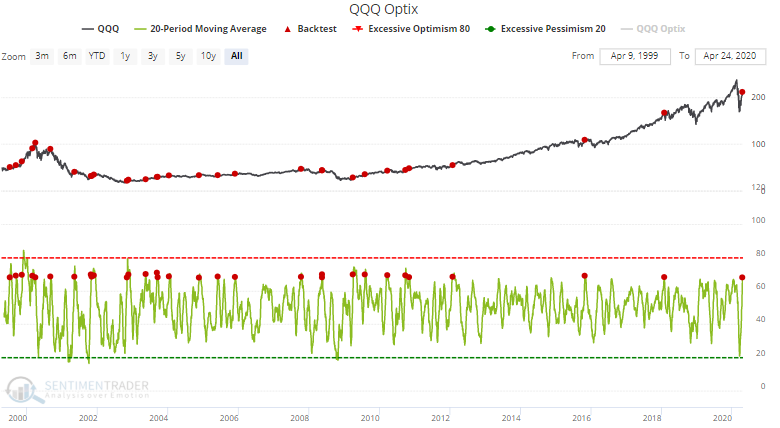
Overall, this led to worse than average returns for QQQ on almost every time frame.
In the meantime, SPY Liquidity Premium has fallen to the lowest level in years. Stock picking is popular again, which is not surprising given the gains that some early investors have experienced with tech stocks.
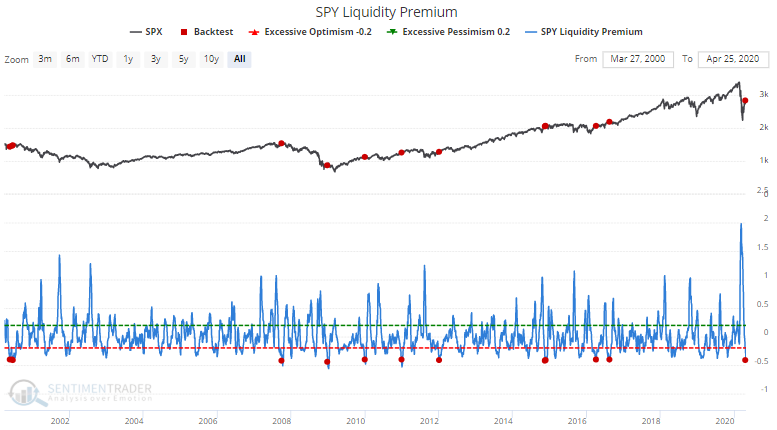
Once again, this led to worse than average returns for SPY on almost all time frames:
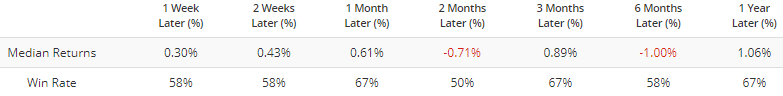
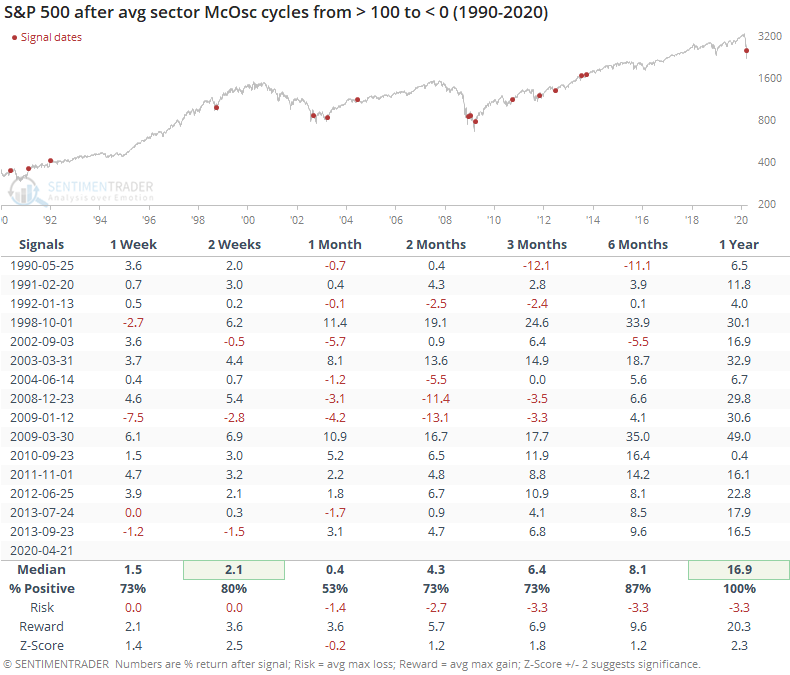
Despite steady prices and a modest drop in the VIX, underlying momentum briefly turned negative (barely), but after a surge like we'd seen, that has not been much of a negative.
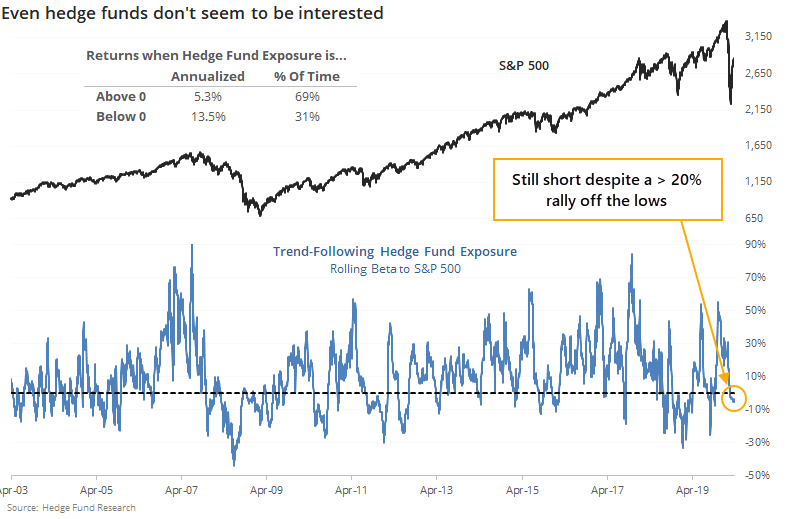
Even with the rally, trend-following hedge funds appear to remain net short the S&P 500.
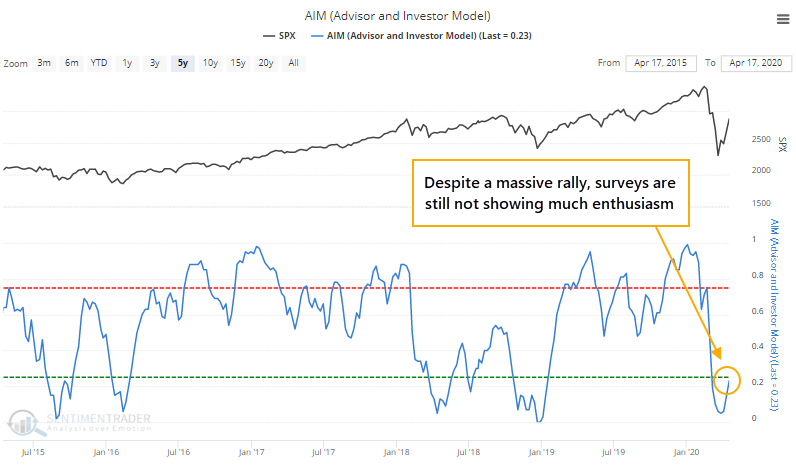
And investor surveys are showing continued pessimism. Both of these are modest positives based on how markets reacted after similar behavior.
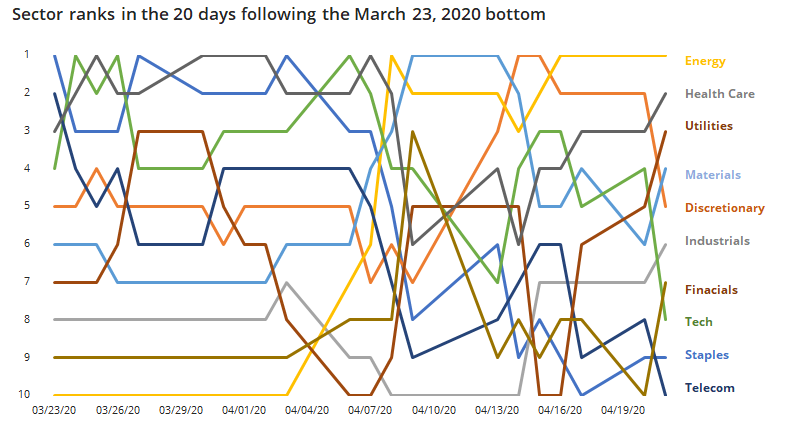
Even so, the "right" sectors haven't been leading this rally, which is a worry.
The mostly apathetic sentiment and curious sector leadership seem to be weighing on others, as well.
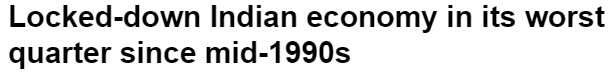
[NEW] Troy notes that financial media is full of negative economic data stories. Comparisons to "XYZ economic indicator is the worst since 2008/1930s/Great Depression" are rampant. For example:


As a result, the # of media stories (weekly) mentioning the "Great Depression" hit an all-time high a week ago. The last time this happened was in January 2009, when stocks fell more over the next 2 months before hitting a long term bottom:
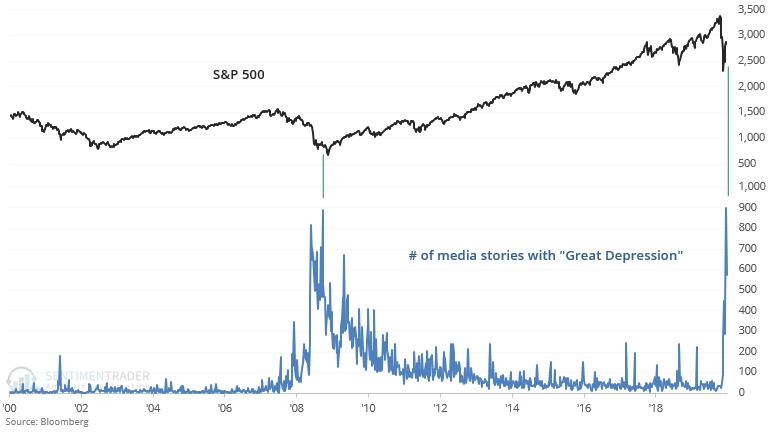
It's hard to draw a strong conclusion from n=1, and as I've said repeatedly, this recession is so different from historical recessions that economic comparisons aren't particularly useful.
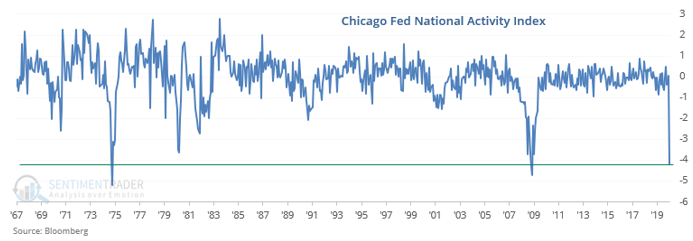
Those articles mentioning depression-era possibilities are a reflection of some of the economic data released lately. The Chicago Fed National Activity Index, which looks at 85 monthly economic indicators to get a sense of how well the economy is doing right now, is extremely low:
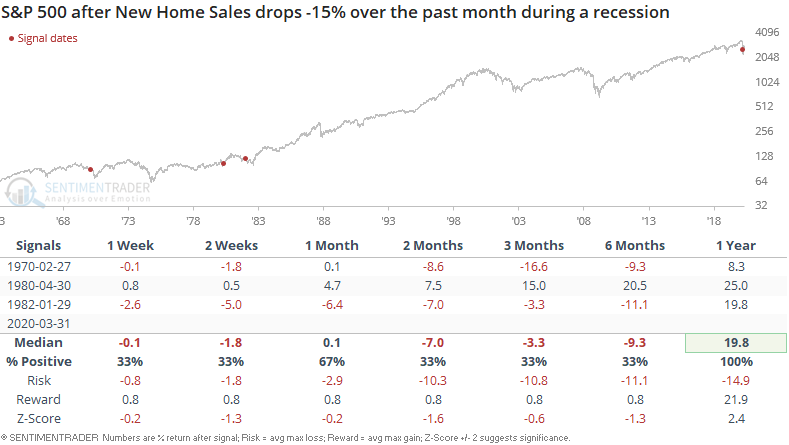
[NEW] Like many other economic indicators, New Home Sales sank over the past month by more than -15%:
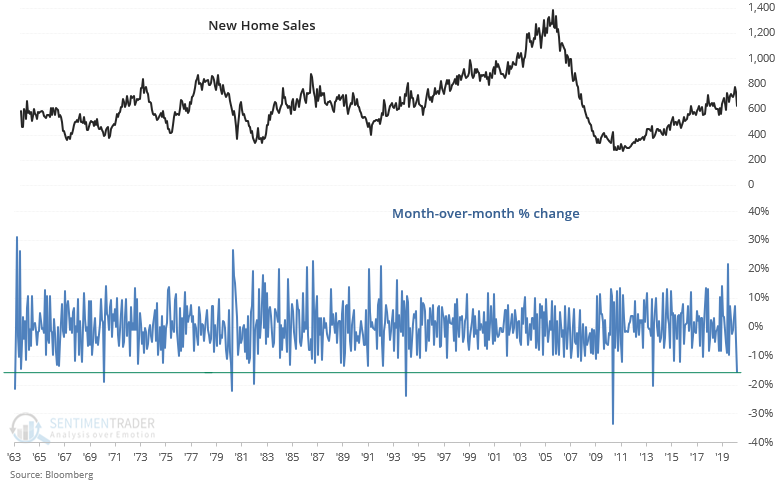
For what it's worth, large 1-month declines in New Home Sales often happened within bear markets & recessions. As a result, short/medium term forward returns were not bullish, but 1 year forward returns were mostly bullish:
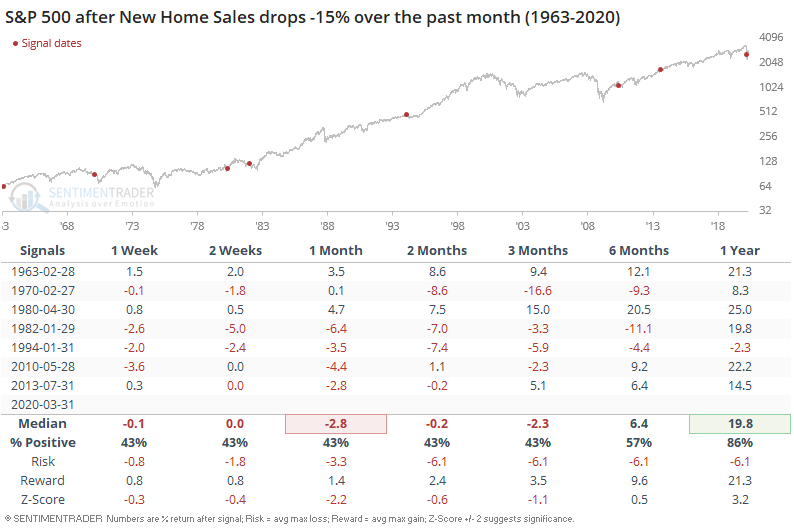
The single bearish case over the next year happened during an economic expansion (1994 bond market crisis, when rates jumped). So if we only look at historical cases which occurred during a recession:
Tech rallies, oil falls
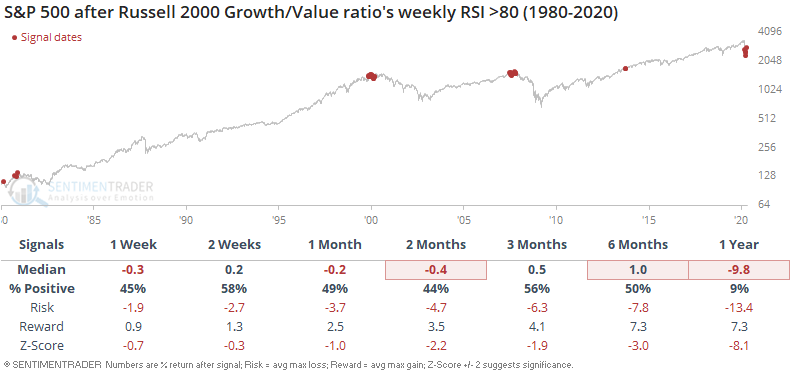
Tech and growth stocks continued to perform well. Growth stocks have become extremely overbought relative to value.
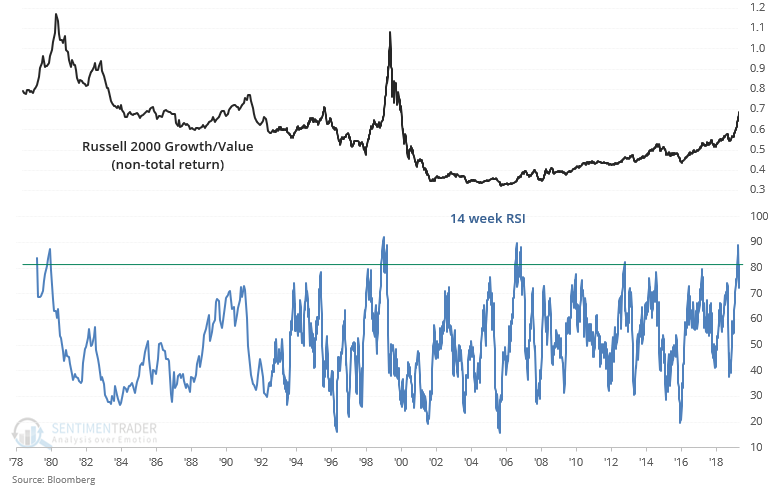
That hasn't been a great sign in the past.
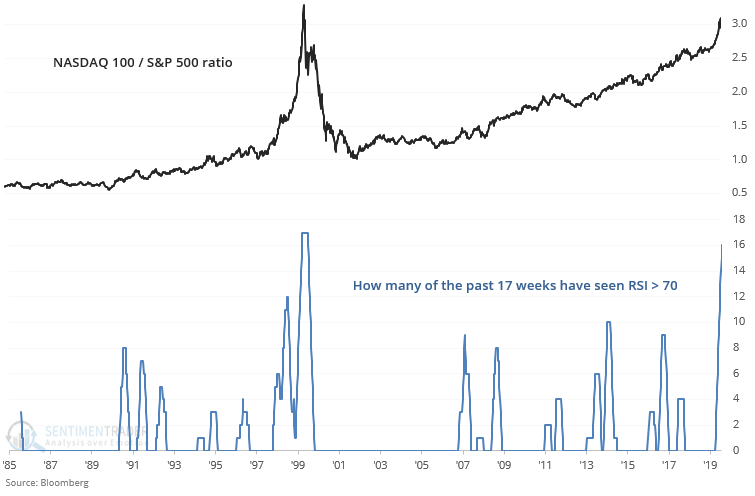
The only time that big tech stocks outperformed the broader S&P 500 by this many weeks was in late 1999.
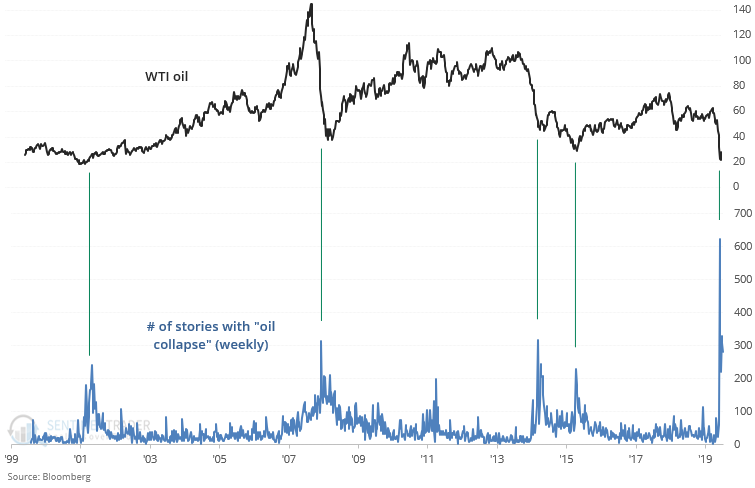
The moves in oil were astounding, with media obsessed about the drop below zero amid historic volatility.
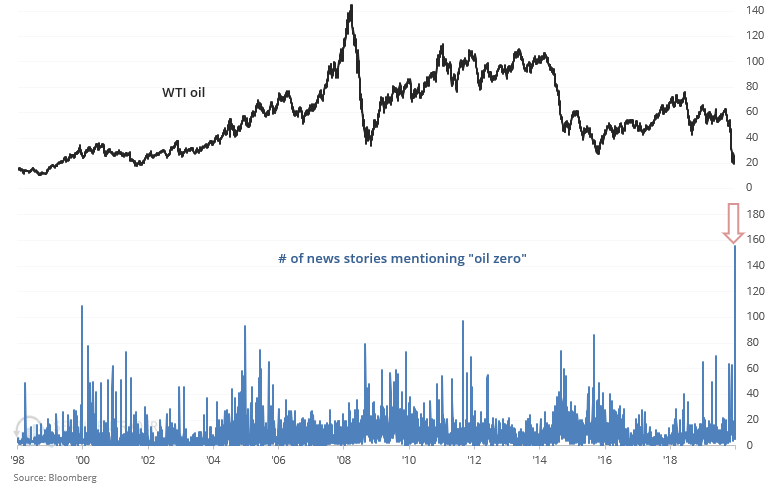
News stories containing the words "oil collapse" hit a record.
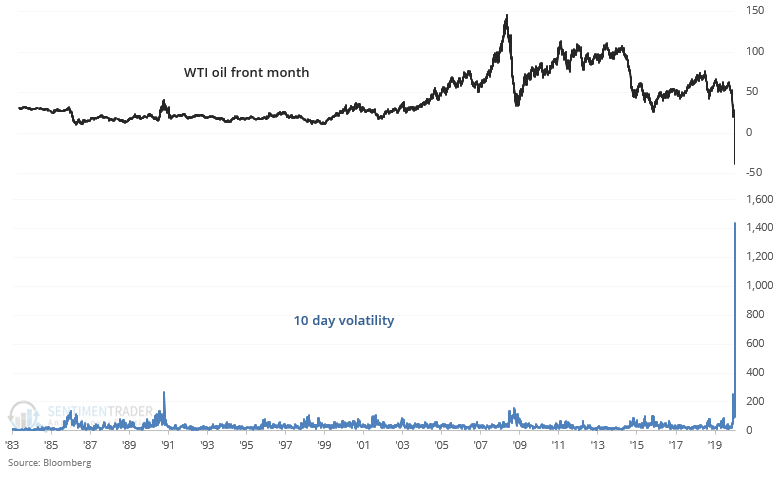
And volatility spiked to record levels.
That triggered a number of adverse actions like reverse splits and delistings in exchange-traded products.
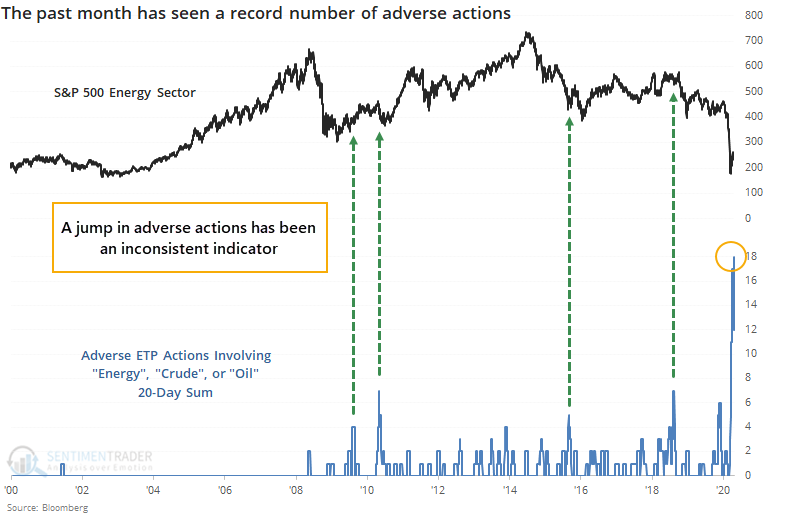
Whether it's enough for a major low in oil or energy stocks isn't clear. Probability would suggest it is, the problem is that the market has suffered a number of unprecedented actions in the past 6 weeks, starting with a failure to rally in late February after a massive surge in new lows among energy stocks, and continuing this week with negative oil prices. The types of readings we've seen over the past two weeks, combined with media hyper-focused on the media, are the kinds of things normally witnessed at turning points. A lower low in the coming weeks would obviously shatter that idea.
While oil struggled, a beneficiary was gold and gold mining stocks, which soared.
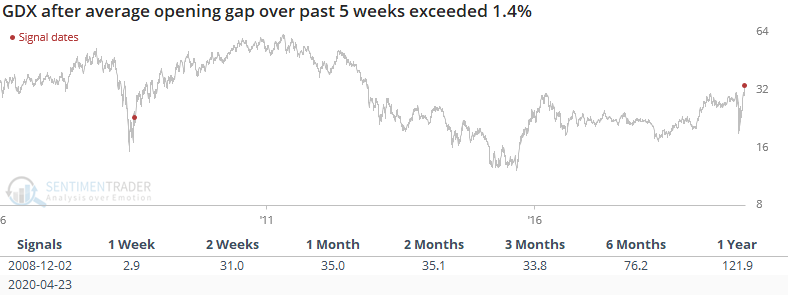
[NEW] Troy notes that contrary to popular beliefs regarding "safe haven", precious metals didn't do well during the stock market's crash in March. But with governments doing everything they can to support the economy, the "government printing money" narrative is pushing gold sentiment higher. Rising precious metals prices have pushed up gold miners, which gapped up each day by an average of almost 1.5% over the past 5 weeks!
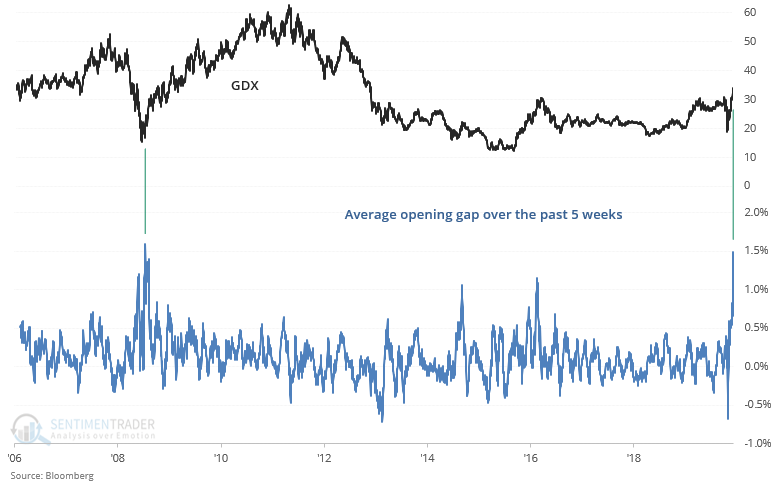
The only other historical case in which gold miners experienced such strong upwards momentum occurred in December 2008 when the 2008 precious metals bear market ended. Gold miners surged over the next year: