
TradingEdge: Historic plunge, compressed stimulus, and massive buying thrusts

This is a recap of the most notable research published during the week. As a reminder, please see this post about choosing your email preferences and ways to see only the research most appropriate to you as it's published.
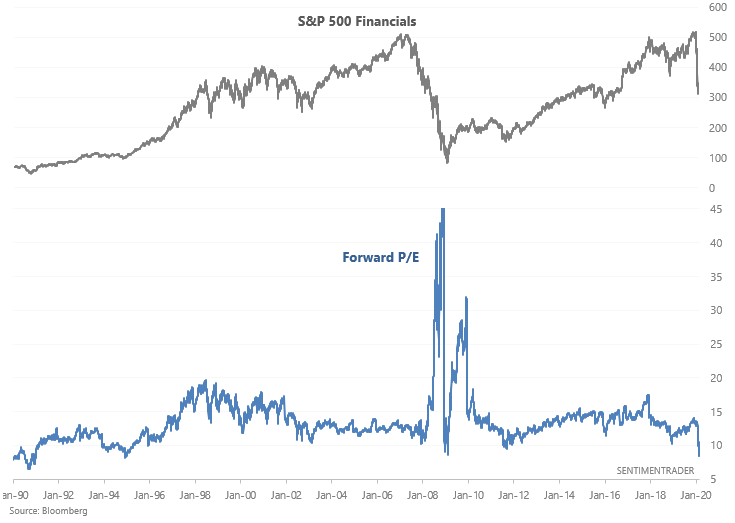
We started off the week with a renewed plunge in shares. While earnings estimates are only now starting to come down, it at least temporarily created what looks like value in many sectors, like financials.
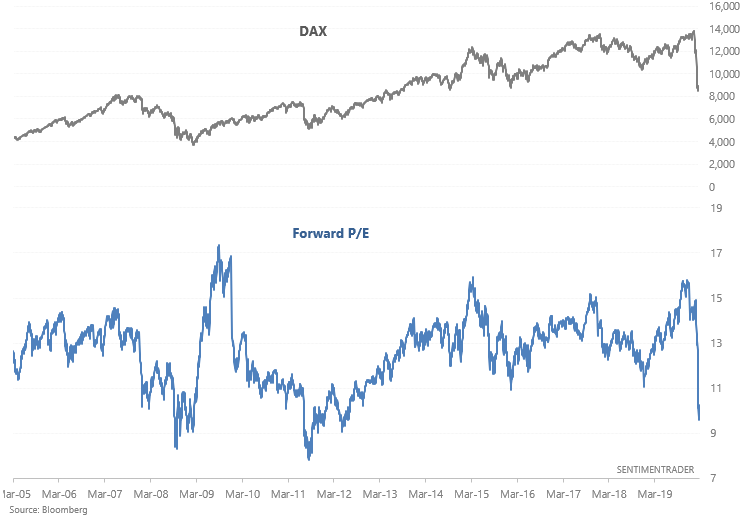
Many overseas markets were also showing some of the lowest values in decades.
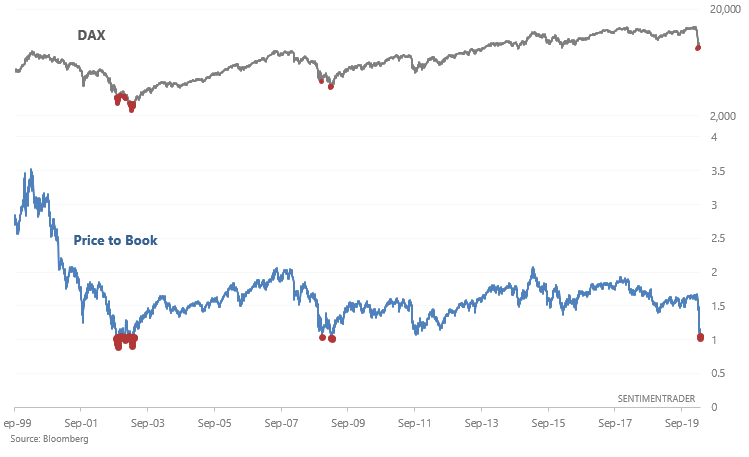
There are also values using other metrics, like price to book.
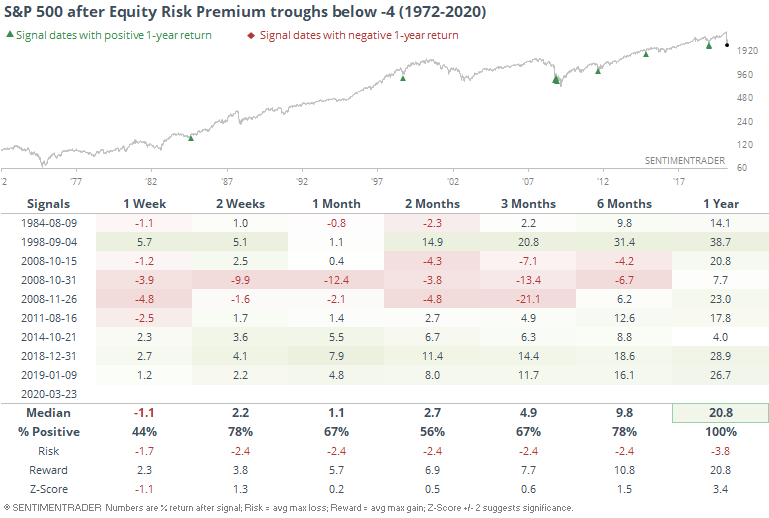
In the broader U.S. market, this pushed the Equity Risk Premium to the most extreme value in history, which has preceded gains over the longer-term.
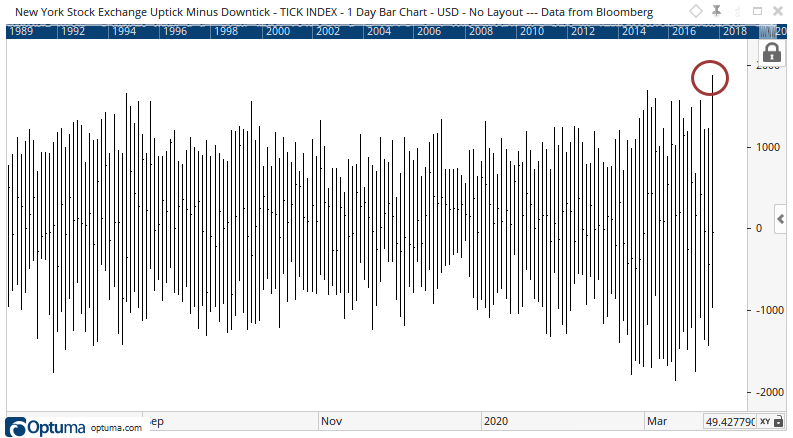
Thanks in part to an unprecedented set of fiscal and monetary stimulus measures, which have been introduced on a much more compressed time frame than during the financial crisis, there was a sudden shift in sentiment, leading to a historic surge in buying pressure by Tuesday morning, with a record high reading in the TICK.
The swings triggered some of the highest volatility readings and volume surges in history, in the U.S. and abroad.
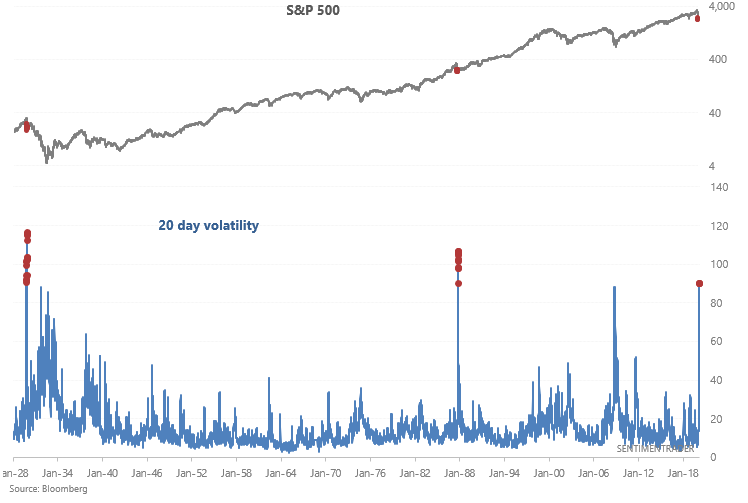
All the other days with such high volatility triggered in 1928 and 1987, but they still preceded gains in stocks over the next 6 months at least.
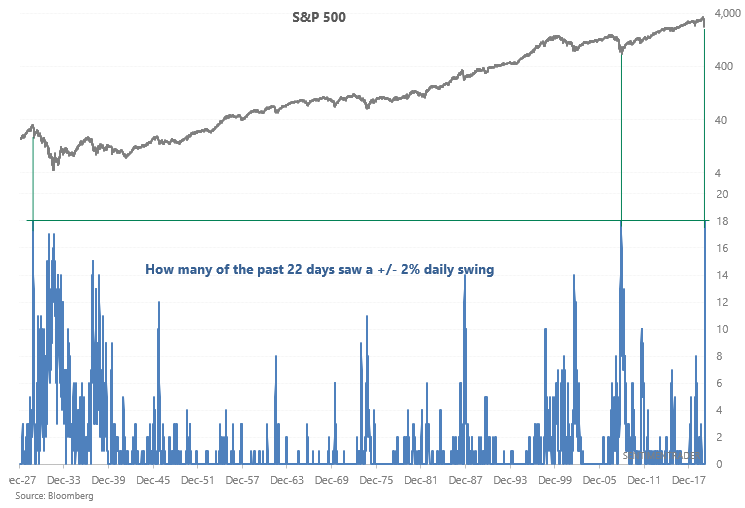
The changes have been so massive that historical comparisons are few. Only two other times in history have seen so many 2% swings.
The quick flip from selling to buying pressure showed signs of a surge and allowed stocks to move from a low to the highest level in days, erasing a week's worth of losses.
As more sentiment indicators showed capitulation, or close to it, buyers started coming back - in force. By Wednesday, stocks enjoyed back-to-back days with heavily skewed Up Volume. This has been massively important in the past.
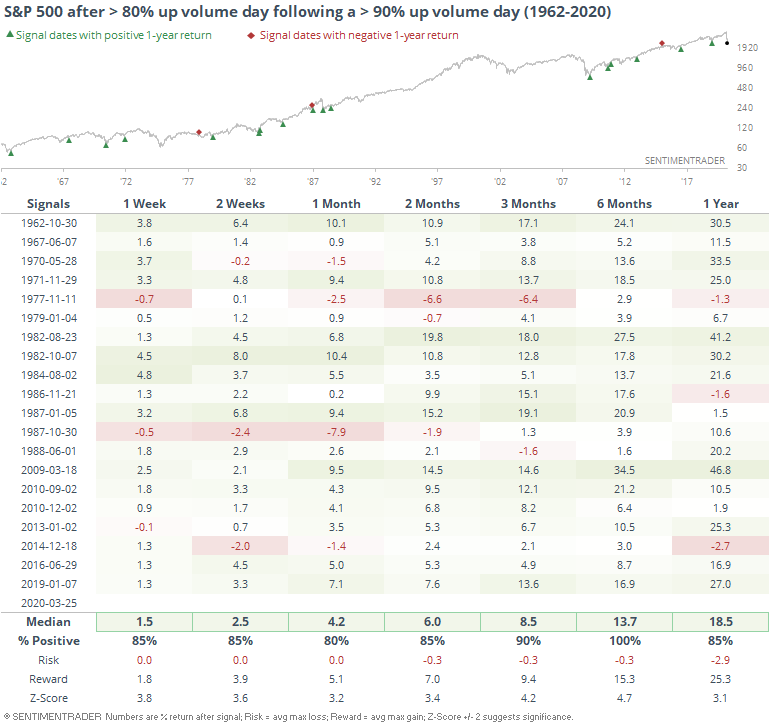
That was impressive, and it added to its historic implications by repeating the feat on Thursday.
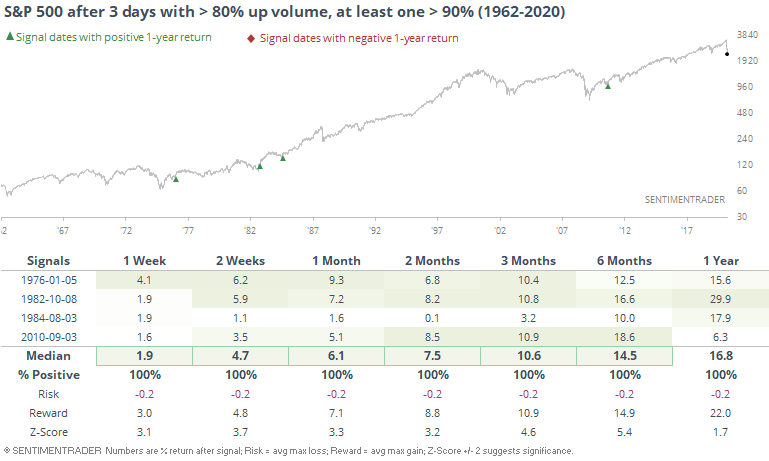
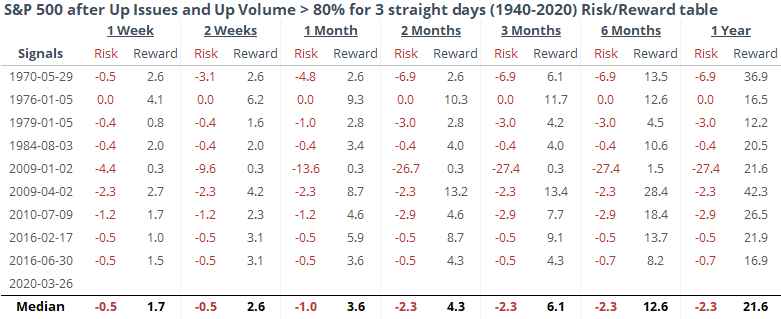
When we've seen 3 days in a row with exceptionally positive Up Issues and Up Volume, risk over the coming months has been minimal, with only one exception.
We've all heard of the common trope about big up days only occurring during bear markets. Ergo, we're in a bear market and doomed to roll over. It is certainly true that volatility is higher in bear markets, and so we see more big up days and big down days. But what those numbers don't tell us is how much of the decline was erased by those big up days. And that has a big impact on sentiment.
During other crashes, stocks weren't able to erase much more than about 30% of the decline before rolling over. Like in 1929.
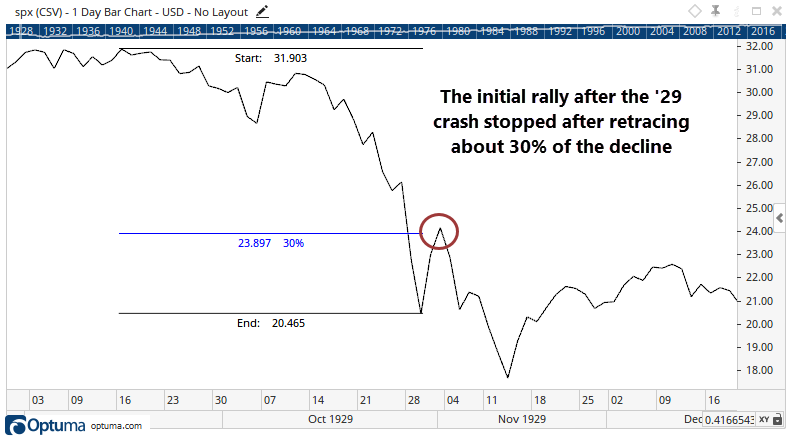
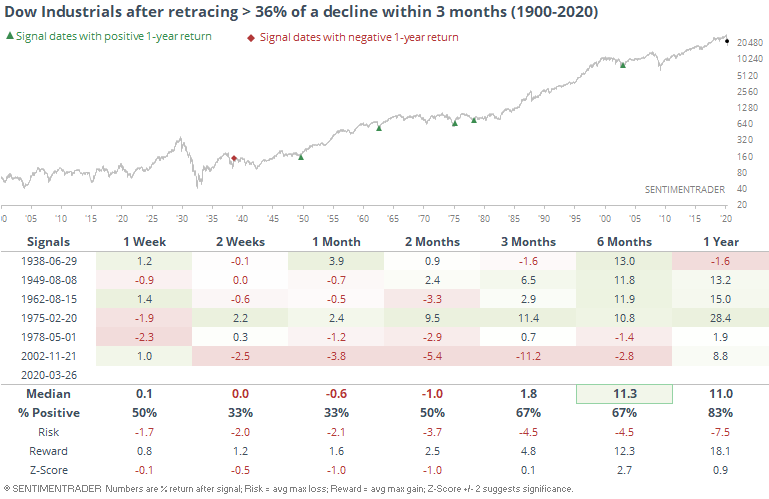
We've already exceeded that now, and in record time. No other time in the history of the S&P 500 (dating back to 1928) or the Dow Industrials (dating back to 1900) have the indexes managed to claw back as much of an important decline in so few sessions as they did this time.
That's the biggest knock against the idea that this is just another bear market rally. It could be, but it seems like the retracement we've seen is more notable than just the simple idea that we've rallied x% - it's the retracement that matters, not the price change.
For the Dow, this was one of the few times it retraced so much of a decline from multi-year high to multi-year low within 3 months.
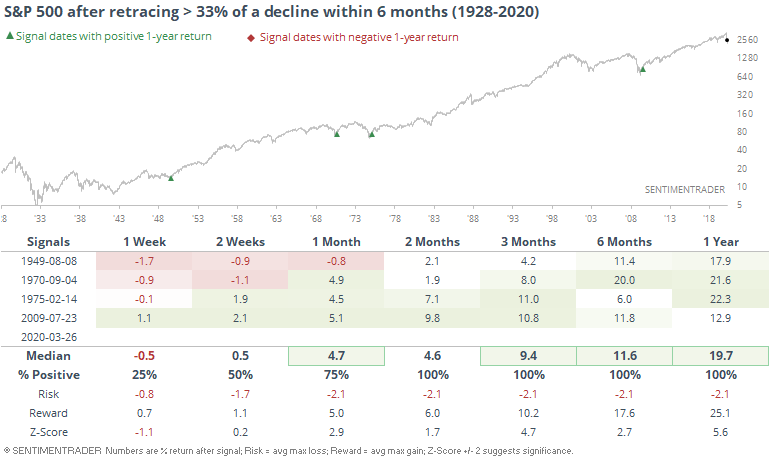
Same goes for the S&P. There were no precedents, so we had to extend the time frame for this large of a retracement to six months.
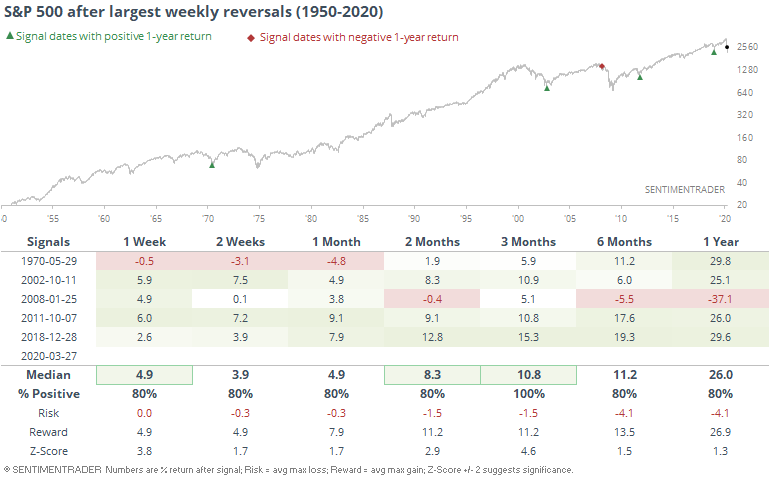
Even with some give-back on Friday, stocks still posted an impressive key weekly reversal. Those proved to be fake-outs in the 1930s, but recent decades have seen more consistent follow-through.
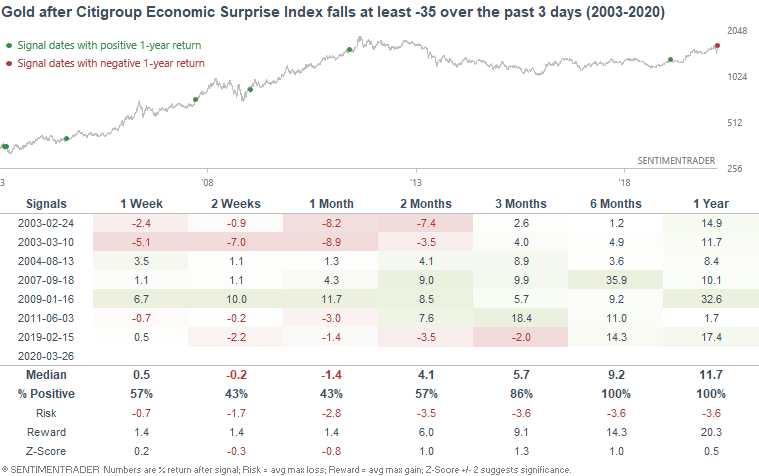
The plunge in markets wasn't just confined to stocks, and it's starting to show with sharp declines in confidence and some economic measures. Economic surprises have, of course, been to the downside, which has been a boon for assets like gold.
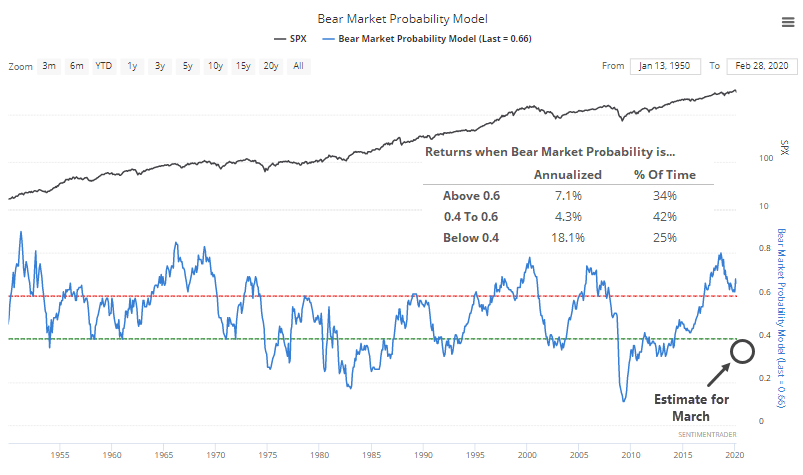
If the estimates for some of these economic indicators come to pass, then it will push models like Goldman's Bear Market Probability to a very low level.
In many respects, we've suffered the fastest, most severe decline in history. Then we enjoyed the most severe snap-back retracement rally in history.
There are some comparisons to other bear market rallies, but this one has been so impressive in terms of the amount of losses it clawed back, and most importantly the buying pressure behind it, that it seems more likely to succeed than fail. Other times these kick-off rallies succeeded, they didn't give back much of the gains, so the next week will be a very good test.