
TradingEdge for Sep 10 - Breadth Thrust; Poor Macro; Dollar Decision

The goal of the Weekly Wrap is to summarize our recent research. Some of it includes premium content (underlined links), but we're highlighting the key focus of the research for all. Sometimes there is a lot to digest, with this summary meant to highlight the highest conviction ideas we discussed. Tags will show any symbols and time frames related to the research.
| STOCKS | ||
 |  |  |
Stocks traded on the NYSE decided to make a fool out of those worried about weak breadth. Last week, the Nasdaq joined the party.
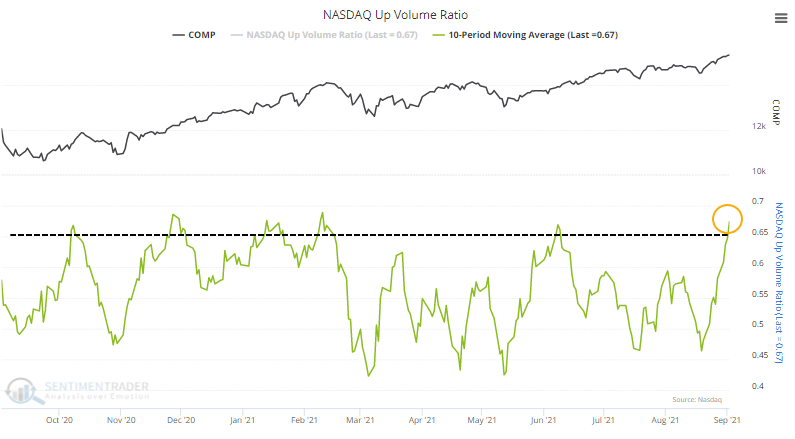
After weeks of disturbingly poor internal participation, and a flurry of technical warning signs, stocks on the Nasdaq thrusted higher last week. Over the past 10 days, an average of more than 60% of securities on the Nasdaq advanced. Even more impressively, more than 65% of volume flowed into advancing issues on average each day.
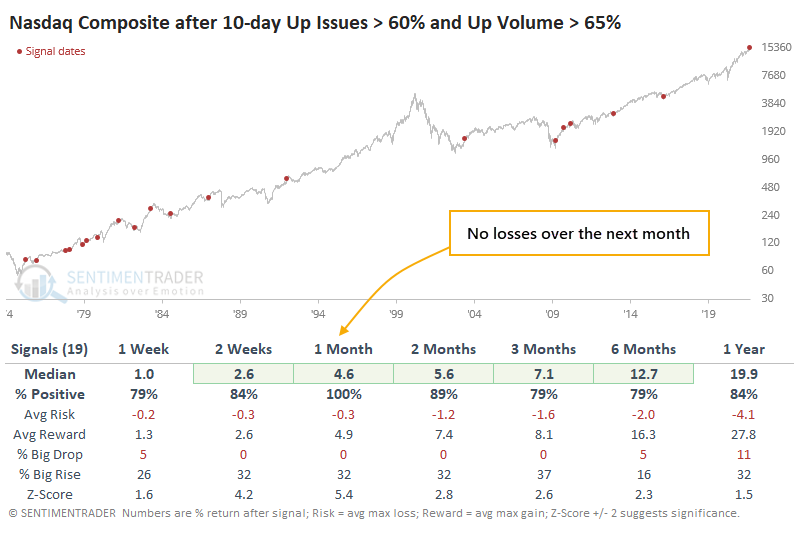
Thrusts like this have been exceptionally positive for forward returns.
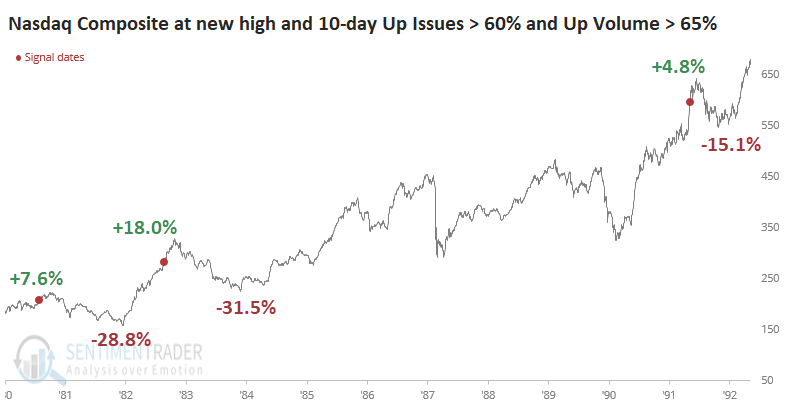
Oddly, the thrust triggered when the Composite was trading at a new high. Most of them came after protracted declines. Out of all the signals, only three others triggered with the Composite at a multi-year high. The chart below shows how the Nasdaq rallied in the shorter term each time...and each of them was also a blow-off peak.
BREADTH IS THRUSTING, BUT MACRO IS DETERIORATING
Even as the major equity indexes vacillate near record highs, macro conditions are deteriorating and the probability of trouble is rising.
Last week, we saw that economic reports have been coming in below economists' expectations, both domestically and globally. As another reflection of those weak reports, our Macro Index Model has been deteriorating. Once the final reports were in for August, the model plunged below 46%, the 2nd-lowest reading of the past decade.
At the same time, the Bear Market Probability Model has jumped again. This is a model outlined by Goldman Sachs using five fundamental inputs.
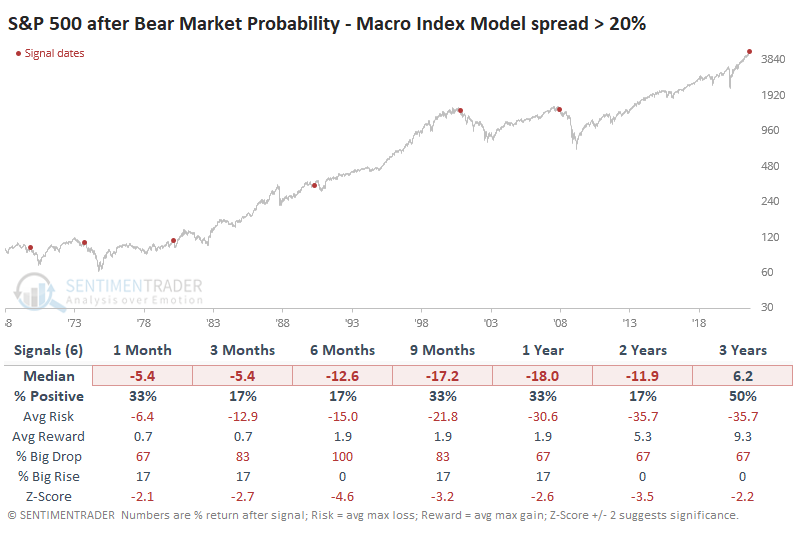
The chart below shows the spread between the Bear Market Probability and Macro Index models. The higher the spread, the higher the probability of a bear market combined with poor macro conditions.
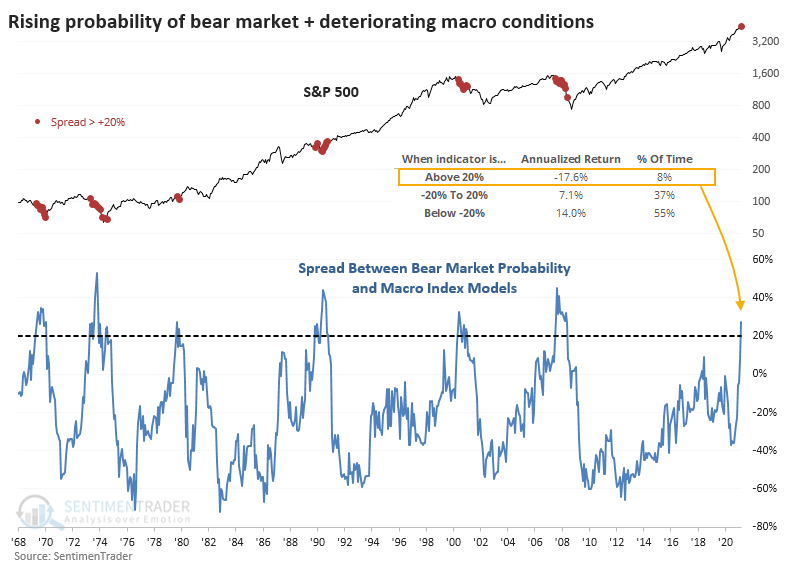
The chart shows that the S&P 500's annualized return is a horrid -17.6% when the spread is above 20% like it is now. The table below shows forward returns in the S&P after the spread crosses above +20% for the first time in at least a year.
Among sectors and factors, there weren't many places to hide. The more defensive sectors tended to hold up the best, which is not a big surprise. Technology and Industrial stocks tended to suffer the worst returns.
There is no good way to square this kind of outlook against some of the positives that have been triggered lately, most notably the breadth thrusts. A bearish argument would be much more lucid if the poor internal breadth conditions from earlier in the summer had persisted, but instead many of them have not only reversed but have given opposing (i.e. bullish) signals. This is confusing, no doubt.
The biggest risk for those counting on the thrusts is that when they occur when the indexes are trading at new highs instead of after a protracted decline, they have sometimes highlighted blow-off peaks. Given the backdrop from these models, that seems like a real risk here.
STOCKS AND SECTORS - ASIA PACIFIC IS RISING
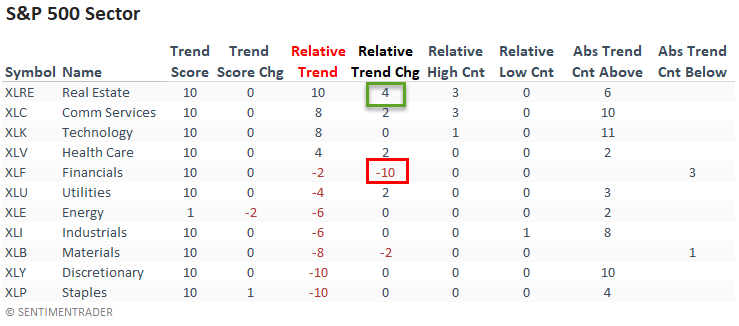
Dean updated his absolute and relative trend following indicators for domestic and international ETFs.
The week-over-week volatility in the financials relative trend score is noteworthy. After a six-point increase in the previous week, financials fell out of bed last week with a ten-point decline. The good news is the sector is not registering new relative lows.
Real estate reestablished a perfect trend score combination after a four-point increase in its relative score. The sector also registered a relative high on 3/5 days.
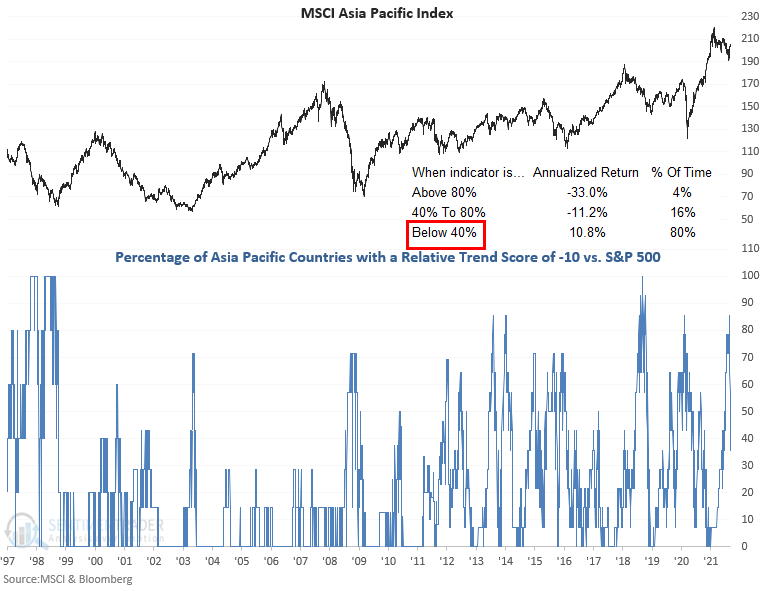
The percentage of countries with a positive relative trend score versus the S&P 500 increased on a w/w basis. The current level, while improving slightly, continues to suggest an unfavorable environment for the MSCI ACWI World Index ex USA. But at least the percentage of countries with a relative trend score of -10 versus the S&P 500 registered a noticeable improvement on a w/w basis, especially in the Asia Pacific region.
Let's conduct a study to assess the forward return outlook for the MSCI Asia Pacific Index when the 5-day net change for the percentage of countries with a relative trend score of negative ten collapses by 29% or more.
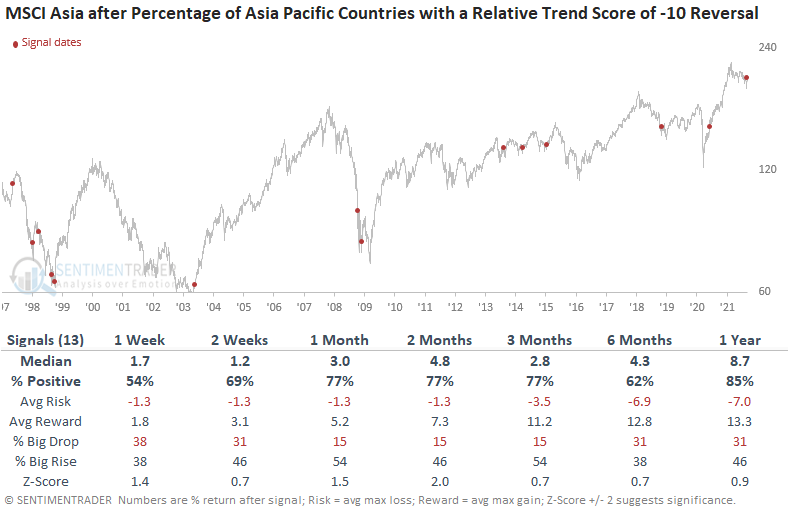
Results look good across almost all timeframes, with the 2-month window showing the most robust outlook.
STOCKS AND SECTORS - NIKKEI 225
Dean showed that the Nikkei 225 ratio adjusted McClellan Oscillator surged to one of the highest levels in history this week.
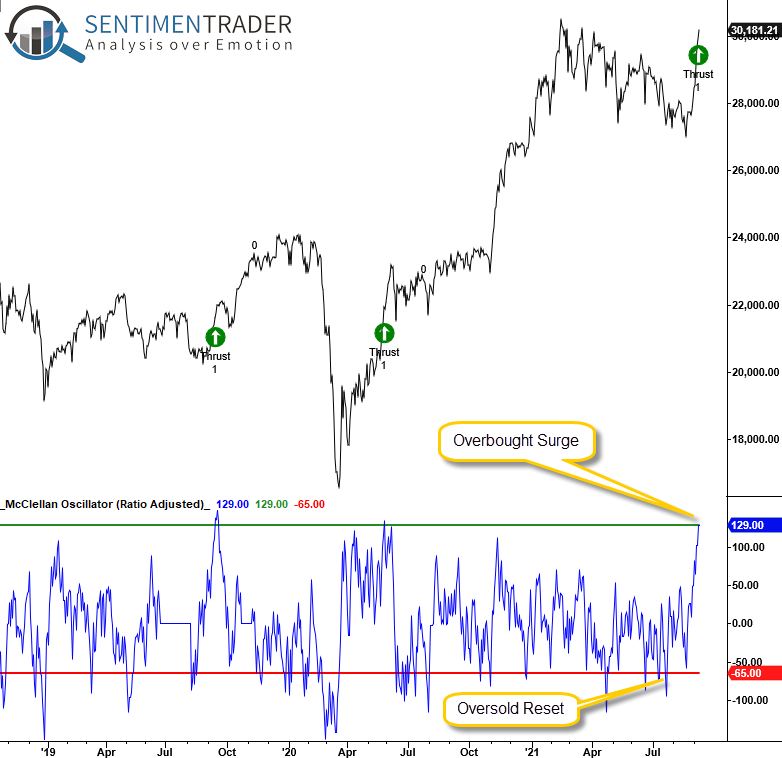
Let's conduct a study to identify when the Nikkei 225 Index ratio adjusted McClellan Oscillator crosses above 128.99 after the oscillator crosses below an oversold reset condition of -65.
While the sample size is small, performance looks good, especially in the 2-week timeframe. The current momentum would suggest that the Nikkei 225 will emerge from the 6+ month consolidation with an upside breakout.
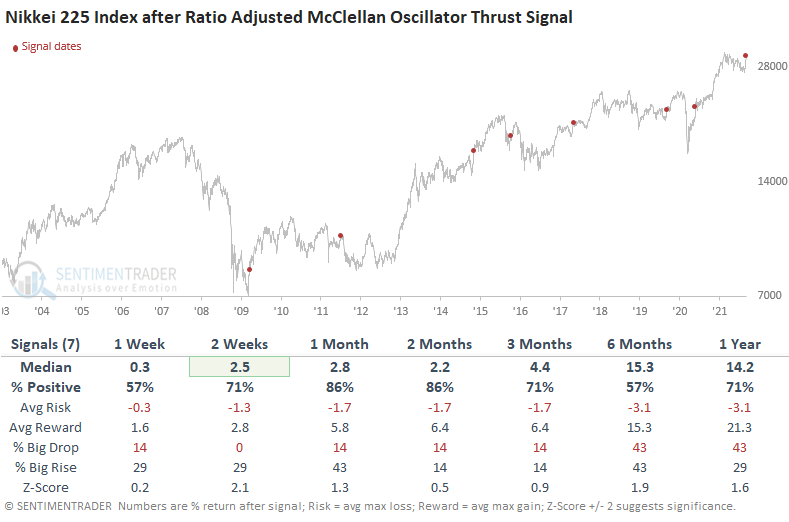
If we apply the same signals to the iShares Japan ETF (EWJ), we see results that look far less robust. When assessing global signals, it's always important to differentiate between the local currency and US Dollar results.
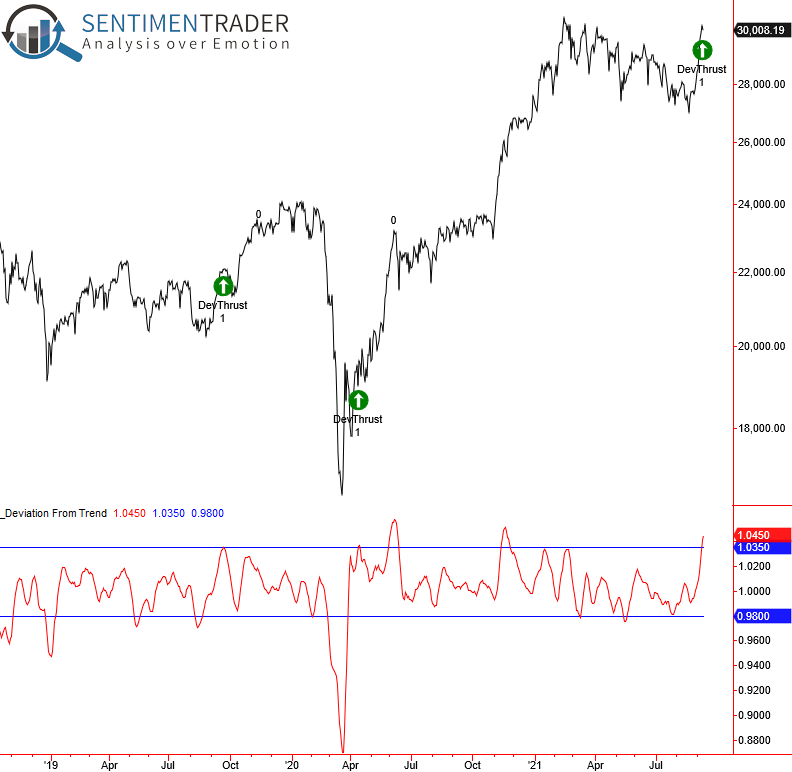
Dean also looked at a deviation from trend signal for the Nikkei. It watches for times when a short-term moving average drops significantly below a longer-term average, then surges far above it.
The signal triggered this week for Japanese stocks.
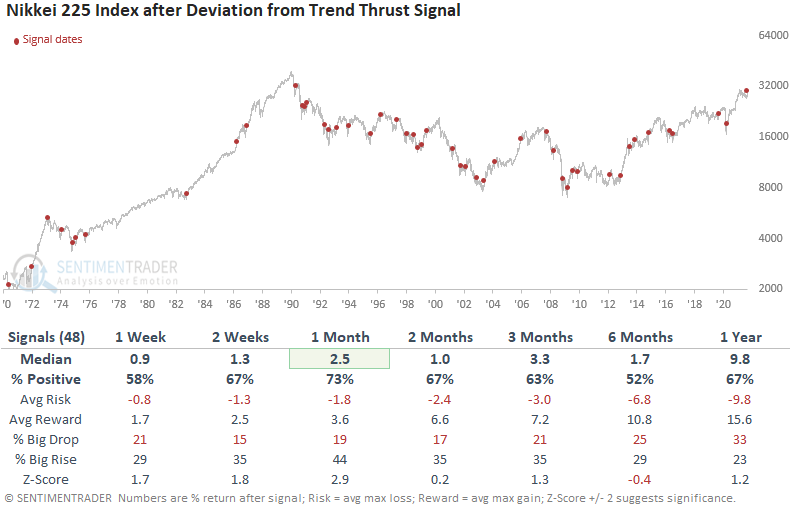
The short-term results after other signals look good, especially the 1-month timeframe. The intermediate to long-term performance numbers are primarily in line with historical returns.
| COMMODITIES | ||
 |  | |
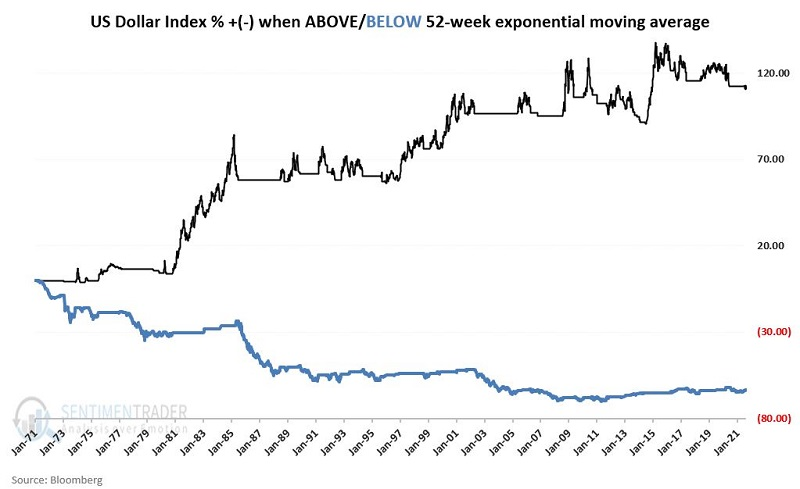
Jay pointed out that the U.S. Dollar Index is flirting with its 52-week exponential moving average.
The cumulative percentage price change for the dollar when it is above its own 52-week exponential average since 1969 is +111%; when it is below its own 52-week exponential moving average the cumulative loss has been -64%. To drive home the point, the chart below displays the equity curves.
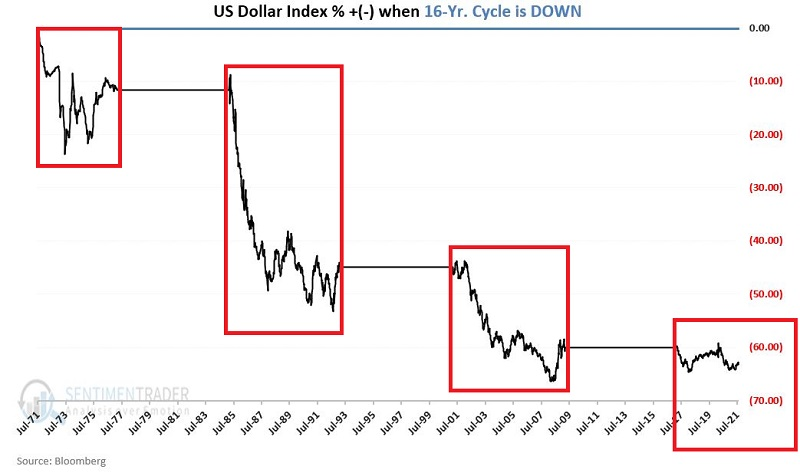
The dollar has tended to move in four-year swings. We are not talking about picking tops and bottoms with uncanny accuracy. We are merely trying to gain an edge by paying attention to long-term cycles. The chart below displays the second four years of price performance (highlighted in the red boxes) in each 8-year period starting in 1969.
The current part of the unfavorable cycle goes from March of this year through March 2025. The chart below displays the cumulative % price performance for the U.S. dollar ONLY during those times since 1969 when the dollar was below its 52-week EMA and it was within the 4-year unfavorable portion of the 8-year cycle.
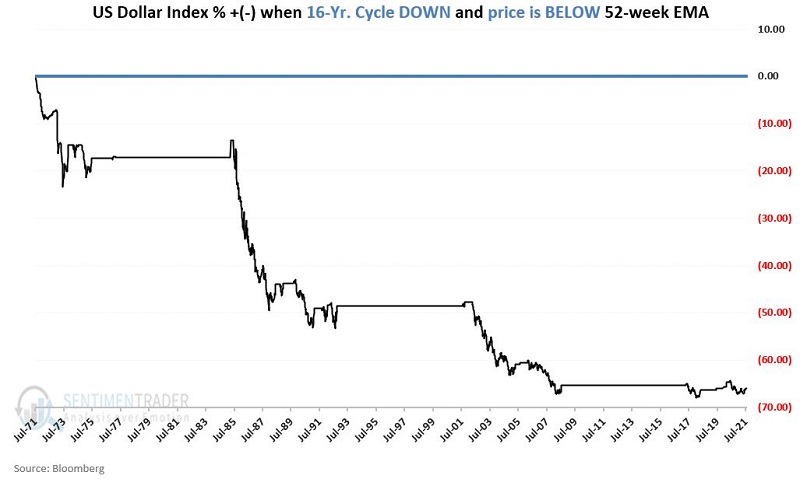
It is always possible that the cycle will prove the exception to the rule and that the U.S. dollar may advance significantly. The important thing to note is that it will have to swim upstream of these historical trends to do so.
WATCH WHEAT
Jay noted that while corn and soybeans remain mired in periods of seasonal weakness, wheat is entering a period of seasonal strength.
Since 1959, wheat has shown strength from Trading Day #172 through the close of Trading Day #186, lasting from now through the next few weeks.
This window was a model of consistency for many decades. It took two large hits in the past decade but has returned to consistency in recent years, showing gains in each of the last 6 years.
The chart below displays the cumulative gain or loss achieved by wheat futures ONLY during this seasonally favorable period.
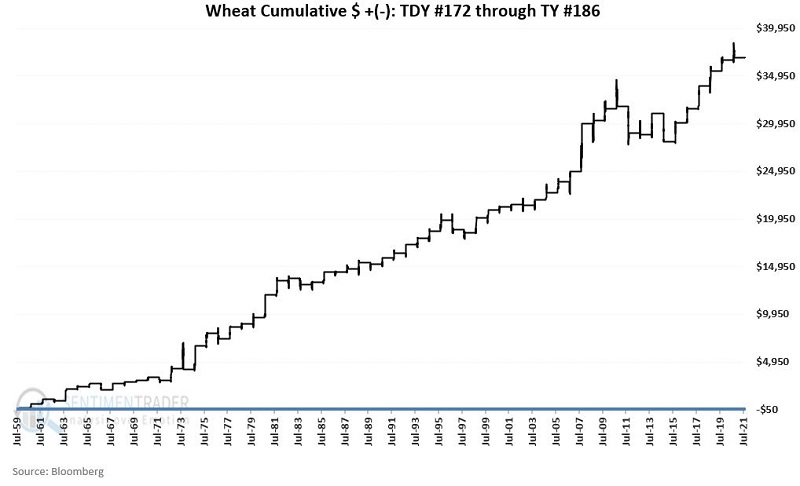
It was positive 79% of the time with an average gain that was about double the average loss.