TradingEdge for June 18 - Speculative Surge, Commodity Concerns

The goal of the Weekly Wrap is to summarize our recent research. Some of it includes premium content (underlined links), but we're highlighting the key focus of the research for all. Sometimes there is a lot to digest, with this summary meant to highlight the highest conviction ideas we discussed. Tags will show any symbols and time frames related to the research.
| STOCKS | ||
 | ||
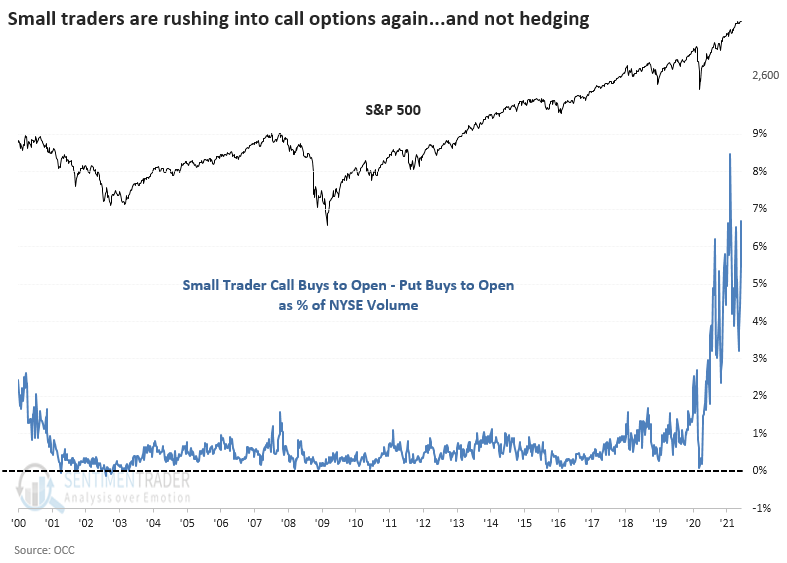
After taking a pounding from almost certain options-related losses following a speculative surge in February, small options traders stormed back at the beginning of June.
With some indexes moving to new highs last week, these traders have no intent on missing out, with speculative call buying flooding the markets once again. The smallest of traders, those executing 10 or fewer contracts at a time, spent 53% of their total volume on speculative call buying last week, accounting for over 9% of all NYSE volume.
It's not like these traders are hedging by buying some puts, either. When we look at small traders' call buying volume and subtract their put buying to get a net figure of speculative behavior, it's even more egregious. The only week in 22 years that exceeds last week's activity was the week ending February 12 of this year.
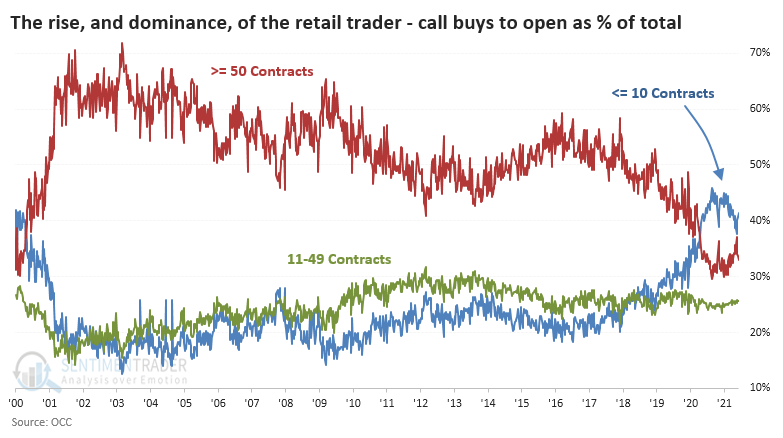
The rise in speculative trading is not solely due to the smallest of traders. But it primarily is - unlike any other period in 20 years, the smallest traders are the dominant factor in speculative options trading, accounting for 40% - 50% of all call buys to open.
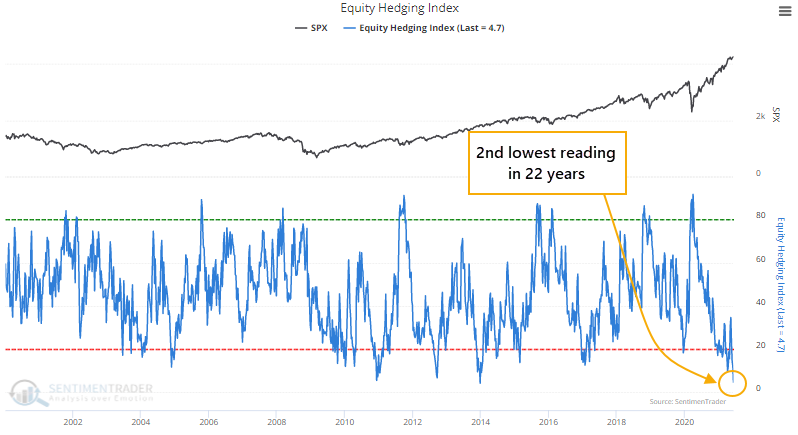
With this drop in hedging activity in options, seemingly little interest in shorting futures, little cash on hand relative to other assets, and similar behavior, the Equity Hedging Index plunged to the 2nd lowest reading on record.
HOUSEHOLDS ARE FLUSH WITH STOCKS
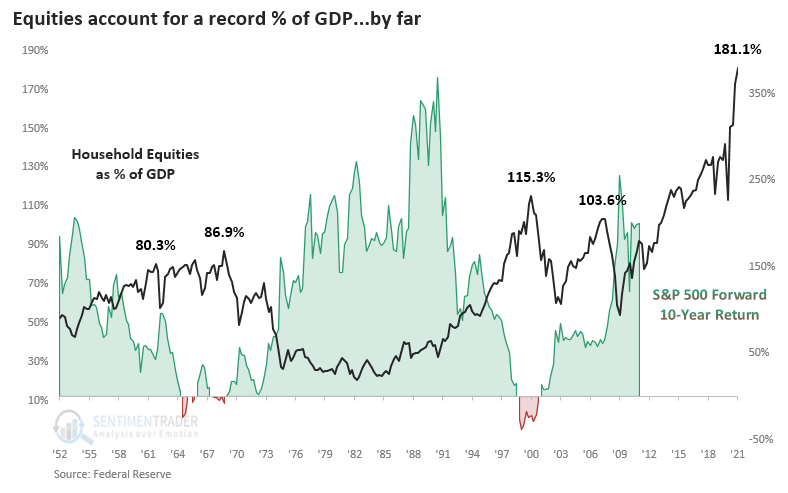
Consumers are flush, and they've got a whole lot riding on markets.
The latest Federal Reserve data on household assets, just released with a delay for Q1, shows that once again, equities have pushed to a record relative to all household financial assets. A similar look at the data shows the thing but in an even more extreme way. Relative to the country's output, stock holdings have soared and far surpass any historical extreme. But, of course, it's been this way since 2015, so anyone using it as a bearish crutch has been hurting.
The table below shows these ratios' correlation to the S&P 500's future returns across various time frames. There was a negative, but weak, correlation to returns up to a year later, then it increases consistently, with the highest correlation being to 10-year returns.

If we use these correlations to estimate the S&P's returns in the quarters ahead, it's not a pretty picture. This should be a surprise since the indicators are at all-time highs. Most of the "least bad" returns in sectors and factors were in Staples, Energy, and Utilities. The worst were in Industrials, Technology, Communications, and REITs.
A WEEK WITH NO WORRIES
Last March, more than half of our core indicators were showing extreme pessimism. That's the kind of lopsided sentiment that has reliably coincided with the final "puke" phase of a decline, like the Christmas panic of 2018.
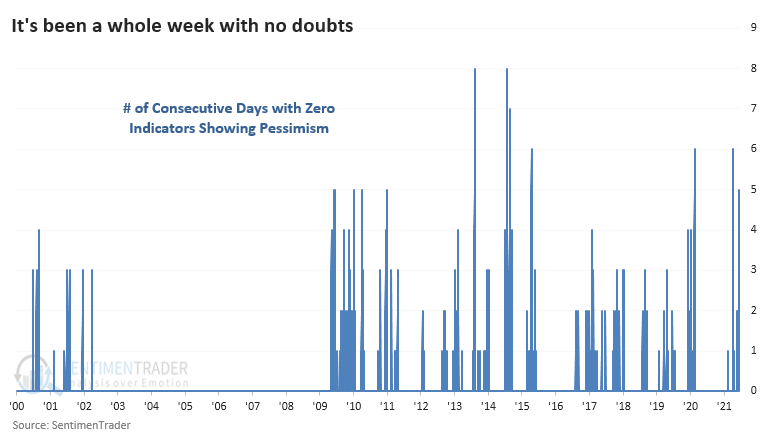
Times have changed. For the past week, there has not been a single one of our core indicators showing pessimism. It's been rare to see an entire week go by without even one indicator sliding into extreme territory. The longest streak was 8 days, but before 2009, there wasn't a streak of even 5 days.
The handful of times we went a week without a pessimistic extreme, the S&P 500 wasn't able to sustain its gains much longer.
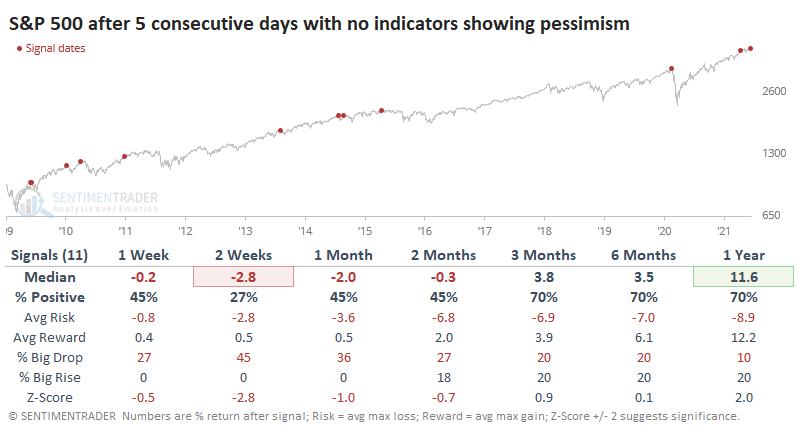
The rally in stocks has been incessant since November, and we once again see a spurt of speculative excess along with some minor deterioration under the surface. It hasn't been enough to trigger any major warning signs, but it bears watching given the new round of extremes in many indicators.
FINANCIALS BEAR WATCHING
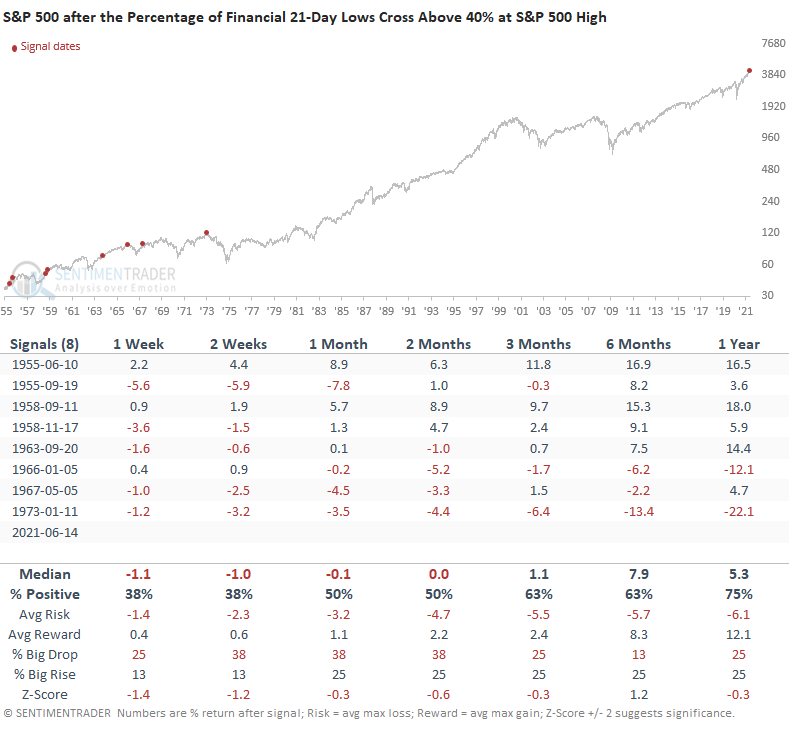
Dean looked at the percentage of S&P 500 financial sector members registering a new 21-Day Low, which spiked to 44% on Monday.
The spike doesn't stand out compared to history. However, the surge in new lows occurred within six days of a new all-time high for the sector and when the S&P 500 closed at a new all-time high.
Financials are vital to the overall health of the stock market as most components play an essential role in the extension of credit in the economy. When the S&P was at an all-time high, and there was a spike in one-month lows in Financial stocks, the S&P saw some trouble ahead. Granted, it's a small sample and hasn't triggered for nearly 50 years, but this group bears watching closely.
MID-CAP STOCKS ARE WEAK, TOO
In several intraday updates in the last few weeks, Dean has noted a deterioration in a breadth composite for the S&P 500. The short-term measures are influencing the composite as long-duration indicators remain healthy.
Several short to intermediate-term breadth indicators are weak for the S&P 400 index of Mid-Cap stocks. Dean searched for all instances when the percentage of S&P 400 members trading above the 50-day is less than 52.5%, and the index is within 2.5% of its most recent high.
The chart below shows the most recent signals, and obviously, they're disturbing.
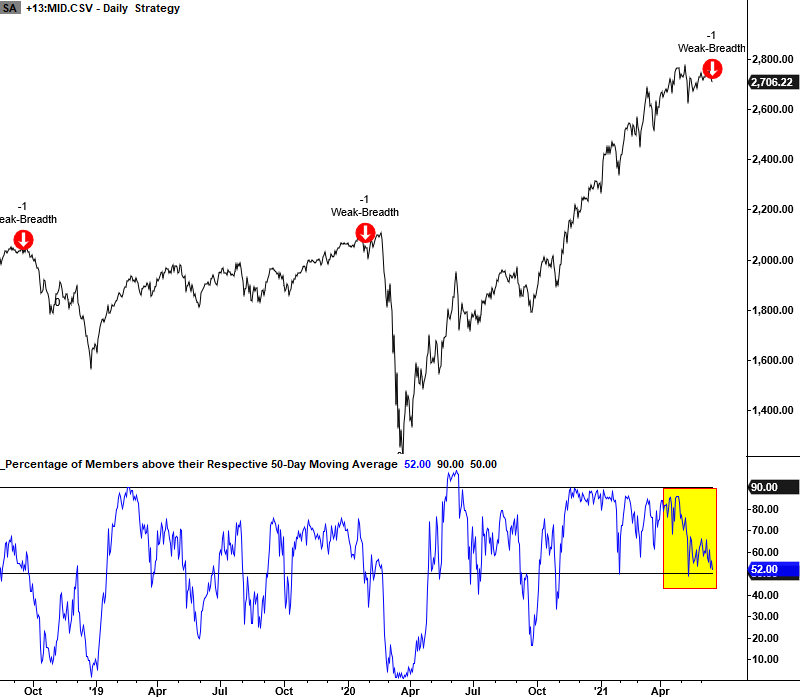
It wasn't a perfect signal as Mid-Caps shrugged off similar divergences in 2013, for example. But the overall tone of future returns was weak. Longer-term measures are still quite positive, so this is just a heads-up to pay more attention to these metrics, and this index, in the week(s) ahead.
IF STOCKS CAN HOLD ON FOR ANOTHER COUPLE OF WEEKS...
Jay pointed out that how stocks perform in June could have important ramifications for the next 9-1 months.
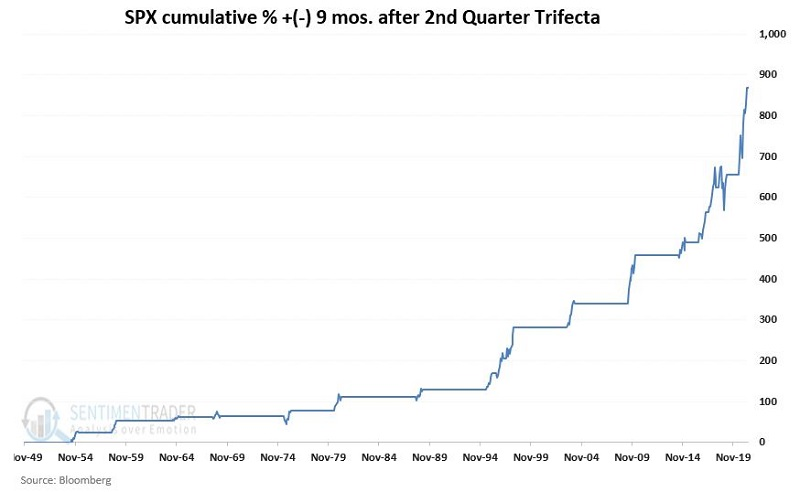
If SPX closes the month above 4,204.11, it would mean that April, May, and June all showed a higher close. Since 1949, there have been 17 previous instances when the S&P 500 Index achieved this "2nd Quarter Trifecta" by closing higher during all 3 months.
The chart below displays the hypothetical monthly equity curve achieved by holding the S&P 500 Index ONLY during the 9 months after each previous signal.
Below, we can see the previous signals and the price change in the S&P 500 over the next 9 months.
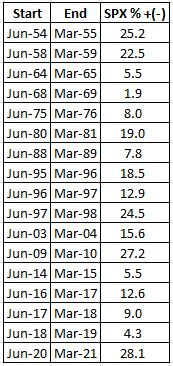
There wasn't a single loss.
OVERSEAS STOCKS DOING WELL
Dean updated the absolute and relative trend following indicators for domestic and international ETFs.
There was a deterioration in value-based sectors like industrials and materials at the expense of the growth-oriented technology sector. Value has been a leader for some time, so it shouldn't a surprise to see some rotation into beaten-down technology stocks.
The percentage of European countries outperforming the S&P 500 index deteriorated last week at the expense of growth-oriented groups. Nevertheless, the region is worth monitoring, given that it leans more toward value-oriented stocks.
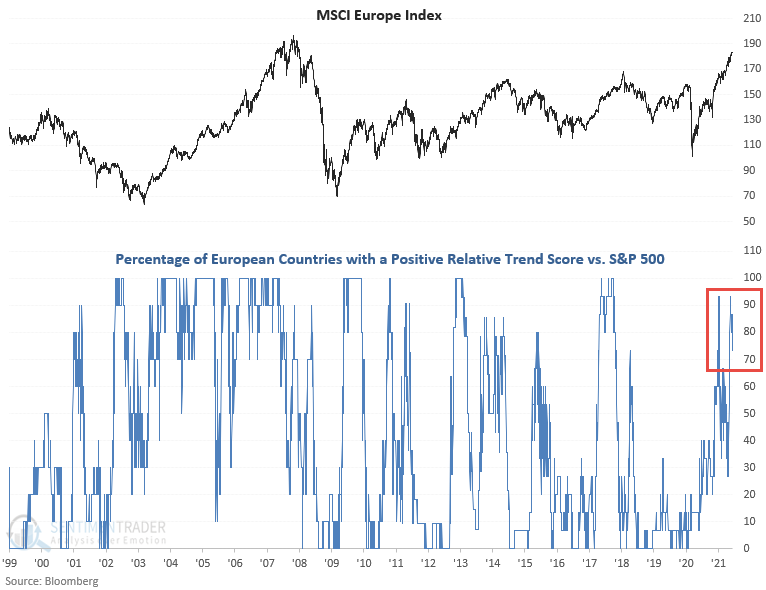
Still, there have consistently been more than 50% of countries outperforming the S&P. When this hovers above 50%, we have been in regimes when overseas markets are providing better opportunities than domestic ones.
MORE SIGNS POINT TOWARD VALUE
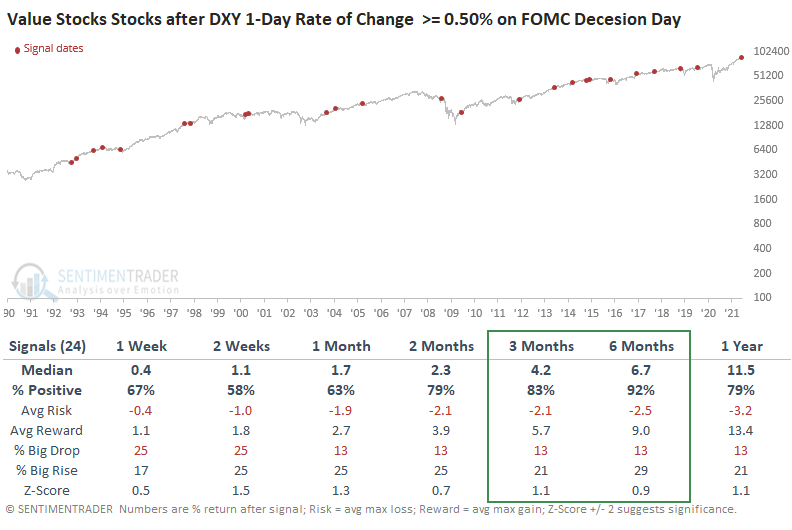
In an intraday update on Thursday, Dean shared a study to assess the Dollar Index (DXY) outlook when it surged by 90 bps or more on an FOMC decision day. The results returned a minimal sample size, so he relaxed the 1-day rate of change level from 90 to 50 bps to capture more instances.
While one day does not make a trend, the potential implications for sectors and assets of a continuation from the FOMC decision day surge could be meaningful. Among domestic and overseas indexes, assets, sectors, and factors, Value stocks stood out as being among the best performers going forward.
AMC CRAZINESS
Ticker AMC (AMC Entertainment Holdings, Inc.) has been arguably the hottest and one of the most heavily traded stocks in 2021. In the past 30 days, the stock has averaged over 146 million shares traded per day! In addition, over a million AMC options have routinely been traded daily of late. So the bottom line appears to be that many traders are "chasing the dream" of riches beyond the dreams of avarice by catching and riding the next "Big Wave."
Unfortunately, the way AMC options are priced greatly reduces the likelihood of achieving those dreams. So, Jay took a closer look at the potential pitfalls.
Huge stock price volatility almost invariably results in huge option volatility. This is true in spades for AMC, as evidenced in the chart below (from www.Optionsanalysis.com), which highlights the huge increases in option implied volatility (the black line) that unfolded.
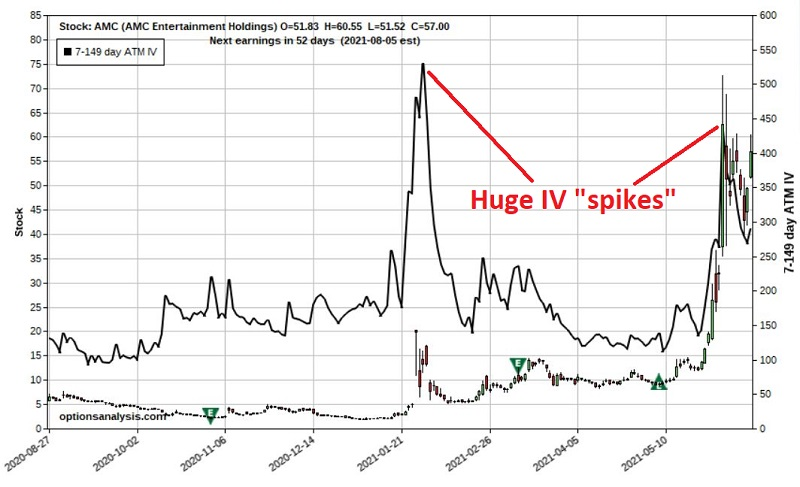
Options that typically traded at a volatility of 100% to 150% twice soared north of 400%. The net effect of higher IV is a massive increase in the amount of time premium built into the options - i.e., all options become more "expensive."
Jay outlined two strategies that would profit should AMC decline, one buying premium (Trader A) and the other selling premium (Trader B), outlining the risk versus reward of each type of strategy with specific options.
The bottom line was this:
- The maximum profit potential is much greater for Trader A, but Trader A's probability of success is much lower
- The maximum profit potential is much lower for Trader B, but Trader B's probability of success is much higher
Given that over a million AMC options a day have been traded of late, clearly, many traders see opportunity in this situation. And with a stock that can make such massive movements in price, potential money-making opportunities exist. Nevertheless, as illustrated in the examples, traders may be wise to consider any trade involving AMC options as "high risk, high reward" situations.
| COMMODITIES | ||
 |  | |
Jay outlined some immediate concerns about corn and a couple of ways that options traders could use this on a related ETF.
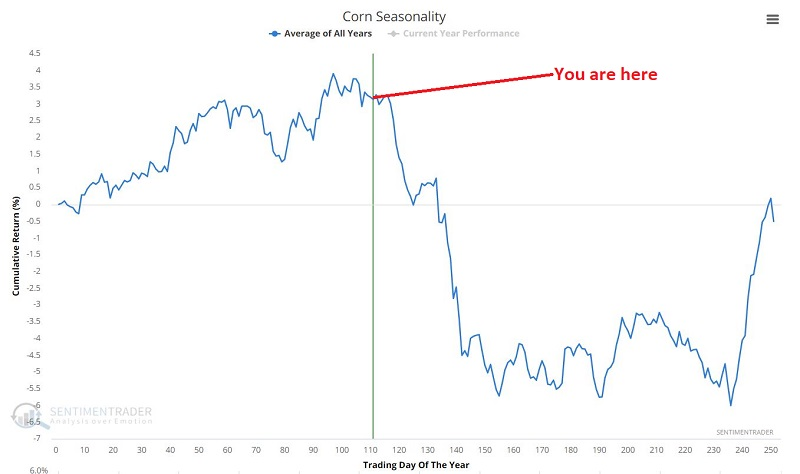
The corn market historically has exhibited a highly seasonal bias across the calendar year. The seasonality chart below pretty clearly illustrates the potential danger zone corn is entering.
Sentiment in the corn market is extremely optimistic but starting to ebb. Since 1996, there have been only 5 previous occasions when the 100-day moving average of corn Optix dropped from above to below 72. Those signals are displayed in the chart below.
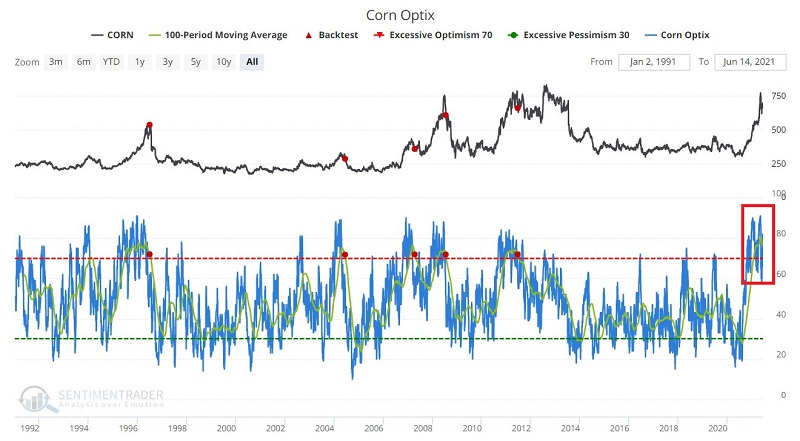
Given the nature of markets in the last year plus widespread supply and demand imbalances, there is no reason that corn cannot continue to rally to much higher ground. That said, if it fails to do so, sentiment and seasonality suggest the potential for significant price weakness.
LUMBER TO GOLD RATIO
The ratio of lumber to gold is crashing, and it's raising concerns among some investors.
Lumber is considered a proxy for economic growth since it's an input to many construction projects. Gold is considered a "safe haven" asset that investors flock to in times of duress.
Ever since our Optimism Index on lumber hit 90%, lumber has been in a free-fall, surpassing the last couple of post-euphoria crashes in speed, if not magnitude. So, the ratio of lumber to gold has crashed, but it was not a good reason to sell stocks.
It was, however, a pretty good reason to sell lumber. The contract continued to plunge most of the time, with the first signal in 1989 being the only sustained exception.
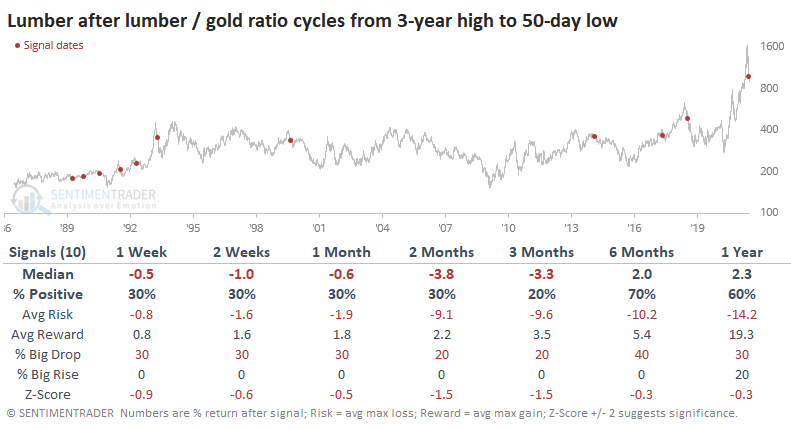
There isn't much support here to consider a crash in the price of lumber relative to gold as a reason to be concerned about the stock market, at least on an aggregate level. Instead, a more defensible position is that higher-beta, higher-risk sectors may be more vulnerable, and homebuilding stocks have suffered the most.
Jay also looked at the ratio of lumber to gold and what it might mean for gold prices.
The chart below measures the deviation of the lumber/gold ratio from its own 200-week exponential moving average as follows:
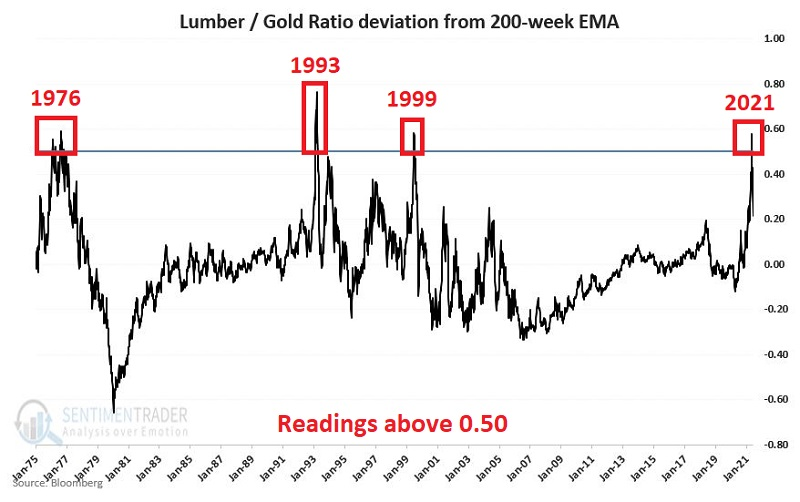
Note that before May 2021, there have been only 3 previous occasions when this ratio exceeded 0.50 - 1976, 1993, and 1999. The ratio pierced 0.50 for only the 4th during the week of 5/7/2021.
Let's look at the previous instances:
- In 1976, gold first worked lower for a while before moving significantly to the upside.
- In 1993, it proved to be a low-risk buying opportunity as gold rally sharply over the next 3 months.
- In 1999, gold drifted lower for a short while and then spiked sharply higher (albeit only briefly) during September and October.
Nothing discussed above guarantees that gold will not decline in the weeks and months ahead, let alone that it will, in fact, rally in any meaningful way. A useful confirmation signal would occur if the Gold/S&P 500 Ratio closed above its 200-week exponential moving average.
ALSO...THE DOLLAR SPIKE
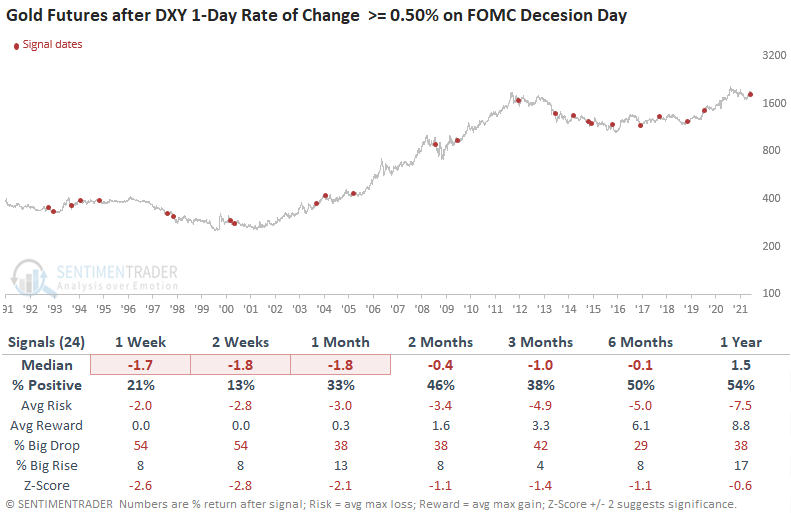
Dean showed that the Dollar Index (DXY) surged 95 bps on the Fed decision day on Wednesday. Forward returns on the dollar were good, but the sample size is small.
When expanding the sample by looking for spikes of 0.5% or more in the dollar on an FOMC decision day, the dollar showed a consistent tendency to keep rallying. But it was even more consistent - in the opposite direction - for gold. This is a headwind for the metal and detracts from some other recent positive developments.
COTTON IS NOT COMFORTABLE
Jay took a deep dive on cotton and how it could be vulnerable during the summer months due to technicals, seasonality, and sentiment. He also looked at ways to trade this market.
Few markets are as cyclical as the cotton market. The black line in the chart below displays the hypothetical $ + (-) achieved by holding long a cotton futures contract ONLY from October through April. The blue line displays the hypothetical $ + (-) achieved by holding long a cotton futures contract ONLY from May through September.
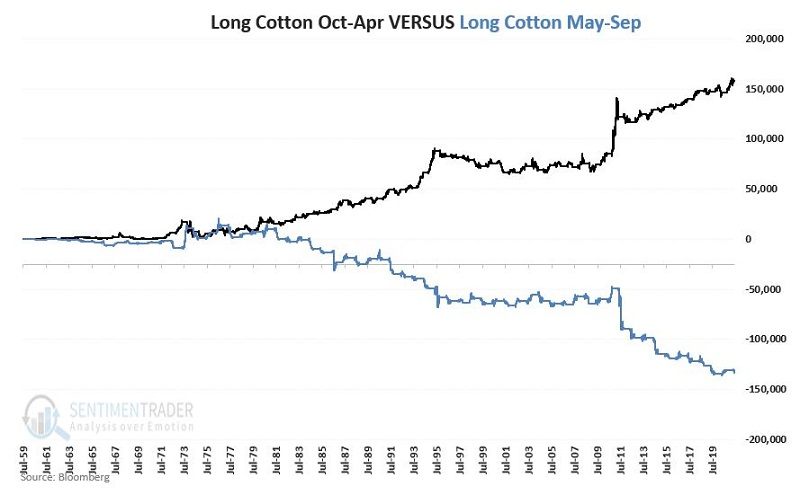
The seasonal weakness and a warning sign related to sentiment in the cotton market suggest that any drop below the 50-day average could be a sign of potential trouble and that traders should pay close attention.
GAS HEADED FOR A SUMMER SWOON?
At the moment, given the non-stop rise in the price of crude oil in the last year and the pickup of inflation in recent months, there is a lot of concern regarding the future direction of gasoline prices.
Jay pointed out that those suffering from high gas prices may be about to get a reprieve if the calendar is any indication.
Gas price data from the Department of Energy comes out each Monday. So, we will break the calendar year into two periods and the bearish period begins on the 2nd Monday of July and extends for 24 weeks. The chart below displays the cumulative dollar and cents change in the price of gasoline during the bearish period starting in July 1991.
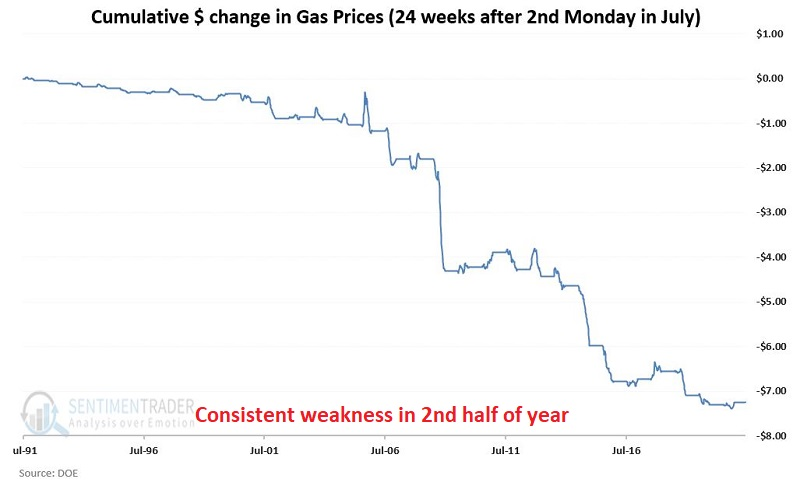
With the 2nd Monday of July fast approaching, history suggests that drivers may feel surprisingly more at ease at the pump in the months ahead. Here's hoping.

