
TradingEdge for Jul 2 - Low Correlations, Underperforming Stocks, Commodity Momentum


The goal of the Weekly Wrap is to summarize our recent research. Some of it includes premium content (underlined links), but we're highlighting the key focus of the research for all. Sometimes there is a lot to digest, with this summary meant to highlight the highest conviction ideas we discussed. Tags will show any symbols and time frames related to the research.
| STOCKS | ||
|  |  |
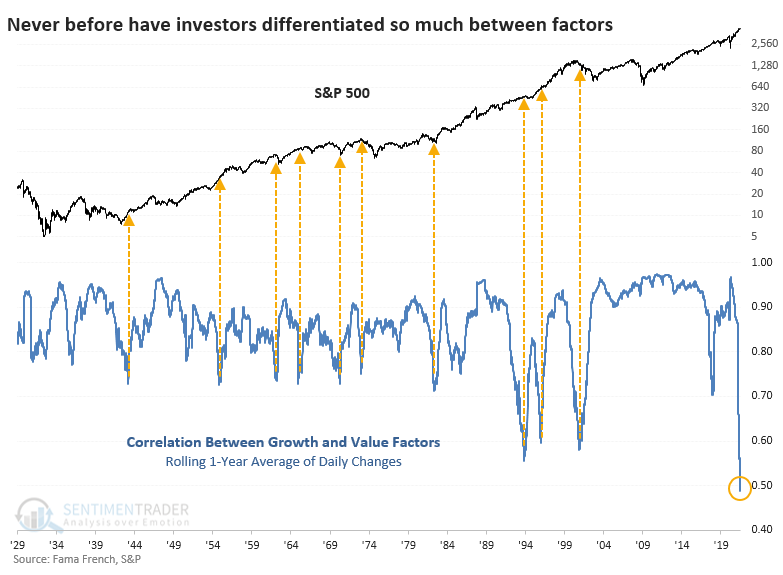
This is just like the year 2000, and stocks are about to take a tumble.
That's the implication from a chart that's being shared around trading desks, relating to the breakdown in correlation between Growth and Value stocks. If we look at a rolling 1-year correlation between daily percentage changes between those two factors, it's now at the lowest point since the pricking of the internet bubble.
Theoretically, a bearish argument might make sense. If investors are so complacent about stocks that they just shift their assets from one sector or factor to another instead of moving to cash, then there really isn't much concern being priced in.
The chart below goes back to 1928 and highlights any other periods that showed similar behavior.
Clearly, it wasn't a consistent signal to become overly defensive about stocks in general. However, it was a good signal to become cautious about growth stocks relative to value stocks over a longer time horizon.
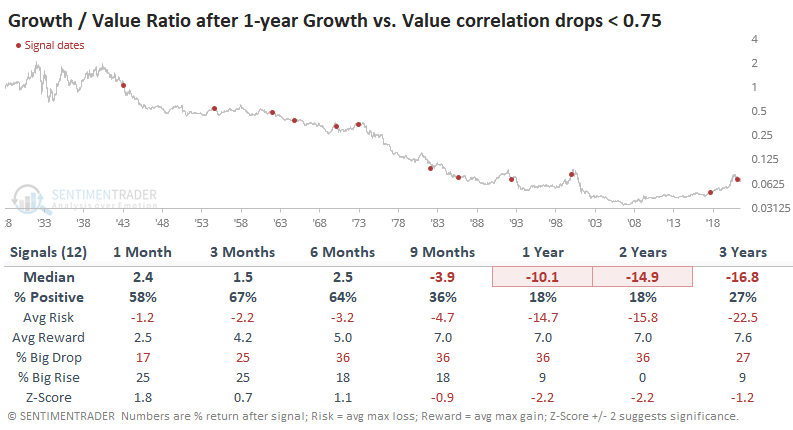
During the next 1-2 years, Growth stocks underperformed Value stocks after 10 out of 12 signals, and the last signal in 2017 was really the only sustained exception to this.
OVERVALUED BUT ECONOMICALLY SOUND
Jay looked at stocks' current valuation and macro backdrop.
The chart below displays the Shiller PE Ratio, which Adjusts annual S&P 500 earnings by inflation, using a 10-year average of earnings as the divisor and the S&P 500 Index as the numerator.
The purpose is to give a sense of whether the market is overvalued, undervalued, or somewhere in between.
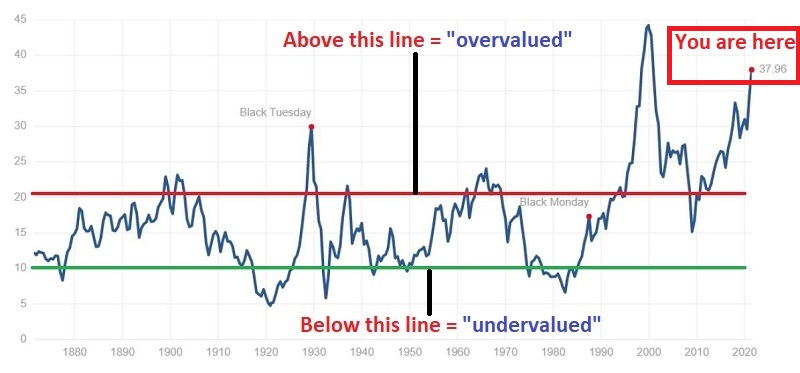
The most important thing to note is that the Shiller PE Ratio (or any valuation measure) is NOT a TIMING tool. An undervalued reading is not an automatic "buy" signal, and an overvalued reading is not an automatic "sell" signal. Instead, the Shiller PE Ratio is a perspective indicator that suggests when overall risk is high or low in the stock market.
Perhaps the best way to think of it is this way:
- In the long run, the stock market mostly moves based on economic conditions
- A recession is an economic equivalent of jumping out of a window
- Valuation measures (such as the Shiller PE) tell you what floor you are on at the time
Crude but accurate.
If a recession occurs when the market is overvalued, the declines can be near-catastrophic to investors' short-term - and possibly - long-term investment goals.
The primary catalyst for a bear market is when the stock market gets a whiff of an impending economic downturn. How can investors stay alert to the possibility of such a downturn? A simple approach is to monitor the Sentimentrader Macro Index Model, which tracks 11 different economic-sensitive indicators.
In the chart below, a drop into the red portion (i.e., below 70%) signals the potential for an economic recession. This is especially significant when the Shiller P/E Ratio tells us that the stock market is overvalued - as it most definitely is today.
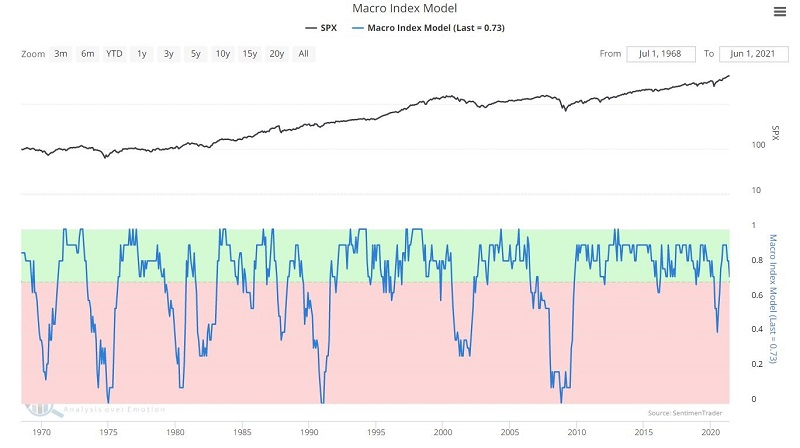
There are always "things" to be concerned about that may upset the apple cart. Yet despite all of the present-day chatter by pundits trying to be the first one to "call" the next recession, the reality is that our objective Macro Index Model remains favorable regarding the U.S. economy, the major market averages are at or near all-time highs, and it is exceedingly easy to dismiss all warning signs.
BETTER TO BE IN AN INDEX THAN INDIVIDUAL STOCKS
It's getting harder and harder for an average stock to beat the index.
For the second time in less than a year, Dean notes that only 30% of stocks in the S&P 500 have outperformed the index itself over the past month. Since 1927, only 2% of days have seen fewer stocks outperform the index.
This type of behavior will happen when relatively few stocks are driving the gains in an index, especially a capitalization-weighted one like the S&P 500. We can also see this reflected in the relatively few stocks that are holding above their 50-day moving averages.
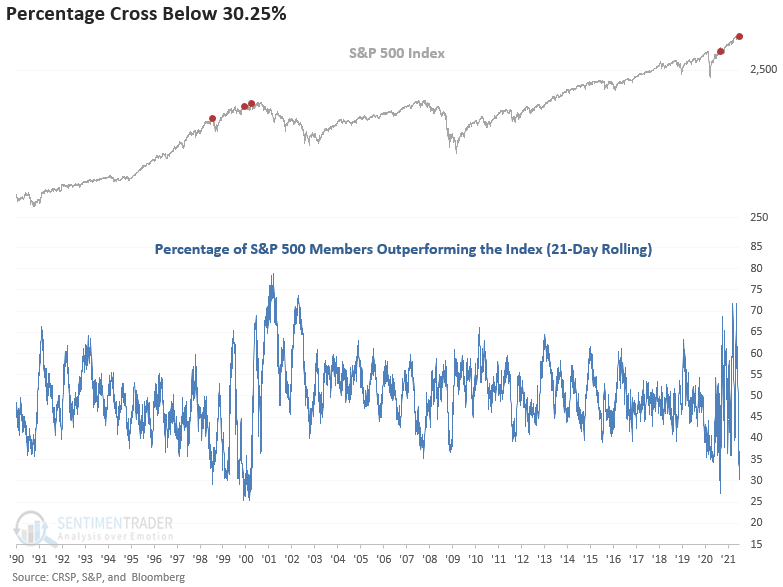
The last time the indicator fell to a level around the current reading, the S&P 500 rallied for an additional eight trading days before correcting by 9.6% on a closing basis in September 2020.
The tail-end of the Dotcom bubble provides the most recent analog to the current-day swings in the indicator.
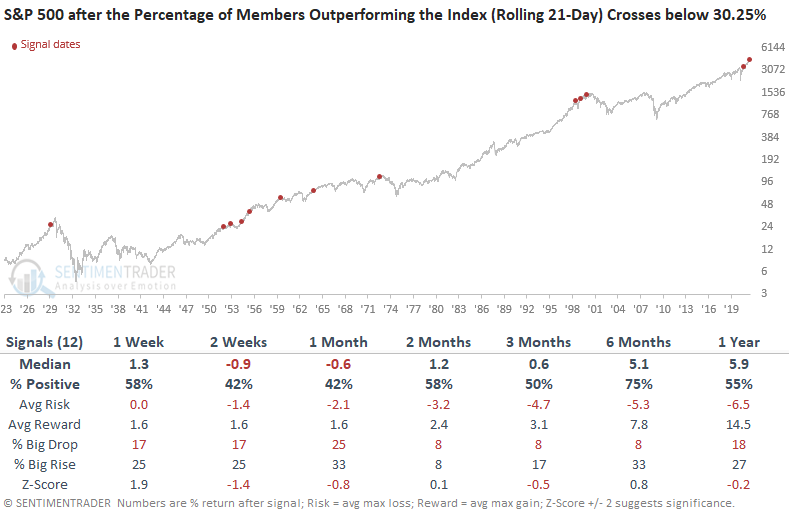
With only 12 signals since 1927, the level of members outperforming the index is historic. The returns in the 2-4 week timeframe are relatively weak, while other periods show somewhat muddled returns. Some of the signal dates like 1929, 1972, and 1999 are concerning.
It's even more egregious for Consumer Staples stocks with only 9.4% of those stocks outperforming their index over the past three months. Maybe ironically, after similar instances, Staples actually outperformed the broader S&P 500 index.
RETAIL IS BUYING CALLS, HEDGE FUNDS ARE...HEDGING
Speculative options activity is near records, but somebody, somewhere, is hedging against a big fall.
A couple of weeks ago, we saw that options volume was exploding to the speculative side again, with few indications of hedging activity anywhere. That hasn't changed much, with small traders still focusing nearly 50% of their total volume on buying call options to open.
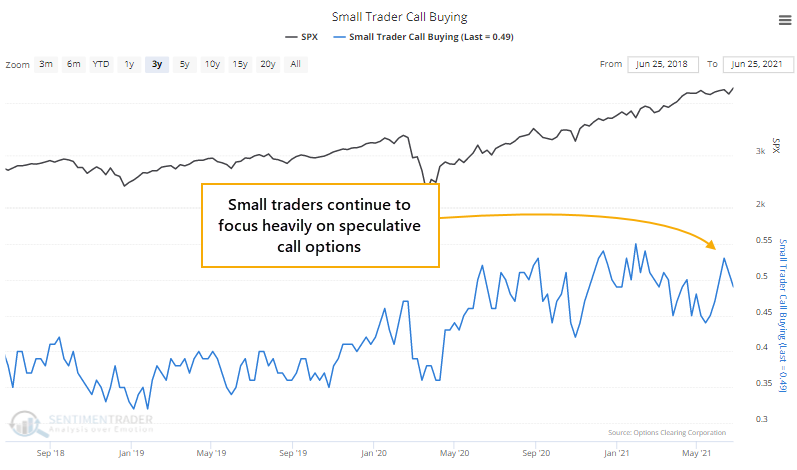
That's down a bit from the recent peak but still among the highest readings in over 20 years.
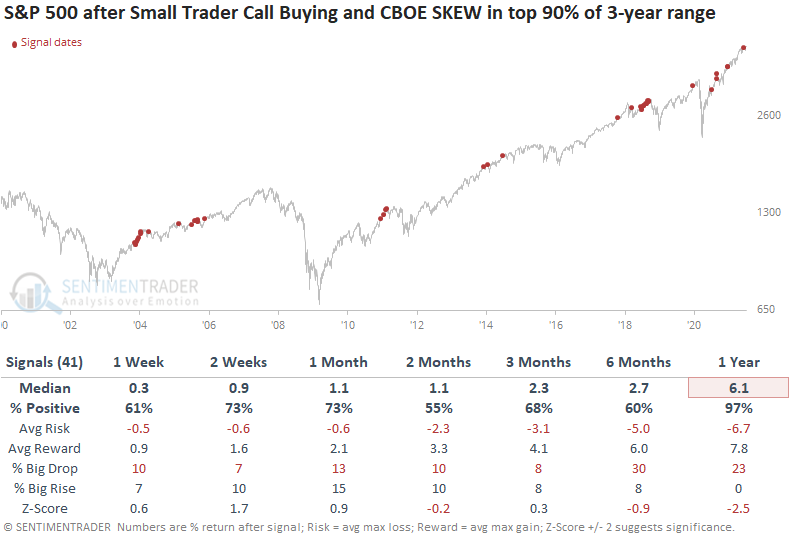
At the same time, there is a big spike in the SKEW Index. At its core, it tries to measure the price of far out-of-the-money puts versus calls, with high readings suggesting a higher probability of a crash-type event within the next 30 days.
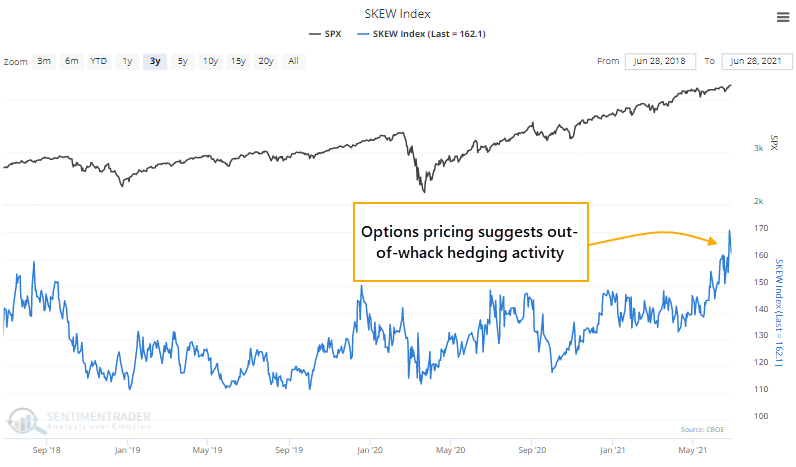
Now, there's a lot wrong with this index and this approach. Some awfully smart folks have torn it apart, and this Twitter thread is as good of a schooling as any, so if you care about why you might NOT want to put a lot of weight on SKEW, check it out.
Let's ignore the issues and take it for what it's supposed to be. So, what we have right now is a bunch of the smallest options traders in the market betting heavily that stocks are going to keep soaring, at the same time that (probably) sophisticated (probably) hedge funds are (probably) betting on a quick, big drop.
The table below shows every time in the past 22 years when small traders' call buying activity and the SKEW index were both in the upper 90% of their 3-year ranges at the same time.
If we look at the opposite scenario, when both small trader call activity and the SKEW were near the bottoms of their ranges simultaneously, it was a better setup for stocks.
So, what's the point with all this - is it a reason to worry about the next month or so?
Uhh...maybe? An uncertain adverb with a question mark is about the highest conviction we could have given the concerns shown above and the inconsistent timing with future declines. It is definitely a concern that small traders of highly leveraged, expiring instruments are so confident in stocks, and it's probably a concern that SKEW is high as opposed to low. Taken together, that hasn't been a great setup for stocks.
MOMENTUM CAN'T STOP, WON'T STOP
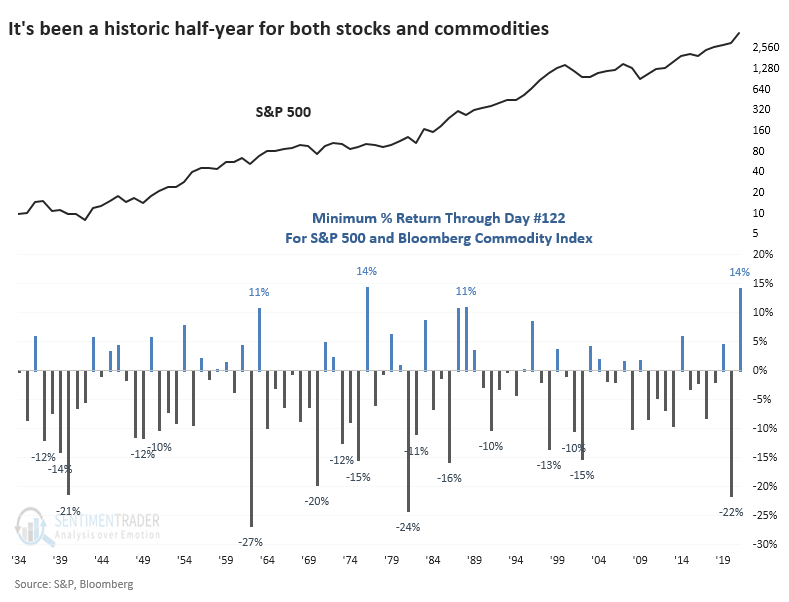
This has been one of the few times in history that both stocks and commodities have rallied so hard through this far into a year.
For stocks, in particular, it's been one of the best, most consistent, and most persistent rallies year-to-date in its history. Through the end of June, the S&P 500 has rallied more than 14%, ranking in the top 85% of all years since 1928.
A couple of weeks ago, Jay outlined what was at stake in June. Namely, if the S&P 500 managed to close above 4204, it would trigger all kinds of positive seasonal momentum. And indeed it did.
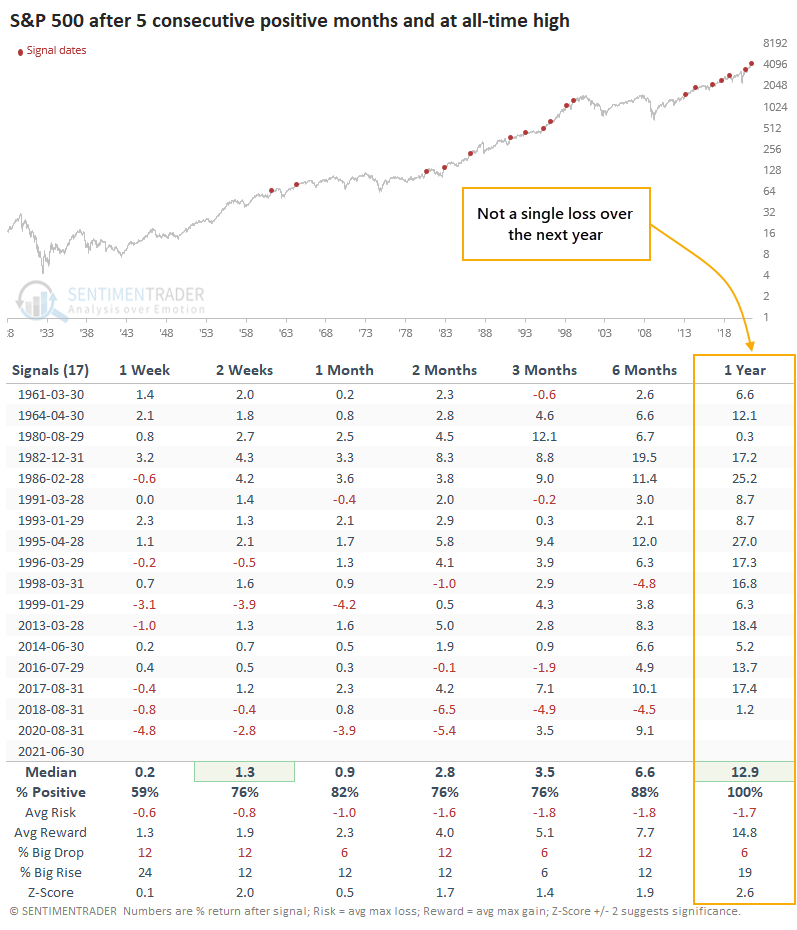
Building on what he pointed out, the S&P closed higher for its 5th consecutive month. It also notched an all-time high. Out of the 17 other times the index did this, it never suffered a loss a year later.
Much of what we've seen pop up lately has suggested another bout of higher risk, with headwinds because of breadth divergences and seasonality starting after the first part of July.
Momentum in the indexes has been remarkable, rolling over every potential negative for months now. It's gone far beyond most (any?) historical precedent, with the most common excuse being an unprecedented fiscal and monetary stimulus. Whatever the reason, momentum is winning and shows no signs of stopping, at least for a passive index investor. Under the surface, there's a lot more tumult.
STOCKS AND SECTORS - ASIA PACIFIC
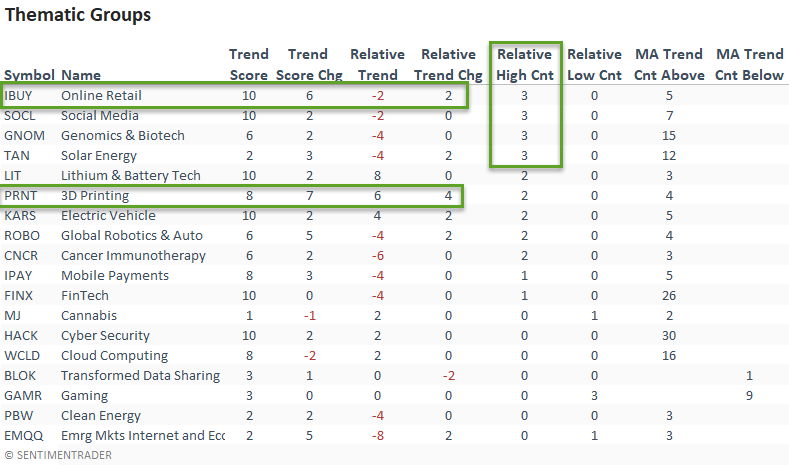
Dean updated his absolute and relative trend following indicators for domestic and international ETFs, adding the consecutive days above or below the 10-day moving average count to the indicator tables. That has interesting applications for finding mean-reversion and thrust signals as noted last week for internet stocks.
The online retail ETF looks interesting as the absolute trend score returned to a ten last week for the first time since March. The ETF registered a new relative high on 3/5 days as well. The improvement in the 3D Printing ETF is noteworthy.
Looking overseas, the percentage of Asia-Pacific countries with a positive relative trend score versus the S&P 500 has fallen to a level that suggests one should be careful with a broad-based allocation to the region. The emerging markets, which Asia heavily influences, offer a cautionary message as well.
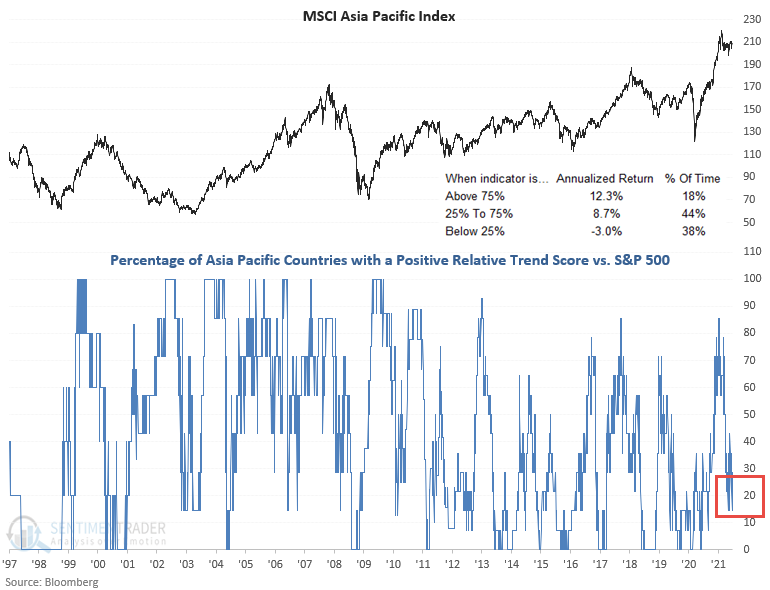
When fewer than 25% of Asia Pacific countries have a positive relative trend score, the MSCI Asia Pacific Index returns an annualized -3.0%, far below all other periods.
STOCKS AND SECTORS - EAFE
Because of the relentless performance of U.S. large-cap stocks over the past decade, international stocks have fallen off the radar for many investors. And that's not the worst thing in the world. Typically swings favoring domestic versus international - and vice versa - take years to play out.
On a shorter-term basis, Jay found two "favorable" periods and two "unfavorable" periods for the EAFE Index (MSCI EAFE Index) is an international stock index comprised of over 900 non-U.S. and Canadian companies in 21 countries.
The favorable periods include the months of October through April, as well as July. The chart below displays the cumulative % total return for the EAFE Index if held ONLY during the favorable month of July every year.
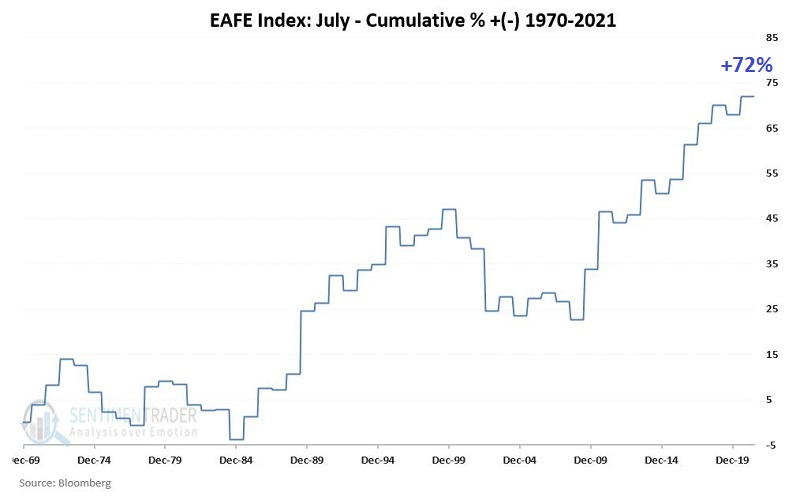
To get a better sense of the consistency of this particular seasonal pattern, note that from January 1970 through May 2021:
- $1000 invested in EAFE ONLY during the favorable months grew to $170,385 (or +16,984%)
- $1000 invested in EAFE ONLY during the unfavorable months declined to $438 (or -56%)
The EAFE Index can be traded via the ticker EFA (iShares MSCI EAFE ETF).
STOCKS AND SECTORS - AIRLINES
Dean monitors the new lows list across various durations daily. This week, it's been flashing a heads-up warning on the reopening travel trade. Airlines, cruise lines, and hotels are dominating the list.
While most travel-related stocks are weak, the airlines stood as the group has now traded below its 10-day moving average for 21 consecutive days.
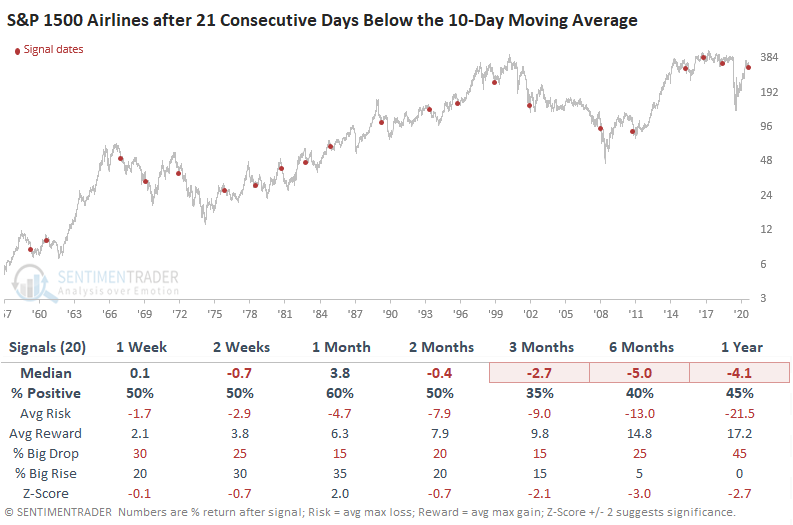
The results suggest the airlines could see a mean reversion bounce based on the 1-month timeframe. If a bounce materializes, one would want to avoid the group as the intermediate to long-term results look unfavorable.
| BONDS | ||
 | ||
Jay outlined a contrarian setup in bonds.
The chart below displays the Annual Seasonal Trend for ticker TLT. Note that we are entering what has typically been a very favorable time of year for long-term treasuries.
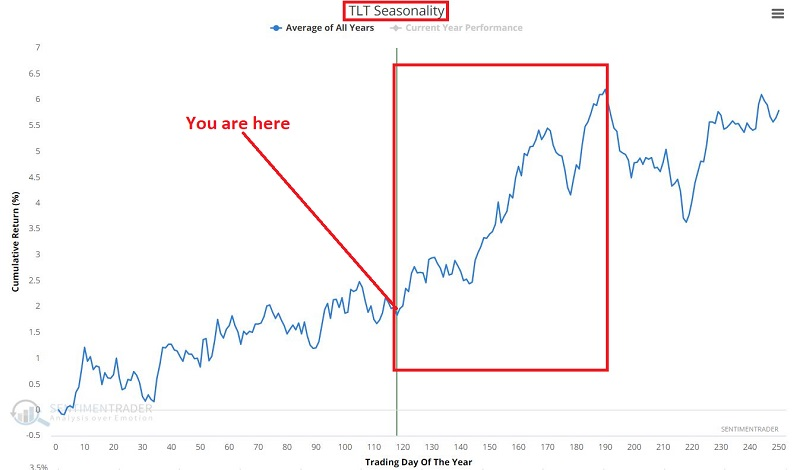
As always, seasonality does NOT tell you what will happen, only what has tended to happen in the past. Nevertheless, the main point is that IF long treasuries are going to rally, the months directly ahead would be as likely a time as any for this to occur.
High bullish sentiment readings are typically an unfavorable sign for the security under analysis. Generally, a high Optix reading suggests "too many bulls," who have likely already bought, and thus a lack of potential new buyers who can come in and drive a given security higher.
Still, every once in a while, a burst of optimism can change the trajectory for a given security. In the test below, we look for those times when:
- TLT is below its 200-day moving average
- TLT OPTIX tops 90% for the first time in 126 days
The chart below displays the small handful of signals that have occurred.
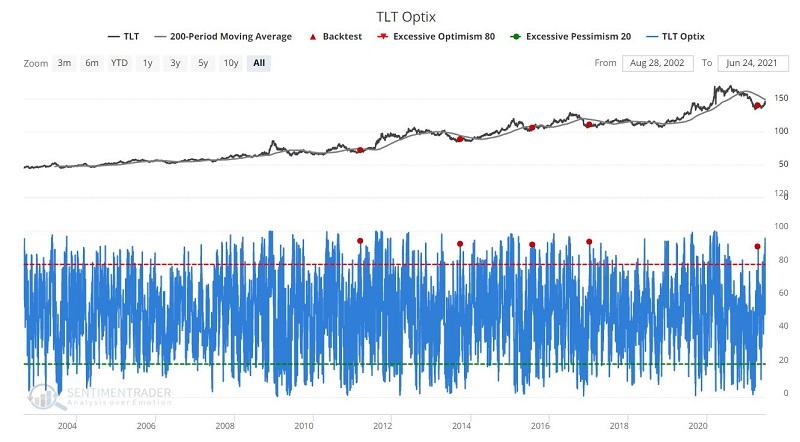
On the one hand, it must be noted that this is a very small sample size from which to draw any definite conclusion. That said, the results are compelling. In the short term, TLT performance following previous signals was below average. However, in the 6 to 12 months after a signal, TLT has responded quite favorably. The results appear in the table below.
The most straightforward play for a trader wishing to play the long side of long-term treasuries would be to take a long position in T-Bond futures or buy shares of ticker TLT. Both of these positions entail a significant amount of financial commitment and/or dollar risk.
An alternative is to execute an options strategy typically referred to as a "diagonal out-of-the-money calendar spread." Using a specific set of options on TLT, this trade would carry maximum risk of only $418, and take less than 3% of the capital to enter a trade using shares of TLT.
There is a possibility that bonds might surprise everyone despite all of the current concerns weighing on the bond market. And there are less capital-intensive possibilities in terms of "ways to play" versus trading futures or making a large dollar commitment to buy ETF shares.
| COMMODITIES | ||
 | ||
It's been a heckuva year, and it isn't even July. Not only have stocks enjoyed an almost uninterrupted advance, but even lowly commodities have rallied hard.
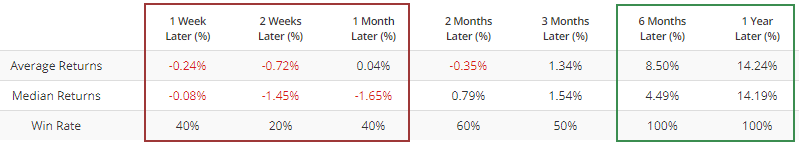
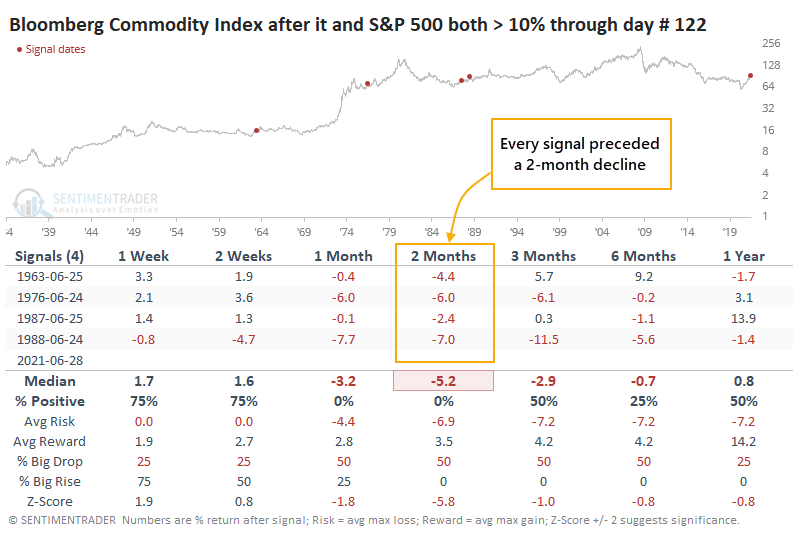
When we look at year-to-date (YTD) returns approximately through the end of June, this year stands out above all others. The S&P 500 and the Bloomberg Commodity Index have each rallied at least 14.2% YTD, surpassing 1976 as the best combined year for the two asset classes.
For commodities, it preceded more consistent weakness, with losses each time over the next two months.
Surely, it's hard to put much weight on a sample size of four, so if we relax the parameters to include any year when both assets were up at least 5% through this part of the year, we can triple the sample.
Over the past 60 years, the Bloomberg Commodity Index declined over the next 1 - 2 months every time but once. There are quite a few headwinds for commodities currently, and this appears to be another.
SILVER OPPORTUNITY
Jay notes that part of his job is to help people "think like a trader." One problem is that no two people look at the markets in exactly the same way. So, where one person sees opportunity, another person sees risk (come to think of it, that is kind of why the markets exist in the first place).
What follows is not a "recommendation," but simply the assertion of one perspective as an example of one way to play a particular situation. You are encouraged to decide for yourself if the idea truly holds any merit.
The chart below displays the Annual Seasonal Trend for ticker SLV (iShares Silver Trust ETF).
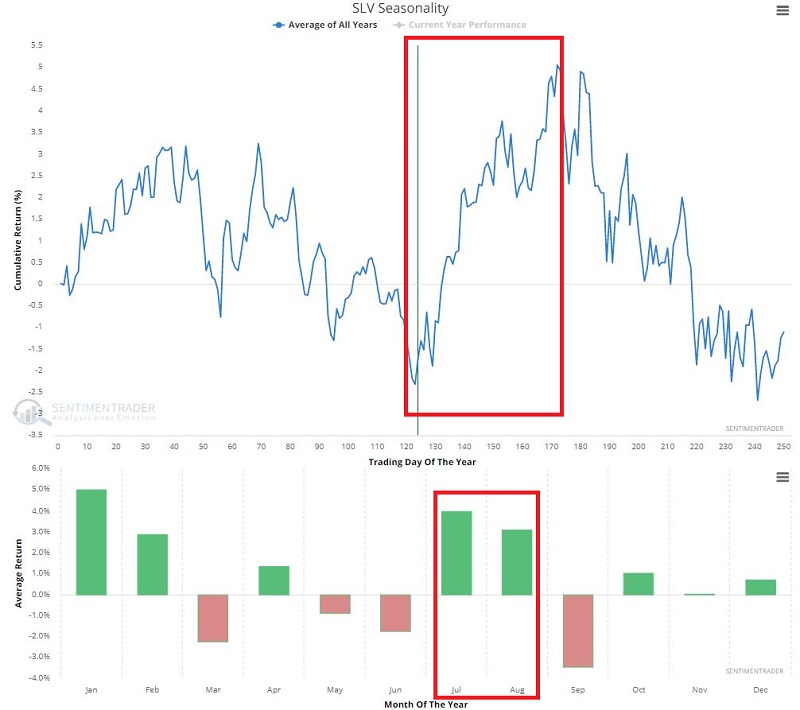
As you can see, we are entering a purportedly favorable time of year for silver.
The chart below shows a bar chart for SLV and the Implied Volatility for SLV options (black line). IV is not rock bottom, but it has come down a great deal from the levels in 2020 and early 2021.
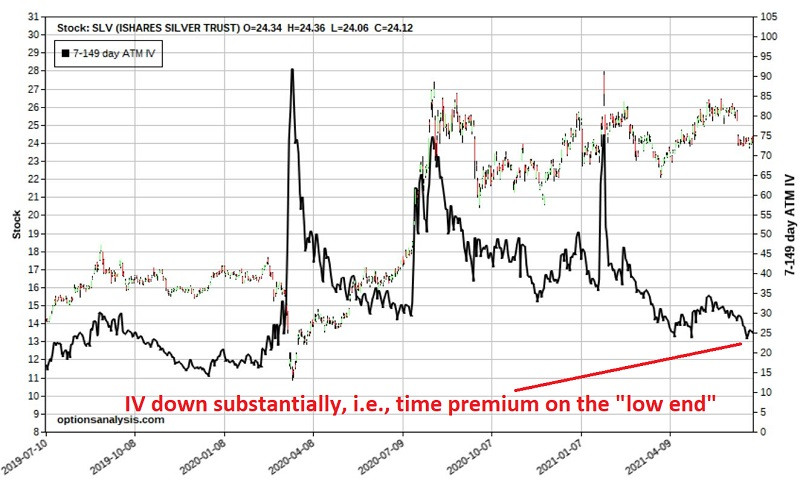
This matters because this reduction in IV tells us that the amount of time premium built into the price of SLV options has declined dramatically and that buying premium is a viable approach. If we take the most simplistic position possible and buy call options, the low IV and positive seasonality set up a favorable risk/reward opportunity.
Is this a "good" trade or a "bad" trade? Well, the merit of most trading opportunities is strictly in the eye of the beholder. A trader who expects SLV to break to the downside could just as easily buy 2 September 2021 $24 put options to profit from a decline in the price of SLV shares.