
TradingEdge for Apr 30 - Sentiment is extreme but ebbing

The goal of the Weekly Wrap is to summarize our recent research. Some of it includes premium content (underlined links), but we're highlighting the key focus of the research for all. Sometimes there is a lot to digest, with this summary meant to highlight the highest conviction ideas we discussed. Tags will show any symbols and time frames related to the research.
| STOCKS | ||
 |  |  |
The biggest story in equity markets last fall was the massive rise in speculative activity heading into late August and early September. A quick correction in some of the most targeted stocks wiped much of that away.
Even with some major, broader indexes once again knocking on the door of record highs, speculative behavior continues to pull back a bit. The ROBO Put/Call Ratio (Retail-Only, Buy-to-Open) has increased from its lows, which isn't saying a whole lot, though, since even with the rise in the ratio, it's still well below historical extremes.
Large traders also reduced their call buying last week, so the overall Options Speculation Index has dropped quite a bit from the peak. In February, bullish options strategies like buying calls and selling puts accounted for 75% more volume than bearish strategies like selling calls and buying puts. Last week, that was down to "only" 37%.
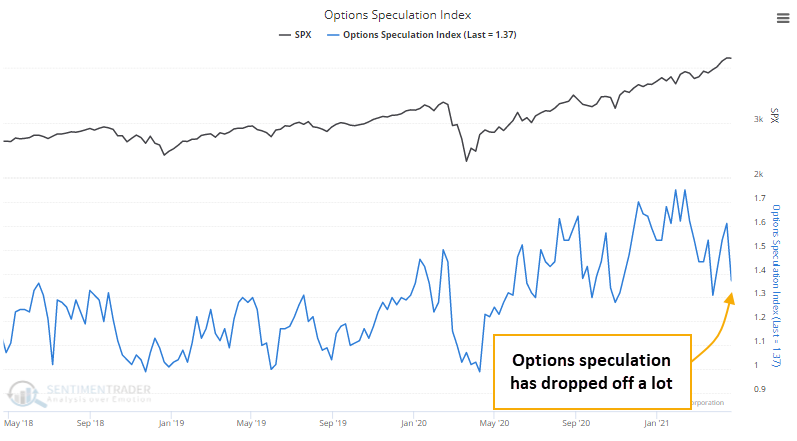
While down considerably from February's peak levels, the amount of speculation among options traders remains among the highest of any weeks in the past 20 years, prior to 2020.
BIG MONEY, AND CONSUMERS, ARE AWFULLY CONFIDENT
With options traders helping to keep stocks soaring, Big Money thinks they're going to keep going. The latest semi-yearly survey of large money manager sentiment from Barron's shows a near-universal sense of optimism.
The poll of more than 150 managers, controlling hundreds of billions in assets, revealed that 67% of them think stocks will keep rising in the months ahead, while only 7% think they will fall. That's the 3rd-highest percentage of bulls, and the 2nd-lowest percentage of bears, since 1999.
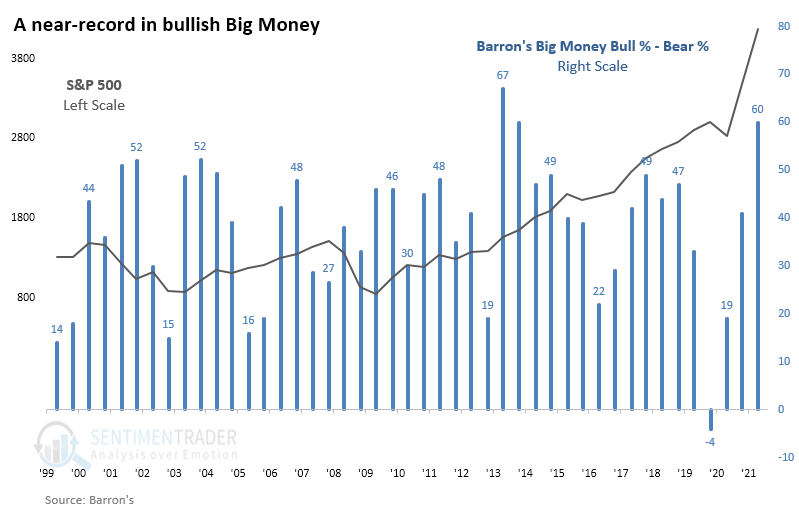
When Big Money has been optimistic - even wildly so - stocks didn't show a strong consistency to deflate those expectations. It might be a minor worry about the next 6 months, given that they're showing near-record optimism, but it should be nothing more than that.
It's not just the Big Money that's showing near-record levels of optimism; the average U.S. consumer is, too. The latest survey of U.S. consumers by the Conference Board showed another massive spike in confidence, with the largest 2-month increase in the survey's history.
The University of Michigan does a similar survey with more granularity.
It takes some major chutzpah to be 100% confident that stocks will rally, and yet for the past two months, 13% of consumers were exactly that confident. Over the past couple of months, a very high percentage of consumers are at least 75% confident that stocks will rally, versus a tiny percentage who are only 25% or less confident.
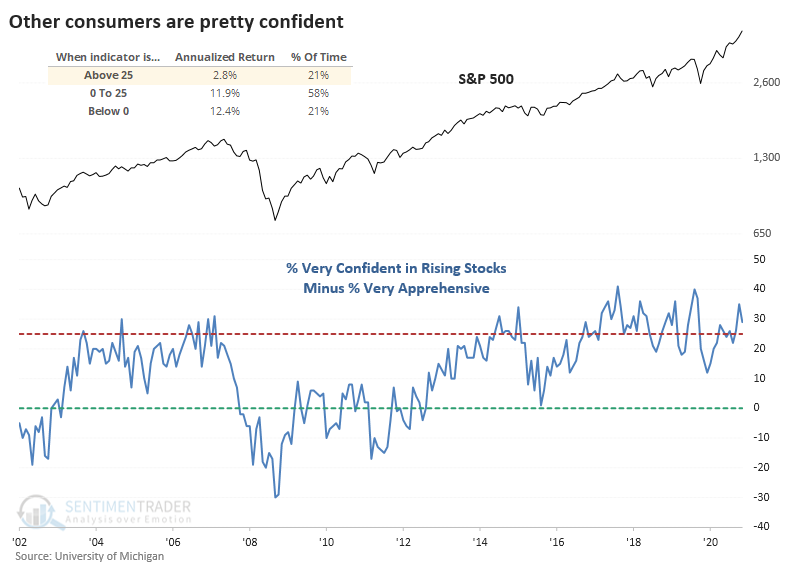
While there are only 20 years of history for this survey, the S&P's annualized return following extremes shows a solid contrary bias. When the net percentage of very confident versus very apprehensive consumers was above 25%, as it is now, the S&P showed a return of only 2.8%, versus +12.4% when there were more apprehensive than confident folks.
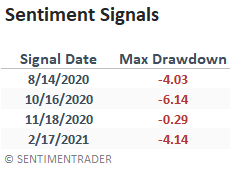
Dean noted that sentiment is starting to ebb from an overly optimistic level.
With an update to one of the components in the sentiment composite model, the 5th warning signal since the pandemic low in March 2020 triggered this week.
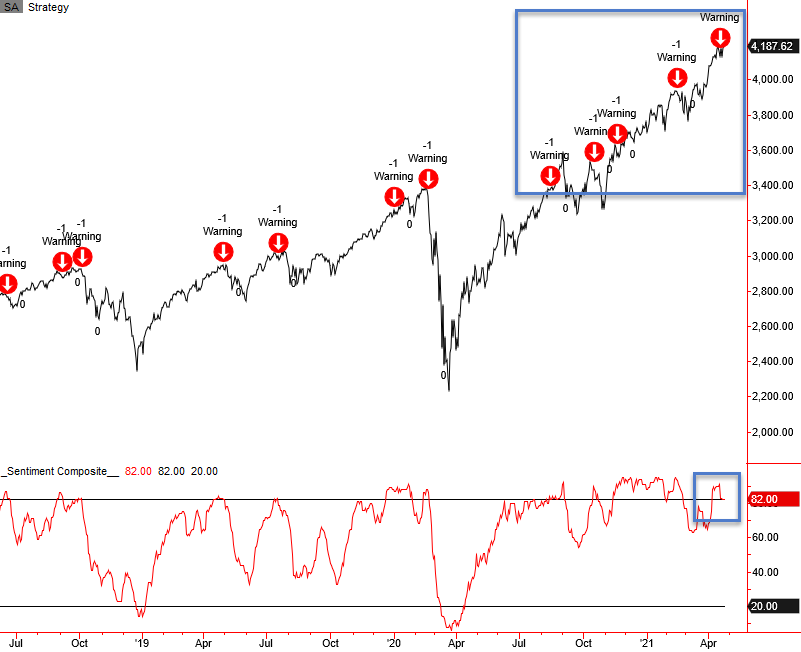
So far, the warnings have led to small consolidations. Strong market breadth, which is a function of liquidity, continues to overshadow the optimistic sentiment conditions. Below, we can see the S&P 500's drawdowns after other recent signals.
FUNDAMENTAL IMPROVEMENT
The strong price momentum over the past few months has come with underlying fundamental improvement. Dean did a deep dive on leading indicators across the globe.
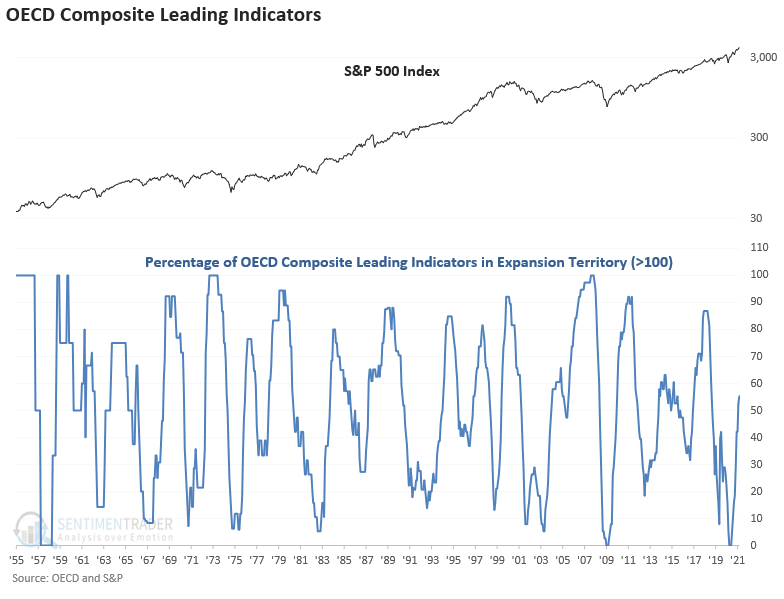
The composite leading indicators time series from the OECD provides a big-picture perspective that helps block out day-to-day noise. As a general rule, leading economic indicators provide the best risk/reward profile for the stock market when they increase from contraction territory.
Most countries maintain composite leading indicators that are rising in expansion territory. The United Kingdom and Denmark are bucking the trend with a contraction and a falling 3-month trend.
The following chart contains the percentage of countries in expansion territory. The indicator crossed above 50% at the end of February and has maintained that level with the March update and revisions.
Let's see what happens if we buy the S&P 500 when the percentage of countries in expansion territory crosses above 50%.
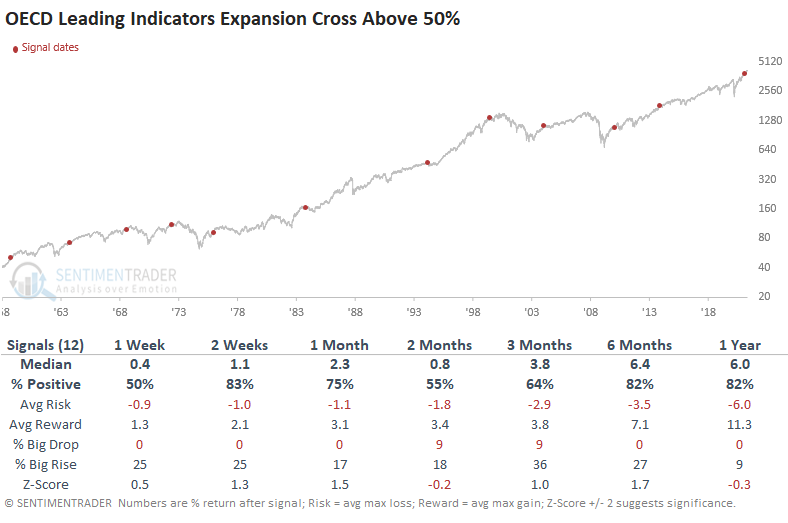
Over the next year, the S&P 500 showed a positive return after 10 out of the 12 signals, even if the medium-term returns were "meh."
One wrinkle is that many of the country LEIs have shown remarkable month-over-month growth for many months now. When this diffusion index has started to decline, then it has preceded much poorer returns. As long as the LEI data maintains a level above 85%, the backdrop for the stock market should remain constructive.
MOMENTUM HAS RULED ALL
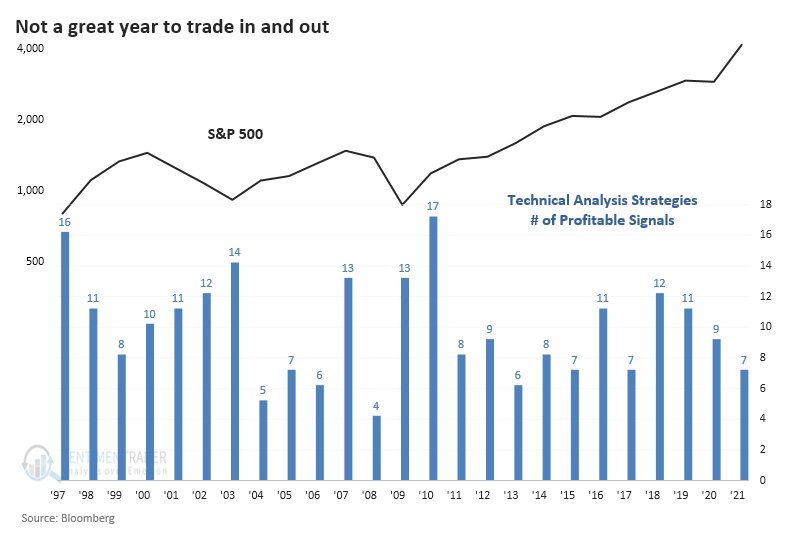
These momentum signals have meant that there has never been a worse time to be a technician.
Out of 22 technical trading strategies followed by Bloomberg, only 7 have shown a profit in 2021. That's among the fewest in 25 years.
Going back as far as we can using daily backtesting data, this year is among the worst for using technical trading strategies through April. In 2008, only 4 strategies showed a YTD gain through April, while in 2010, almost all of them did.
Out of the 7 years, 4 of them showed a negative return either 2 or 3 months later, 2 of the others sported only meager or temporary gains, while the last one, in 2017, preceded the nothing-matters market that ran over everything.
Out of the 6 years with the worst trading environments through April, 5 of them showed either a negative or barely positive return in the months ahead, again with 2017 being the only real exception.
We still see a type of conflict that hasn't really happened before. Many of the measures related to thrusts, momentum, and breadth are the types that only trigger during the first phase of a multi-year bear market recovery. But most of the sentiment-related measures have generated signals that typically only trigger near the ends of multi-year bull markets.
There have been some recent wobbles and divergences, but not enough to manifest in broad-based deterioration that would trigger some of the warning signs we watch for after investors become overly optimistic. A typical market response to lesser conflicts has been choppy conditions in major indexes, with further gains eventually given back. That's been the outlook for a while and it continues.
STOCKS AND SECTORS - ENERGY AND FINANCIALS
Momentum in the broader market has been strong enough to overrule the sentiment extremes over the past few months. It's not just evident in the broader market. Dean also did a comprehensive look at relative and absolute trends in sector, industry, and country ETFs.
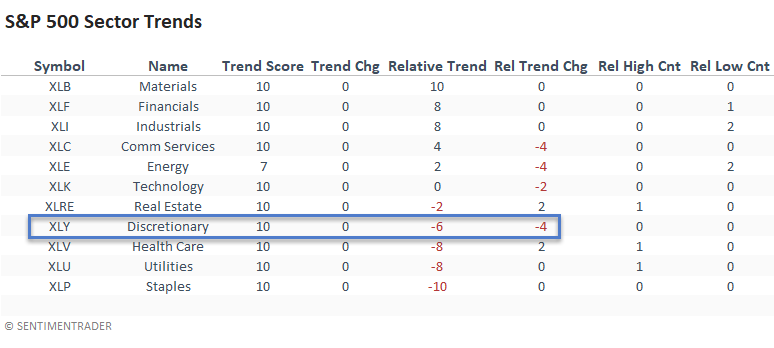
The absolute trend scores for all sectors look exceptional, with 10 out of 11 groups posting a perfect score. One should expect this type of profile in a bull market.
When we look at the relative trend score, we see a more mixed bag. While it's not a surprise to see the traditionally defensive groups with negative relative trend scores, the consumer discretionary sector deserves attention. Typically, it performs well on a comparable basis in year two after a bear market bottom.
Among industries, homebuilders, capital markets, and insurance ETFs were the leaders, while pharmaceuticals lag. Among countries, Ireland, Netherlands, and Sweden are leading while Switzerland brings up the rear.
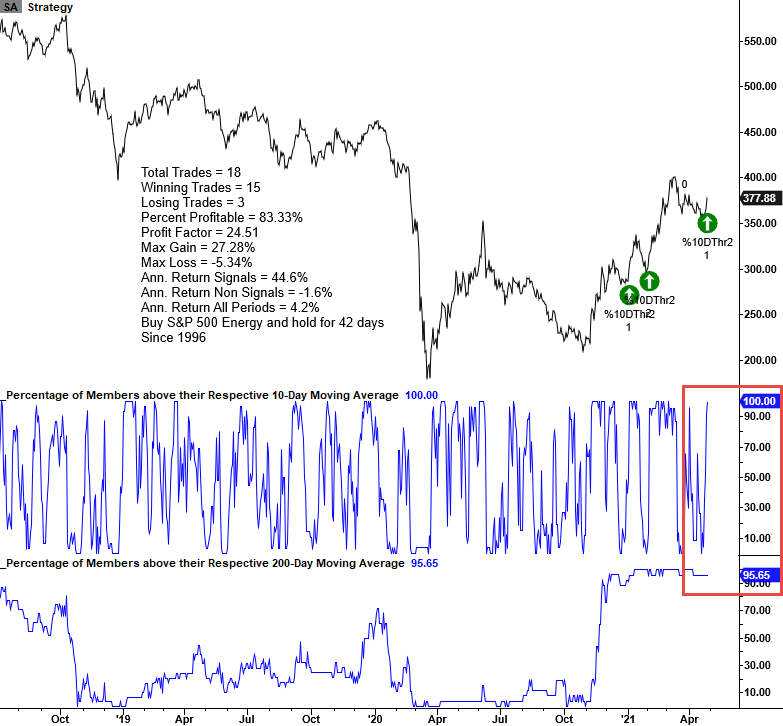
Dean highlighted another positive breadth thrust for energy stocks. This is another in what has been a string of them since the bottom last fall.
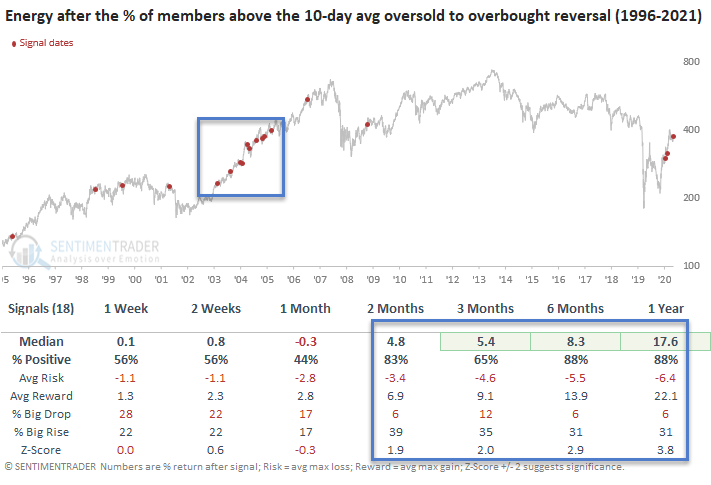
The oversold to overbought reversal signal identifies instances when the percentage of members trading above their respective 10-day moving average reverses from oversold to overbought within a week.
The signal gets even strong when considering that more than 90% of energy stocks are also trading above their 200-day moving averages.
Returns in energy stocks were highly positive over the next 2-12 months, with several notable z-scores. While the 1-month timeframe is unfavorable, recent signals look better.
Financials have been on a heckuva run. So much so that more than half of them hit a 52-week high on Thursday.
There were 3 other similar thrusts in recent months. Because of this, over the past 50 sessions, an average day has seen nearly 20% of the stocks hitting new highs. This is one of the highest averages in more than 20 years.
The Backtest Engine shows that there were essentially 3 distinct times in the past 20 years when financials went on a run like this.
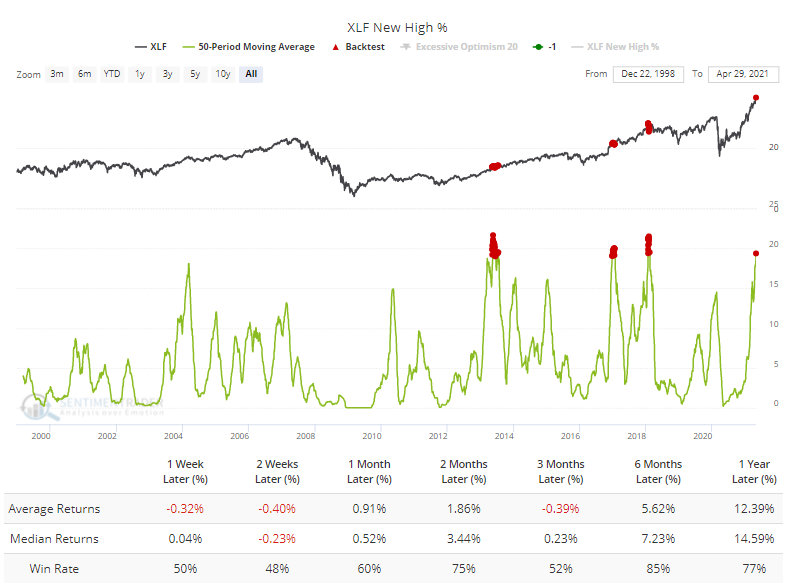
Short-term returns were weak, then choppy in the months ahead. Long-term returns were still good, thanks to the momentum. When we zoomed in on each of the precedents, we saw a 3-6 month stretch after each of them when XLF struggled to hold gains.
| BONDS | ||
 | ||
Very few investors are aware of the seasonal nature of the bond market. In actuality, some of it has to do with the stock market. It is widely known that the stock market has historically performed significantly better during November through April than during May through October.
Is there a way to take advantage of this in the bond market? Jay took a closer look.
He looked at the performance of high-yield corporate bonds and intermediate-term (3-7 year) treasuries during two distinct 6-month periods: November through April and May through October.
For testing - and to generate as long of a backtest as possible - he used monthly total return data for the following two mutual funds from the end of April 1979 through the end of March 2021:
- Ticker VWEHX (Vanguard High-Yield Corporate Fund Investor Shares)
- Ticker FGOVX (Fidelity Government Income Fund)
The chart below displays the cumulative returns for VWEHX and FGOVX if held ONLY during May through October, from 1979 through 2020.
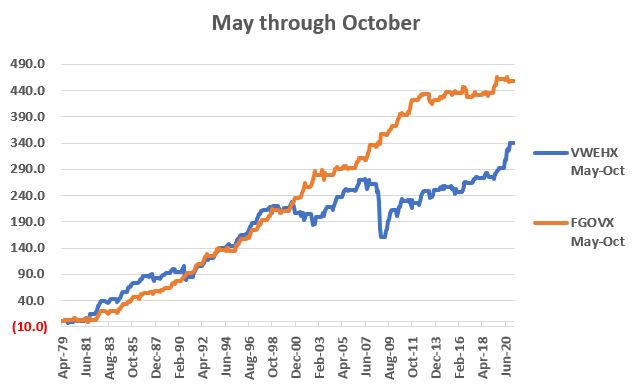
With the calendar inching towards May, investors might look for the winds of change to blow a bit in the bond market (i.e., to favor intermediate-term treasuries) in the months ahead.
Jay also noted that the ratio between the price of gold and the price of copper is useful in identifying the trend in interest rates. The correlation between the ratio and 10-year Treasury yields is -0.62 over the past 30 years (a correlation of +1.00 means perfectly correlated, and a reading of -1.00 means perfectly inversely correlated).
Since bond prices move inversely to yields (i.e., as yields rise, bonds prices fall), and the gold/copper ratio is inversely correlated to yields, then the gold/copper ratio should be positively correlated to bond prices. Therefore, a rising gold/copper ratio should be accompanied by a higher 10-year bond price and vice versa.
To determine if the gold/copper ratio is rising or falling, Jay used a 30-day moving average minus an 80-day moving average of the ratio. If it's above zero, then gold is outperforming copper, and it should be bullish for bond prices.
The chart below displays the hypothetical growth of equity achieved by holding a long position in 10-year treasury futures depending on whether the gold/copper ratio (using the 30-day/80-day averages mentioned above) is positive (blue line) or negative (red line).
- Blue line = $ P/L long 10-year note futures if on a "buy" signal
- Red line = $ P/L long 10-year note futures if on a "sell" signal
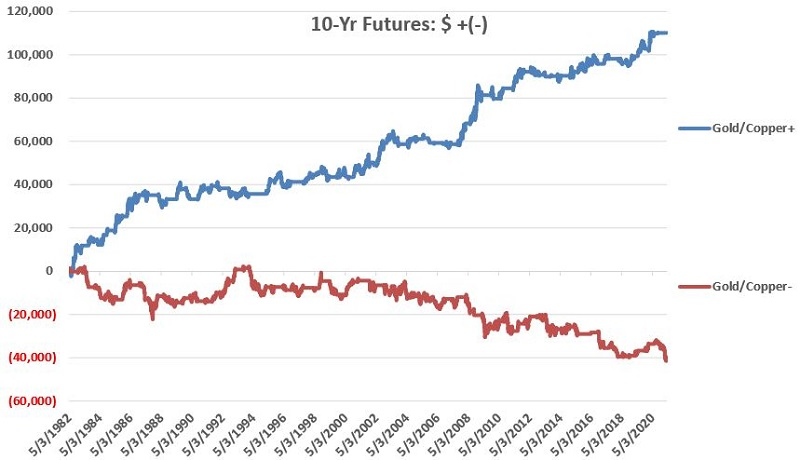
So is this the "be all, end all" of bond trading methods? Not at all. How future results might play out if we eventually transition into a bona fide rising rate environment is essentially impossible to know.
| COMMODITIES | ||
 |  | |
Many commodities have rallied quite sharply in recent months. Given rising concerns over inflation and the vast underperformance of commodities relative to stocks in the past decade, it should not be surprising to see commodities stage a continued advance in the years ahead.
But nothing moves forever in a straight line, and Jay showed why we need to pay attention to copper.
In the chart below, we can see that copper has experienced a terrific advance since the low in March 2020, having rallied over +125%.
But a few warning signs are gathering for this important metal. In the chart below - borrowed from Dean - we see what has happened to the copper market after similar "thrusts" such as those we recently saw. On some occasions, the "party" continued; other times, a sharp pullback followed.
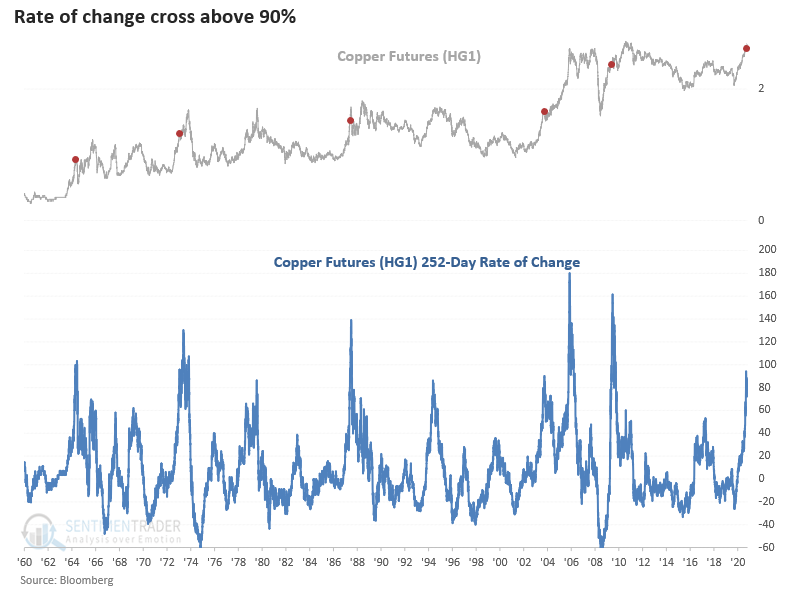
Another potential concern is the onset of a seasonally unfavorable period for copper starting forthwith on the close of trading on April 28th.
Does any of this mean that copper is doomed to suffer a pullback in the weeks ahead? Not at all. Sometimes a market will just run, and nothing will stand in its way. Copper may be in the midst of just that type of advance.
But if copper fails to follow through in the near term, a better buying opportunity may come around closer to the end of May.
Jay also looked at U.S. dollar vs. euro seasonality heading into May.
The U.S. dollar has been fragile in the last year. Meanwhile, in the short run, traders might look for a respite during May. Historically, the dollar has shown a tendency to show strength during May, and - just as importantly - most foreign currencies have shown persistent weakness during May.
The chart below shows the annual seasonal trend for the U.S. Dollar. Notice the "island" uptick in May.
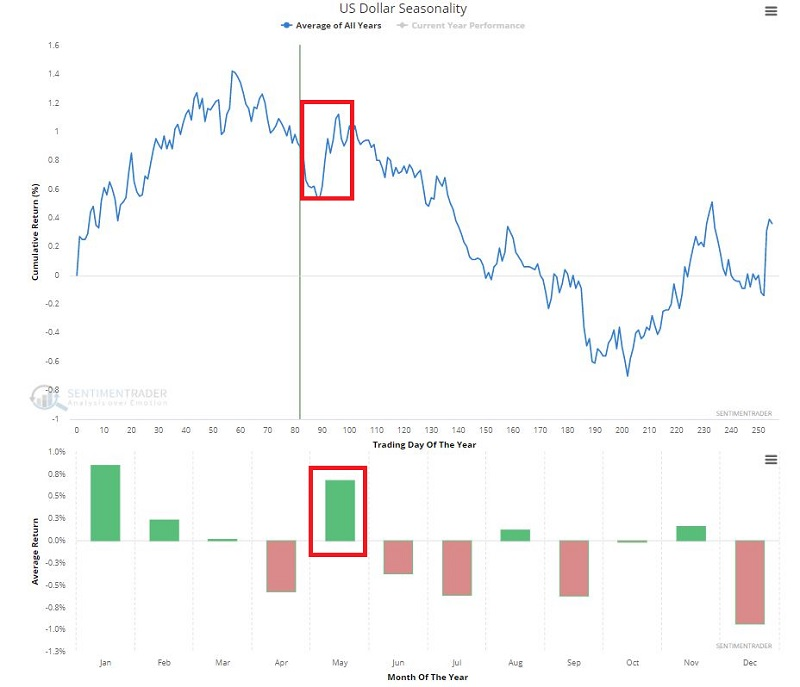
None of the above results by any means insure a dollar rally (or euro decline) in the month ahead. But if the dollar will recover from its recent slump, the historical odds appear to favor it doing so during May.