TradingEdge: A strong start even as economic data plunge

This is a recap of the most notable research published during the week. The week started strong, and small-caps along with several sectors recorded record or near-record optimism. The readings we've seen in recent weeks have typically led to short- to medium-term struggles, but more positive out a year. It's especially challenging now given where we are in the calendar, during a down year.
If there is a piece of research that hadn't been published by Friday, you'll see a [NEW] tag.
Starting strong, especially small-caps
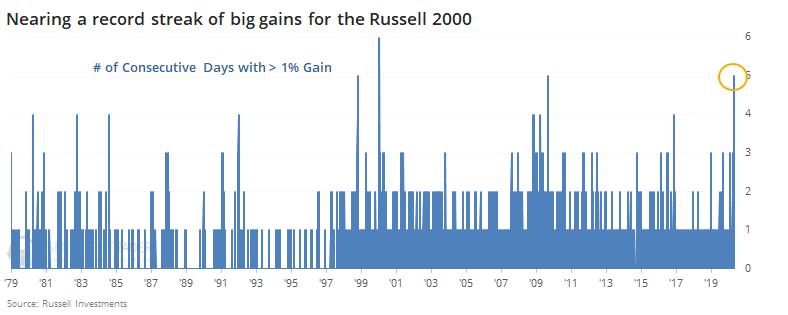
Small-caps roared on Monday, and as of Tuesday, the Russell 2000 managed to gain more than 1% for five consecutive days, approaching a record streak of big daily returns.
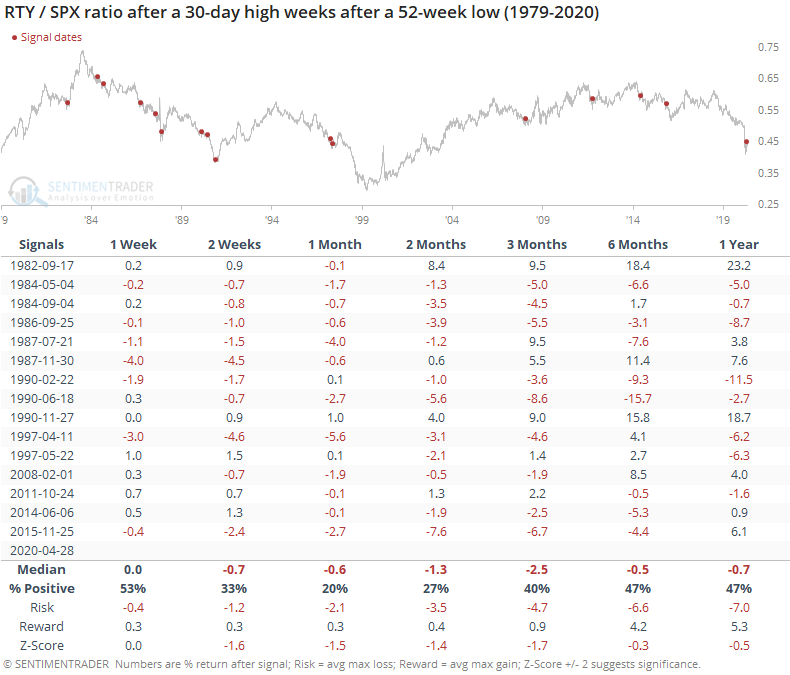
Because of this surge over the past week, the ratio of the Russell 2000 (RTY) to S&P 500 (SPX) has surged to a 30-day high, after falling to yet another multi-year low in March. This is taken as a universally good sign, but no matter how much it might make theoretical sense, empirically the evidence is mixed at best.
Because of the generally negative trend in small-caps relative to large-caps in recent decades, future returns were consistently negative.
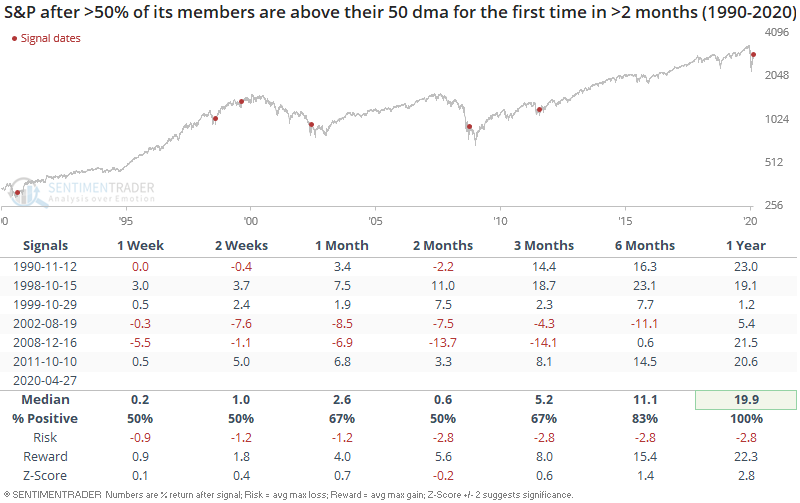
The same pattern went for the equal-weight S&P index versus its cap-weighted cousin. The S&P 500 Equal Weighted Index has crossed above its 50-day moving average, pushing the percentage of S&P 500 members above their averages above 50%, along with more and more sectors including some of the most defensive ones.
When more than half of the S&P's members reclaimed their medium term moving averages for the first time in more than 2 months, the S&P often fell back in the short term. However, this usually led to more gains over the next 6-12 months:
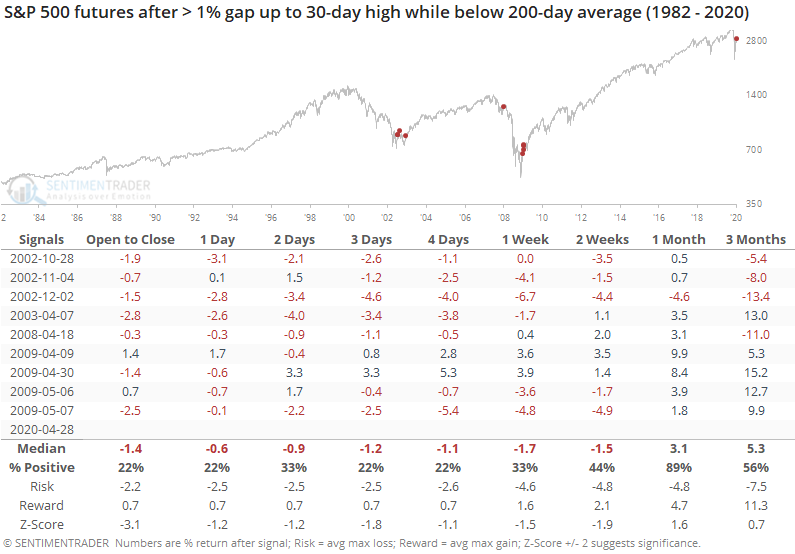
During the week, investors kept pushing stocks higher overnight, leading to a record string of gap up opens. Short-term returns have been extremely volatile with a downside bias after similar behavior. The same holds true when stocks enjoyed so many days with 1% gains.
Sentiment still hesitant, mostly
Some big money managers took advantage of the lower prices in February and March by becoming a little more constructive. If we look at it in terms of a Bull Ratio (Bulls / Bulls + Bears)) then the current ratio of 66% in the Big Money means that fewer than two-thirds of the managers are optimistic. That's well below the long-term average of 77% and still ranks among the lowest in more than 20 years.
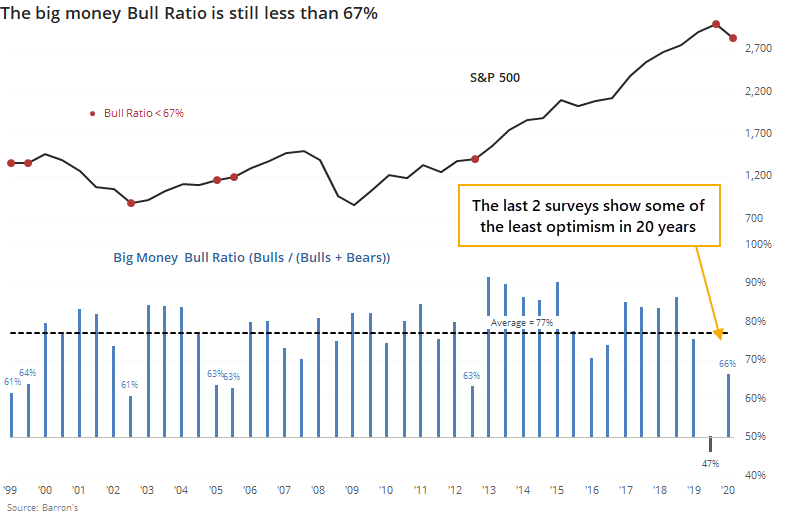
The S&P mostly rose after similarly low ratios, though technically we're still on this signal since it triggered last October. If we look at returns following any survey when the Bull Ratio was less than 67%, they were above average, with a decent risk/reward ratio over the medium-term.
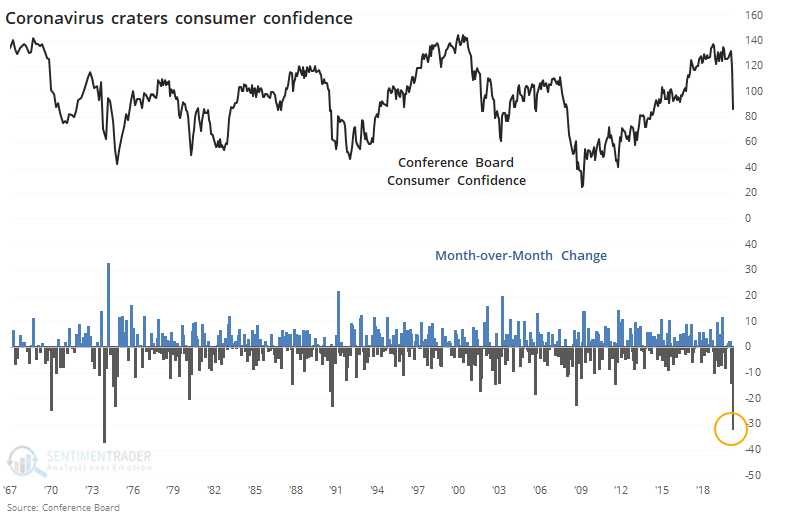
The latest release of Consumer Confidence from the Conference Board shows that attitudes flipped in a major way in April. From a near-record level, Confidence dropped more than 30 points in a single month. That's the 2nd-largest monthly decline since 1967.
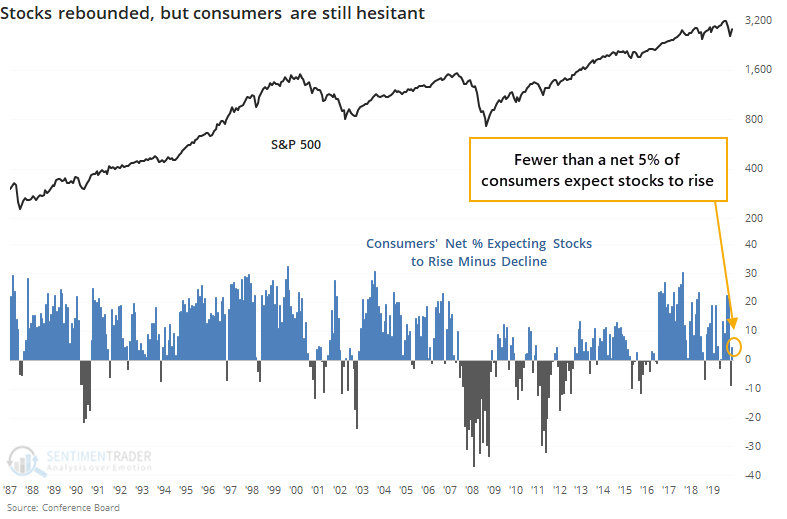
Even though stocks rebounded more than 10% in April, maybe they hadn't rallied enough for most consumers to notice during the study period. More of them became optimistic specifically about the stock market during the month, but still, only a net 4.6% of them expect stocks to keep rallying.
Both bulls and bears could point to something there, which isn't very helpful. Probably the biggest takeaway is that it should be a positive going forward, but if prices start to show a pattern of lower lows, then the precedents are decidedly negative.
Investors have been shoving money into the safety of money markets on a scale never before seen. In March alone, they moved nearly $700 billion into these funds, more than four times any prior monthly inflow. As a percentage of the asset base, the jump in March was still by far the most in 35 years.
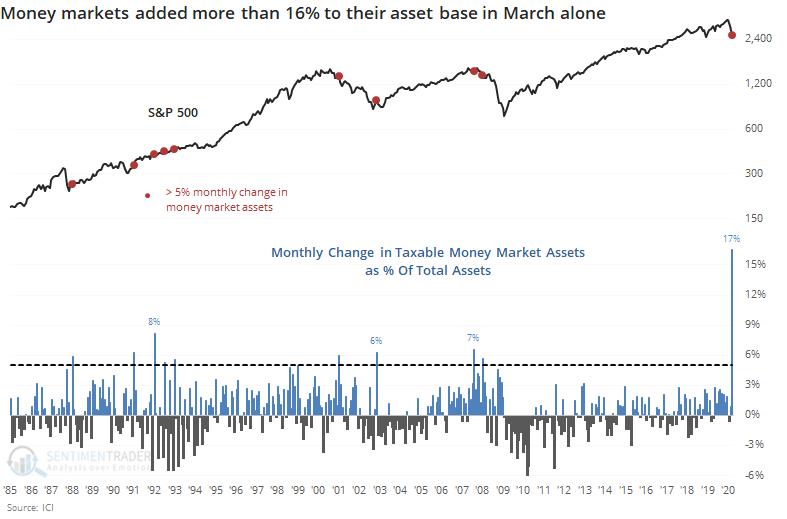
The record of these flows is not consistent as a predictor. It led to universally higher prices prior to the last two bear markets, when it was woefully early.
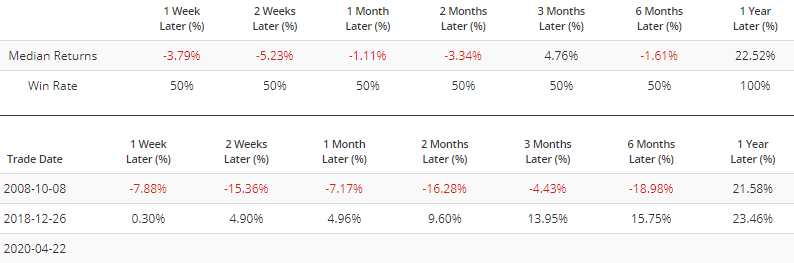
[NEW] Troy notes that although fund flow data is extremely popular, it's often inconsistent, particularly among less popular ETFs. It's generally better to look at longer-term time frames and focus on broader funds. The 5-week average for equity mutual funds and ETFs around the world is at -$4.9 billion. Such outflows were only exceeded by the 2008 crash and the 2015-2016 market panics (particularly in emerging markets):
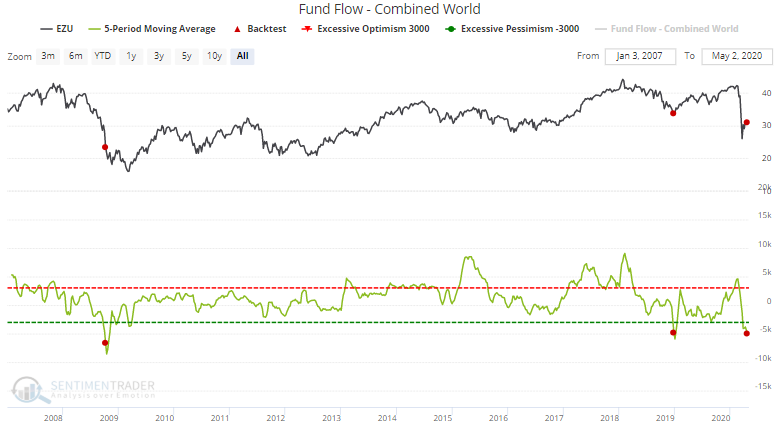
While this could lead to short term losses, both historical cases led to more gains for global equities over the next year:
Economic data start to show the damage
The drop in optimism among consumers and investors is not hard to understand given the plunge in economic data.
[NEW] Troy points out that as GDP reports and economic data continue to print shocking numbers, the number of media stories mentioning "contraction" remains near an all-time high. The previous high came in February 2009, weeks before the U.S. stock market hit bottom.
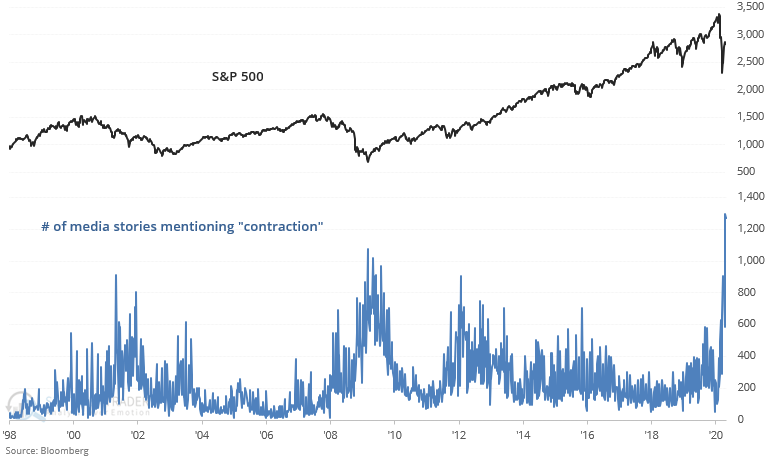
It's not hard to find the reason why contraction is such a popular topic, giving this week's horrid economic readings like GDP. Below, we can see returns in the S&P 500 after GDP plunges 4% or more. The dates are moved forward one month to account for the lag in release times.
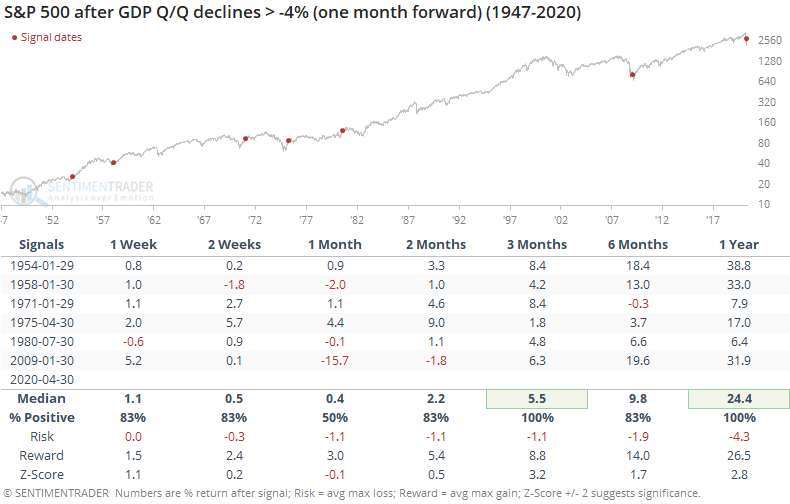
With anything related to stock movements or economic data during this cycle, there should be a blanket caveat that we've never seen anything quite like this since the popularization of auction markets. But if we can make the very general assumption that investors behave more or less consistently to terrible economic data, then these readings should be a long-term positive.
Bad timing, though
Unfortunately, this is hitting just as we enter the worst 6 months of the year, which have been particularly bad when stocks were already struggling.
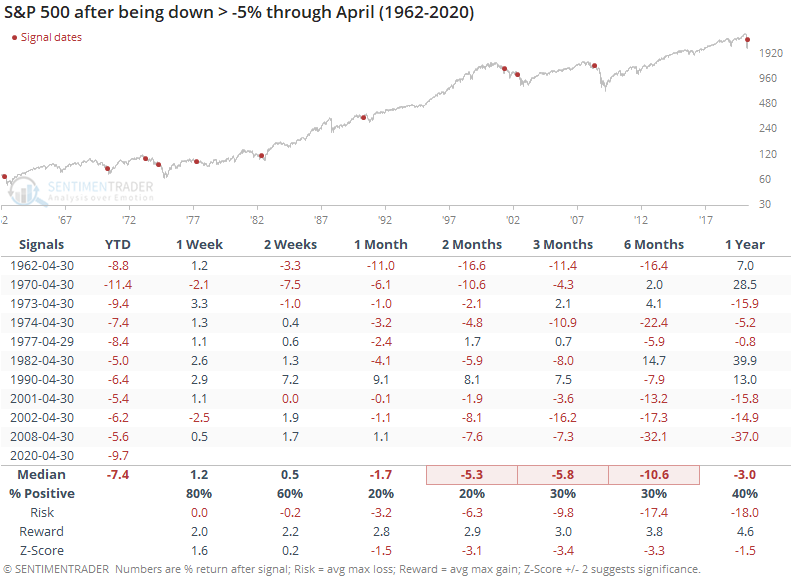
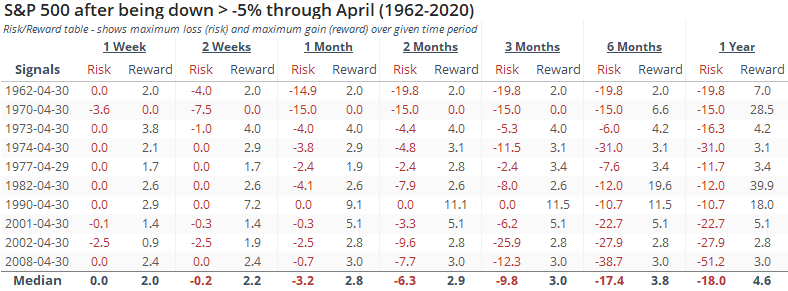
The risk/reward table for these years was unpleasantly red. Only two years, 1982 and 1990, showed more reward than risk over the next 6 months.
Sector and asset extremes
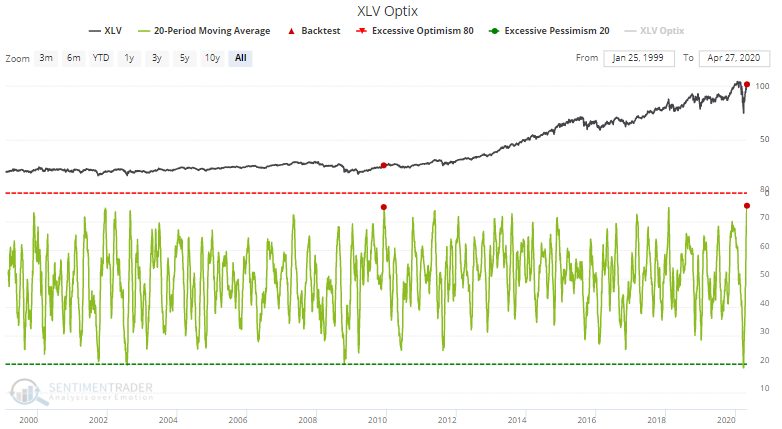
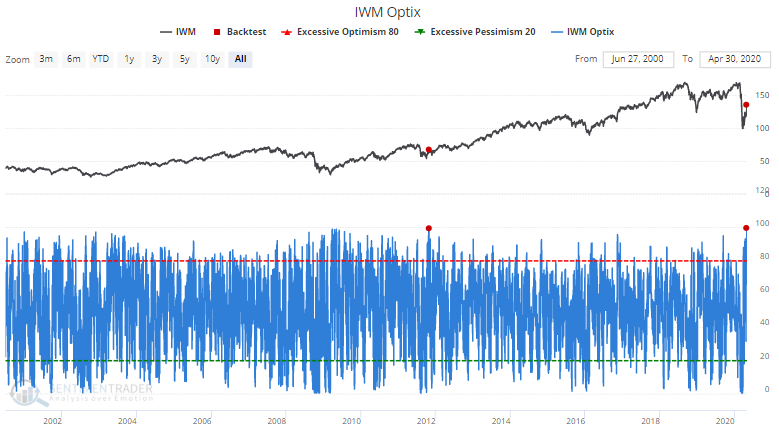
Sectors continued to push forward, leading to record or near-record readings in their Optimism Indexes.
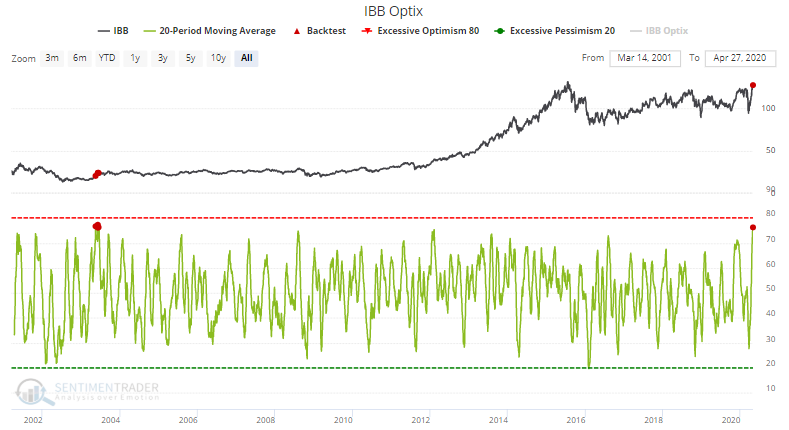
For IWM, it was the highest ever.
[NEW] Troy shows that it's not just sentiment across some U.S. sectors that are extreme (tech, healthcare, etc). Sentiment is starting to creep up overseas. For example, Canada Optix's 20-day average is at 72:
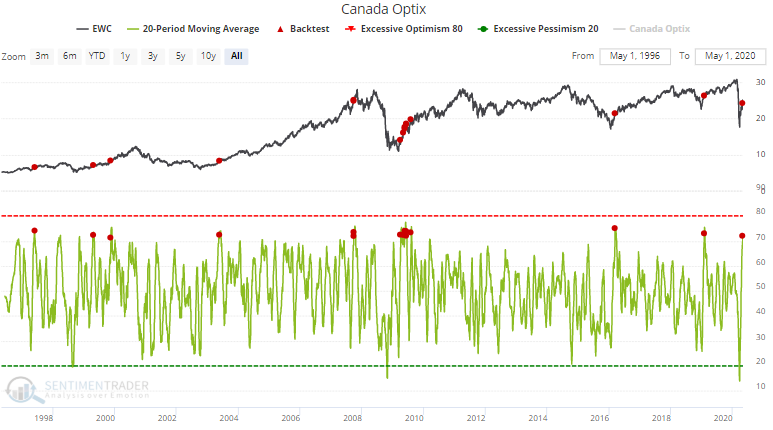
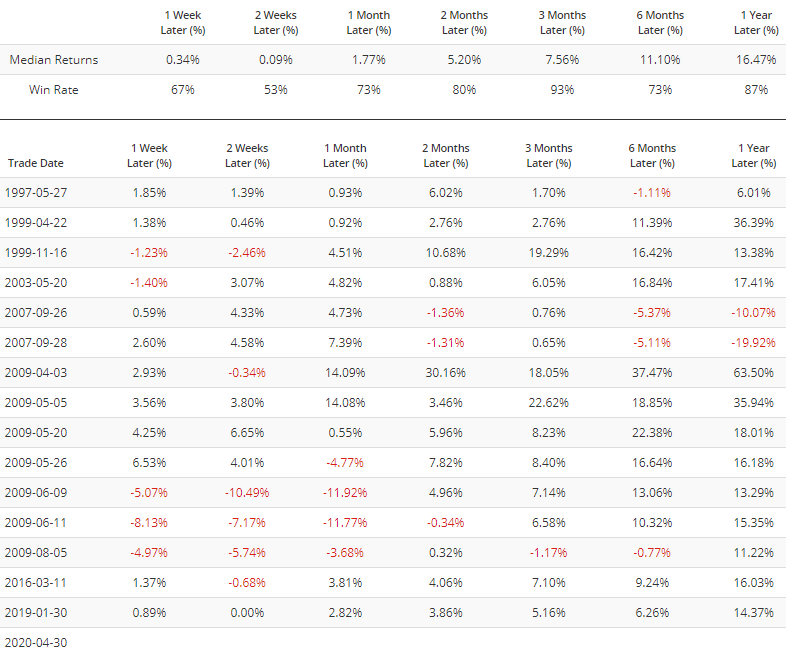
While such high sentiment readings may lead to a short term pullback, this usually led to more gains for Canadian equities over the next 3-12 months. The sole long term bearish cases came in September 2007 just as global equities started to peak:
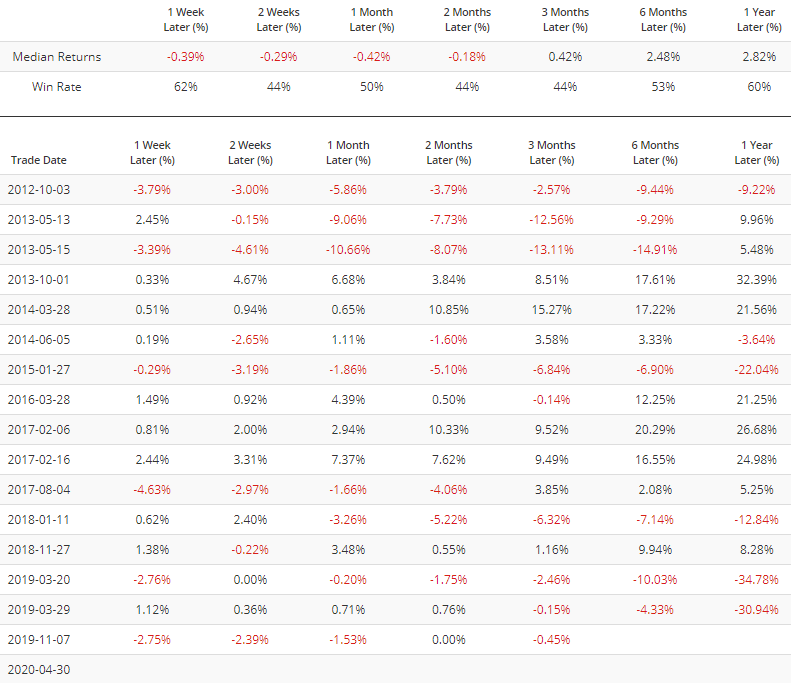
In emerging markets, India Optix's 20-day average is at 67:
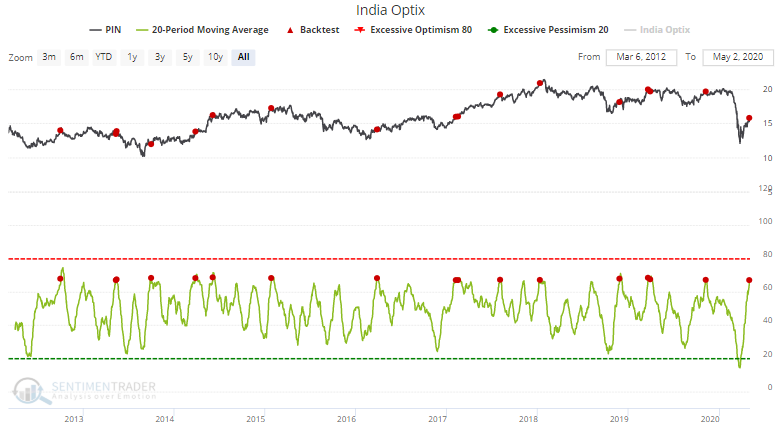
This often led to short term losses for Indian equities:
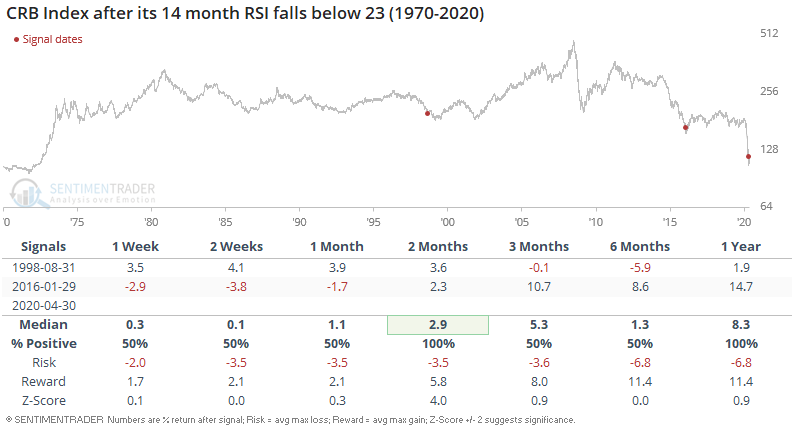
[NEW] Troy notes that commodities may finally be turning around after the worst crash in years. The CRB Index's 14 month RSI is at one of the lowest levels ever:
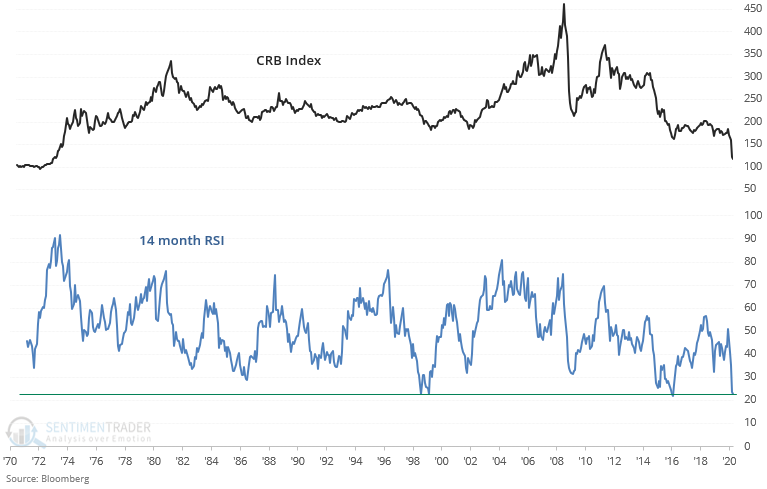
When downwards momentum in commodities was this strong, the long term downside for commodities was limited. Commodities fell further in 1998 before bottoming, whereas commodities were extremely close to a bottom when this happened in January 2016.