
Weekly reversal in S&P 500 and its stocks

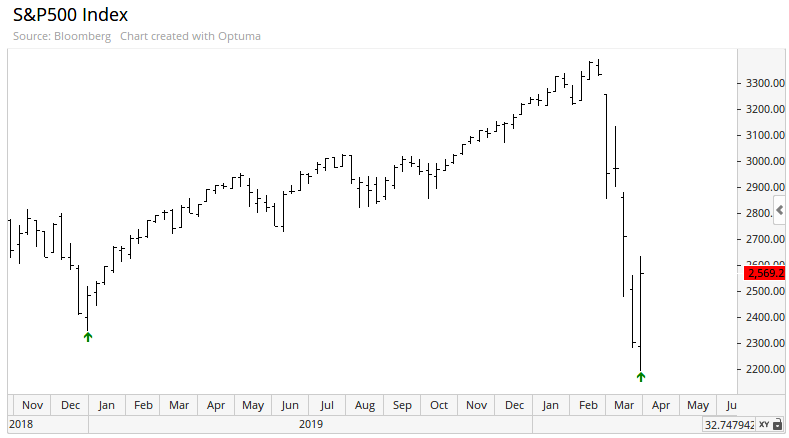
Even after a late selloff again on Friday, stocks enjoyed a large positive reversal for the week, bringing some relief after weeks of torment.
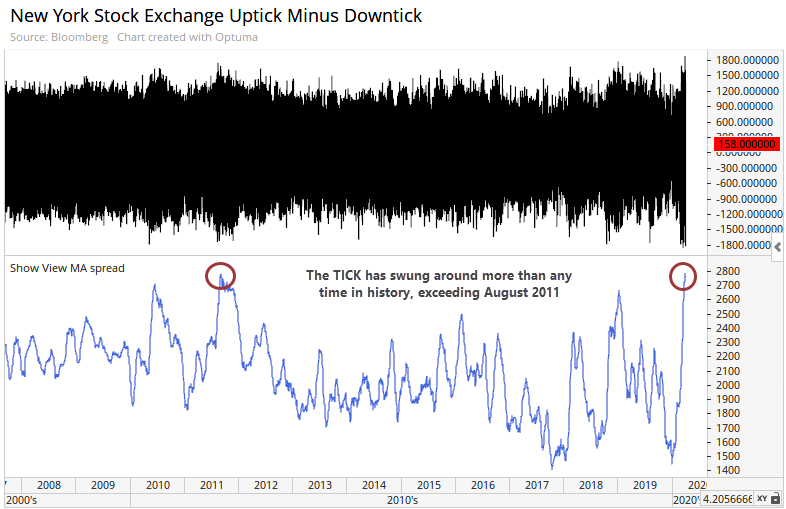
It's hard to read much into these super fast, giant moves that we've been seeing. It seems that the keywords "fed" and "reduce" triggered the computers to hit their sell buttons all at the same time before the close, especially since it's Friday. So much of the activity over the past few weeks appears to be driven by algorithms, with the spread between the intraday high and low of the TICK widening out to a record.
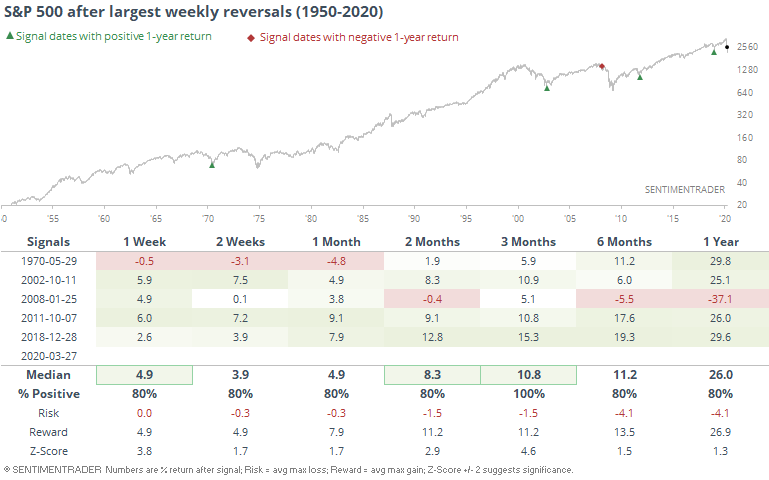
Even so, after hitting a 52-week low on Monday, and at least a 2.5% loss from the prior week, the S&P ended up closing with a large gain. This would qualify as a key reversal week according to some methodologies.
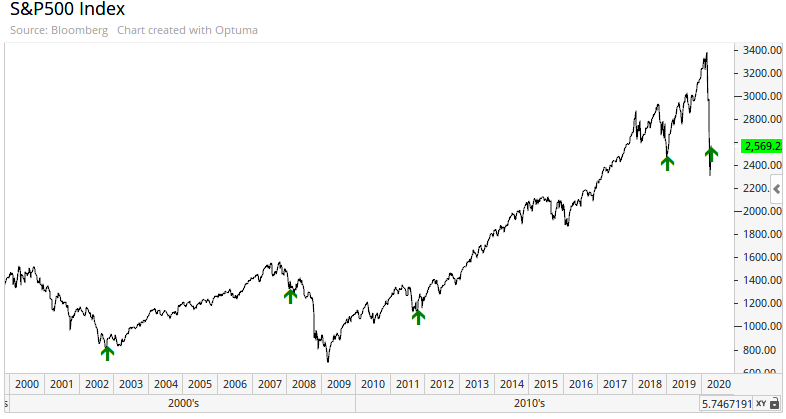
Similar weeks look good, at least on a chart.
Below, we can see every week with the same parameters since 1928.
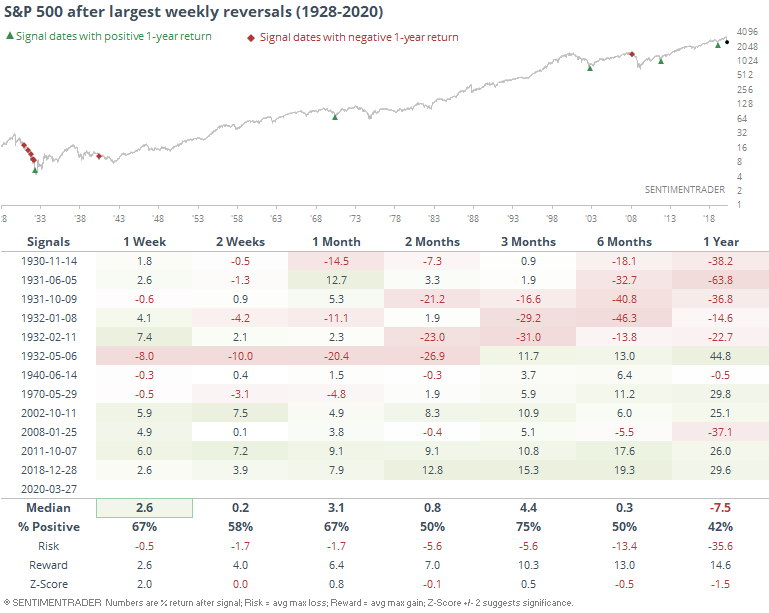
It happened quite a few times in the 1930s and if we want to assume we're in a similar environment, then those are entirely appropriate. For those making the assumption that modern markets are more of a comparison, then returns since 1950 are much better.
It's not just the index that has made a quick about-face during the week. Preliminary data shows that more than 230 stocks within the index will show a Selling Climax which would challenge the record from December 2018.
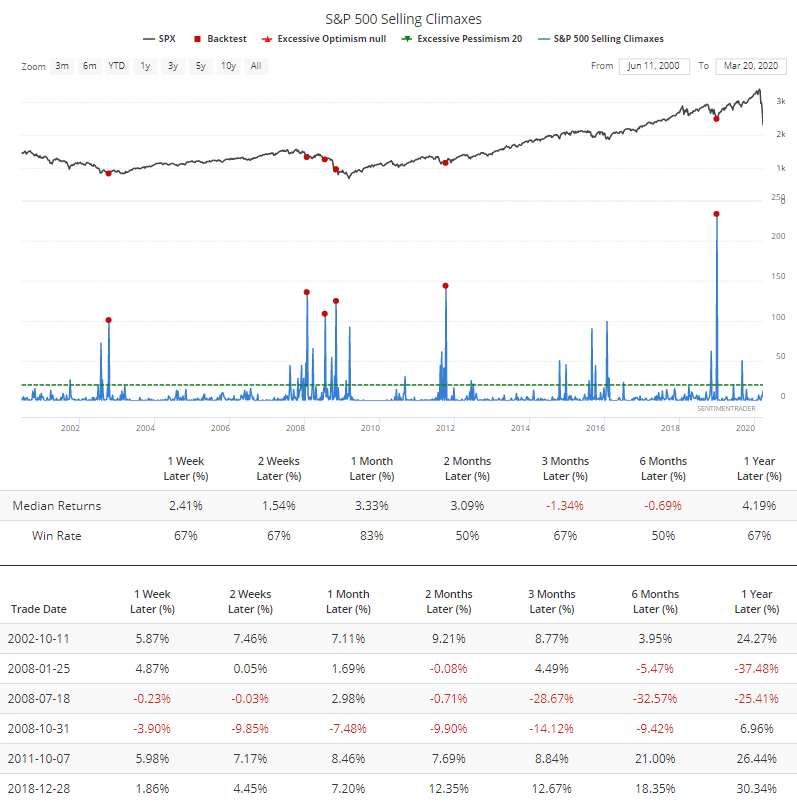
More than 100 selling climaxes in a week has been a good sign for the next month or so, with late October 2008 being the only exception. Combined with the breadth surges, this is a good sign.