
Weekly recap - Tech bounces back as calm conditions remain amid risk-on behavior

House view:
- Stocks:
- Short-term (under one month): No view
- Intermediate-term (one to five months): Modestly bullish. Momentum is strong, and breadth is mostly excellent, especially among cyclical sectors. However, earnings releases are coming hot and heavy the next two weeks. With speculative trading activity bumping against historical extremes, valuations by nearly any metric at or near multi-decade ceilings, and overall earnings so far exceeding expectations, if stocks can't push higher, it would be a classic sign of exhaustion during a seasonal soft spot.
- Long-term (six to twelve months): Bullish. The recovery from the April panic has been historic, and all signs since then have supported a long-term bullish move, with primarily economically sensitive sectors leading the charge.
- Cyclical momentum tends to favor those sectors for average returns
- Defensive sectors also doing well, with momentum favoring high win rate but lower average return
- Very long-term (one year+) favors mean reversion to equal-weight, small-caps, and health care
- Bonds: Long-term cycles remain bearish. Historically, August has been one of the strongest seasonal months for TLT, but since the 2020 peak, it's been one of the weakest. That leads into September and October, which are traditionally weak. We haven't seen much among analysts' studies to suggest a change in trend.
- Commodities: Signs point to a probable secular bull market following multiple new highs. An effective commodity trend model is currently bullish. Gold (especially gold miners) and silver are extended and have a bad history of sustaining gains. Oil seasonality is especially weak for the next three months.
Philosophy
At SentimenTrader, the focus of our research is based on the following principles:
- Stock markets have a strong bullish bias, particularly in the U.S. There is a high hurdle to becoming defensive, and an even higher one to becoming outright bearish, so the weight of the evidence from multiple angles must be substantial.
- Getting the big picture mostly correct overrides factor, sector, and stock selection. Factor and sector preferences shift over time. Most investor returns are driven by asset allocation and broad market trends.
- Meaningful declines in the broad U.S. market tend to be preceded by excess optimism, waning momentum among leaders, and/or divergences in breadth metrics.
- Deep and sustained declines typically occur before and during economic recessions. Predicting these goes in the "too hard" pile, so we focus on monitoring a basic set of known conditions and judging probabilities given these factors.
- The S&P 500 is the most widely benchmarked equity index in the world, with the most assets behind it, so we focus our attention there.
- There are periodic opportunities for factor, sector, and stock investments and trades. We focus on momentum and mean reversion. These opportunities are typically defined by relative and absolute trends, sentiment extremes, seasonality, price patterns, intermarket relationships, fundamentals, volatility, and a host of other considerations.
Due to these beliefs, we spend most of our time trying to get the big picture correct. That primarily involves determining if we're likely in or soon to be in recession, and defining the current health of the market environment. Secondary and tertiary considerations are sentiment, positioning, flows, seasonality, cycles, momentum, price patterns, and many other topics we typically discuss.
Where we're at
Currently, there is only scattered evidence that the U.S. economy is in or in imminent danger of recession, lessening the threat of a deep and protracted bear market.
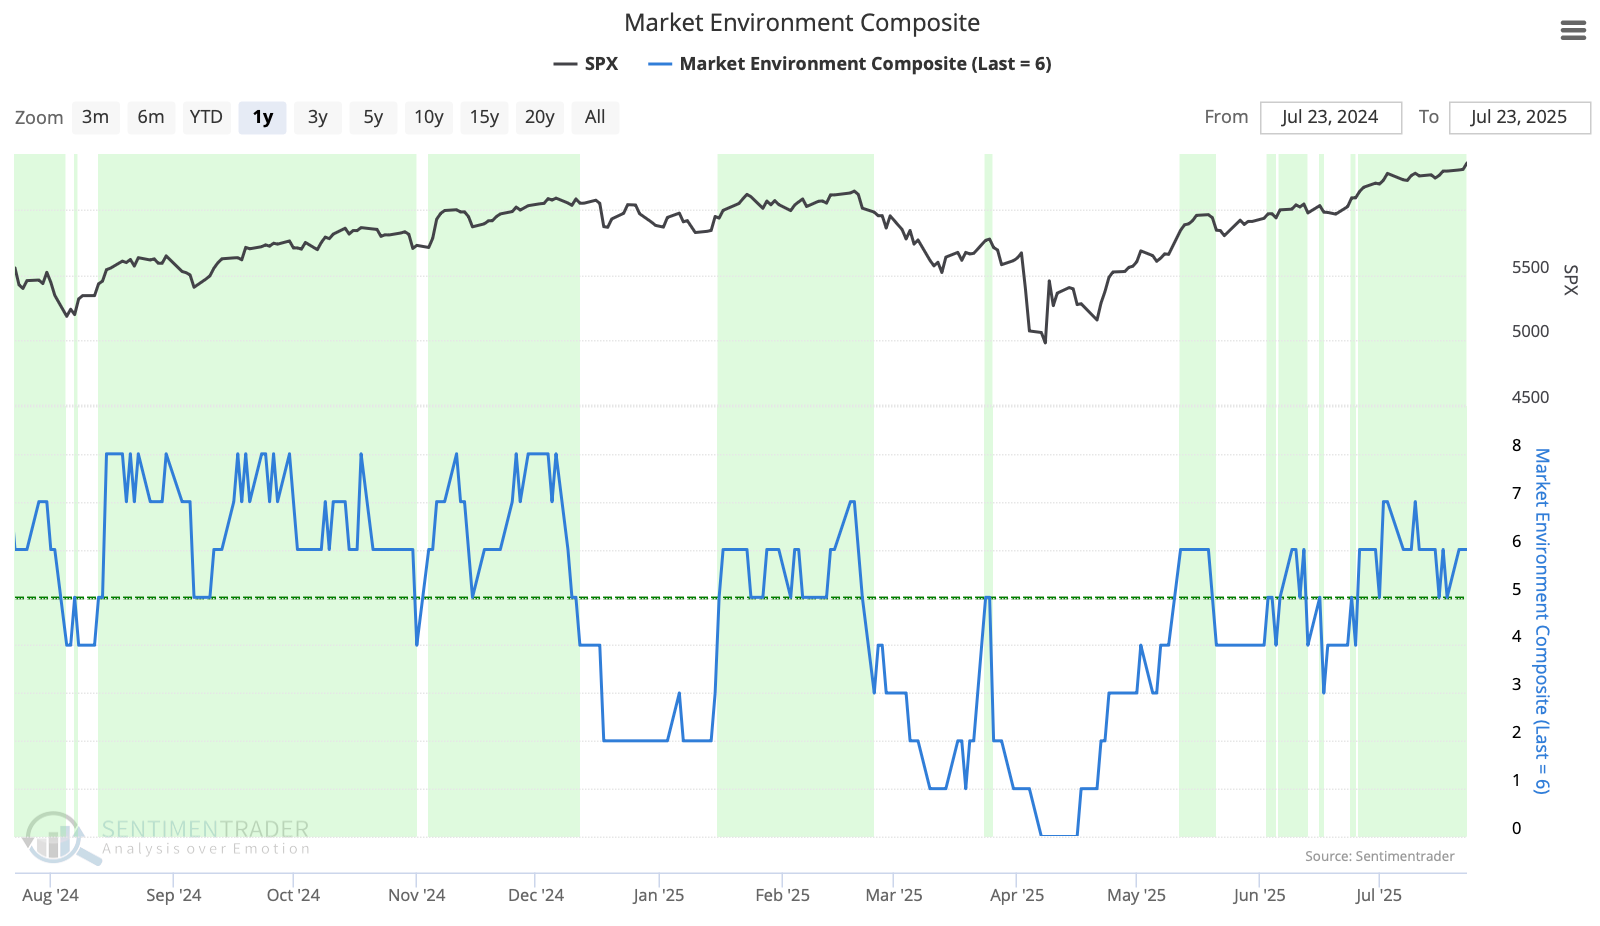
The Market Environment has been a little skittish since the April low, but is currently showing healthy conditions.
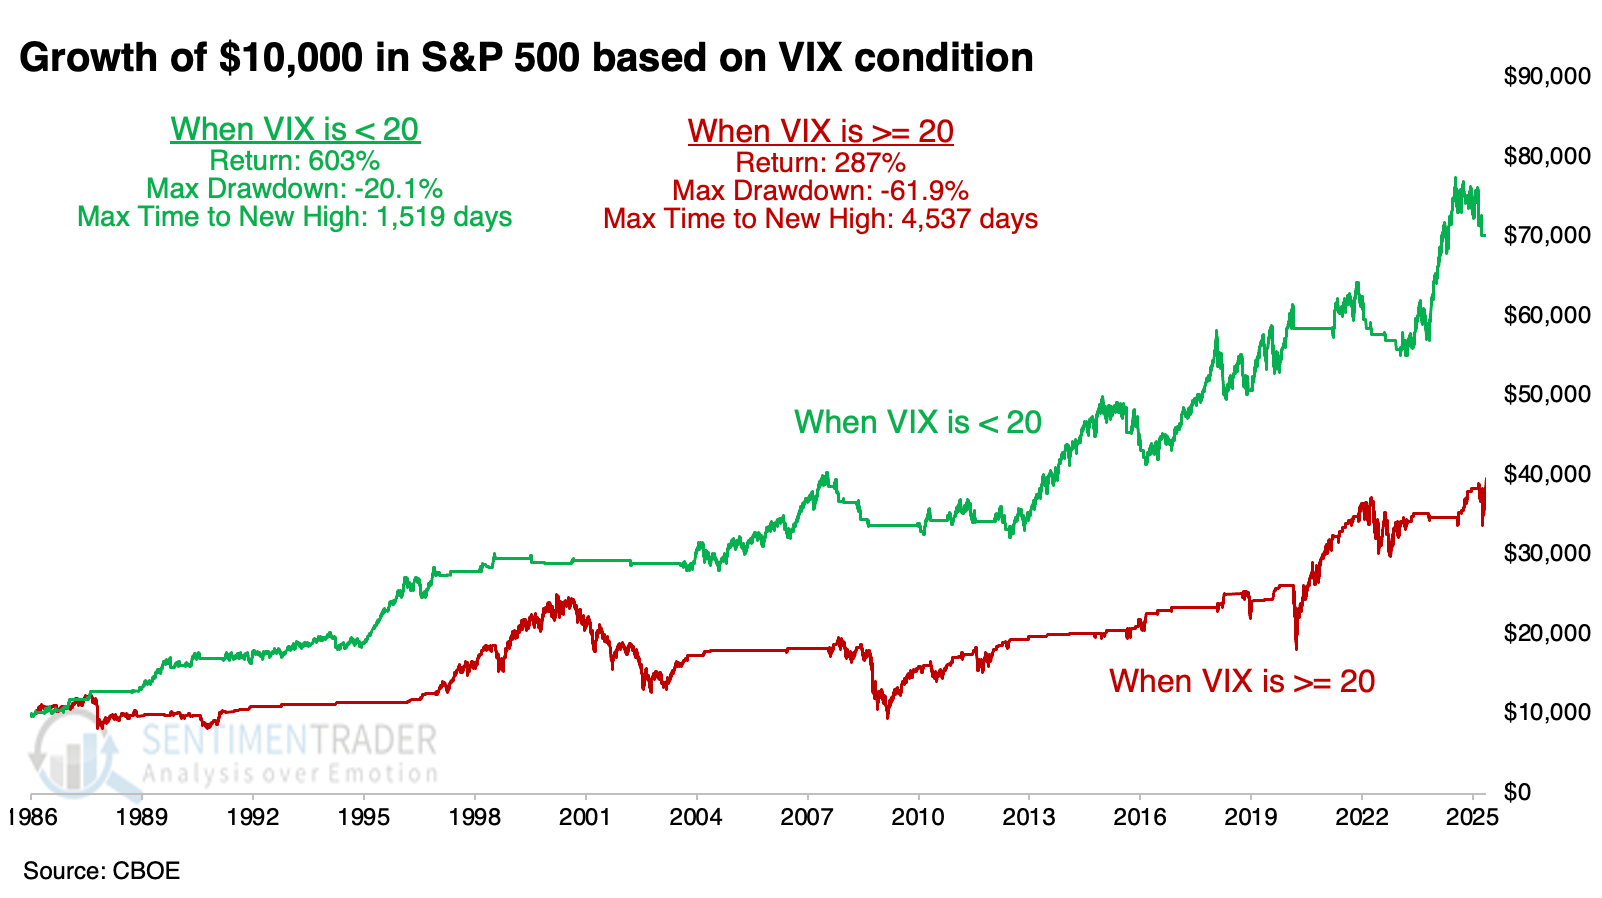
While not part of the Market Environment Composite, it is important to note that volatility is not spiking, and credit spreads are declining. As shown below, the S&P 500 shows markedly better characteristics when the VIX is below 20.
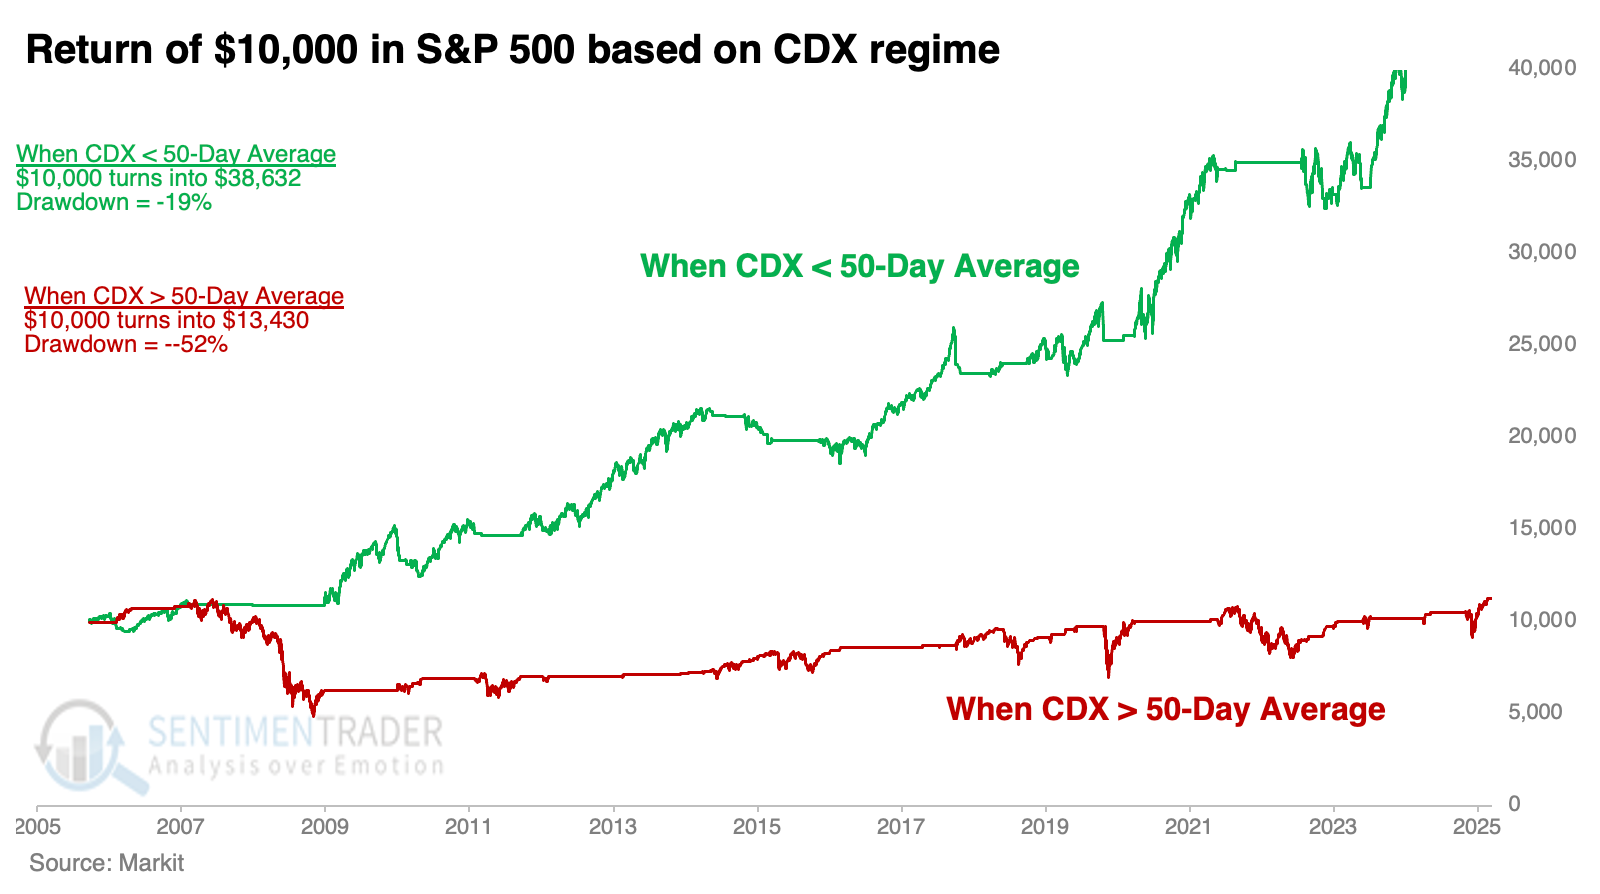
When both the VIX and credit spreads are calm, it's an excellent environment for stocks. As shown below, when the CDX Index is below its 50-day average, the S&P 500 has performed well.
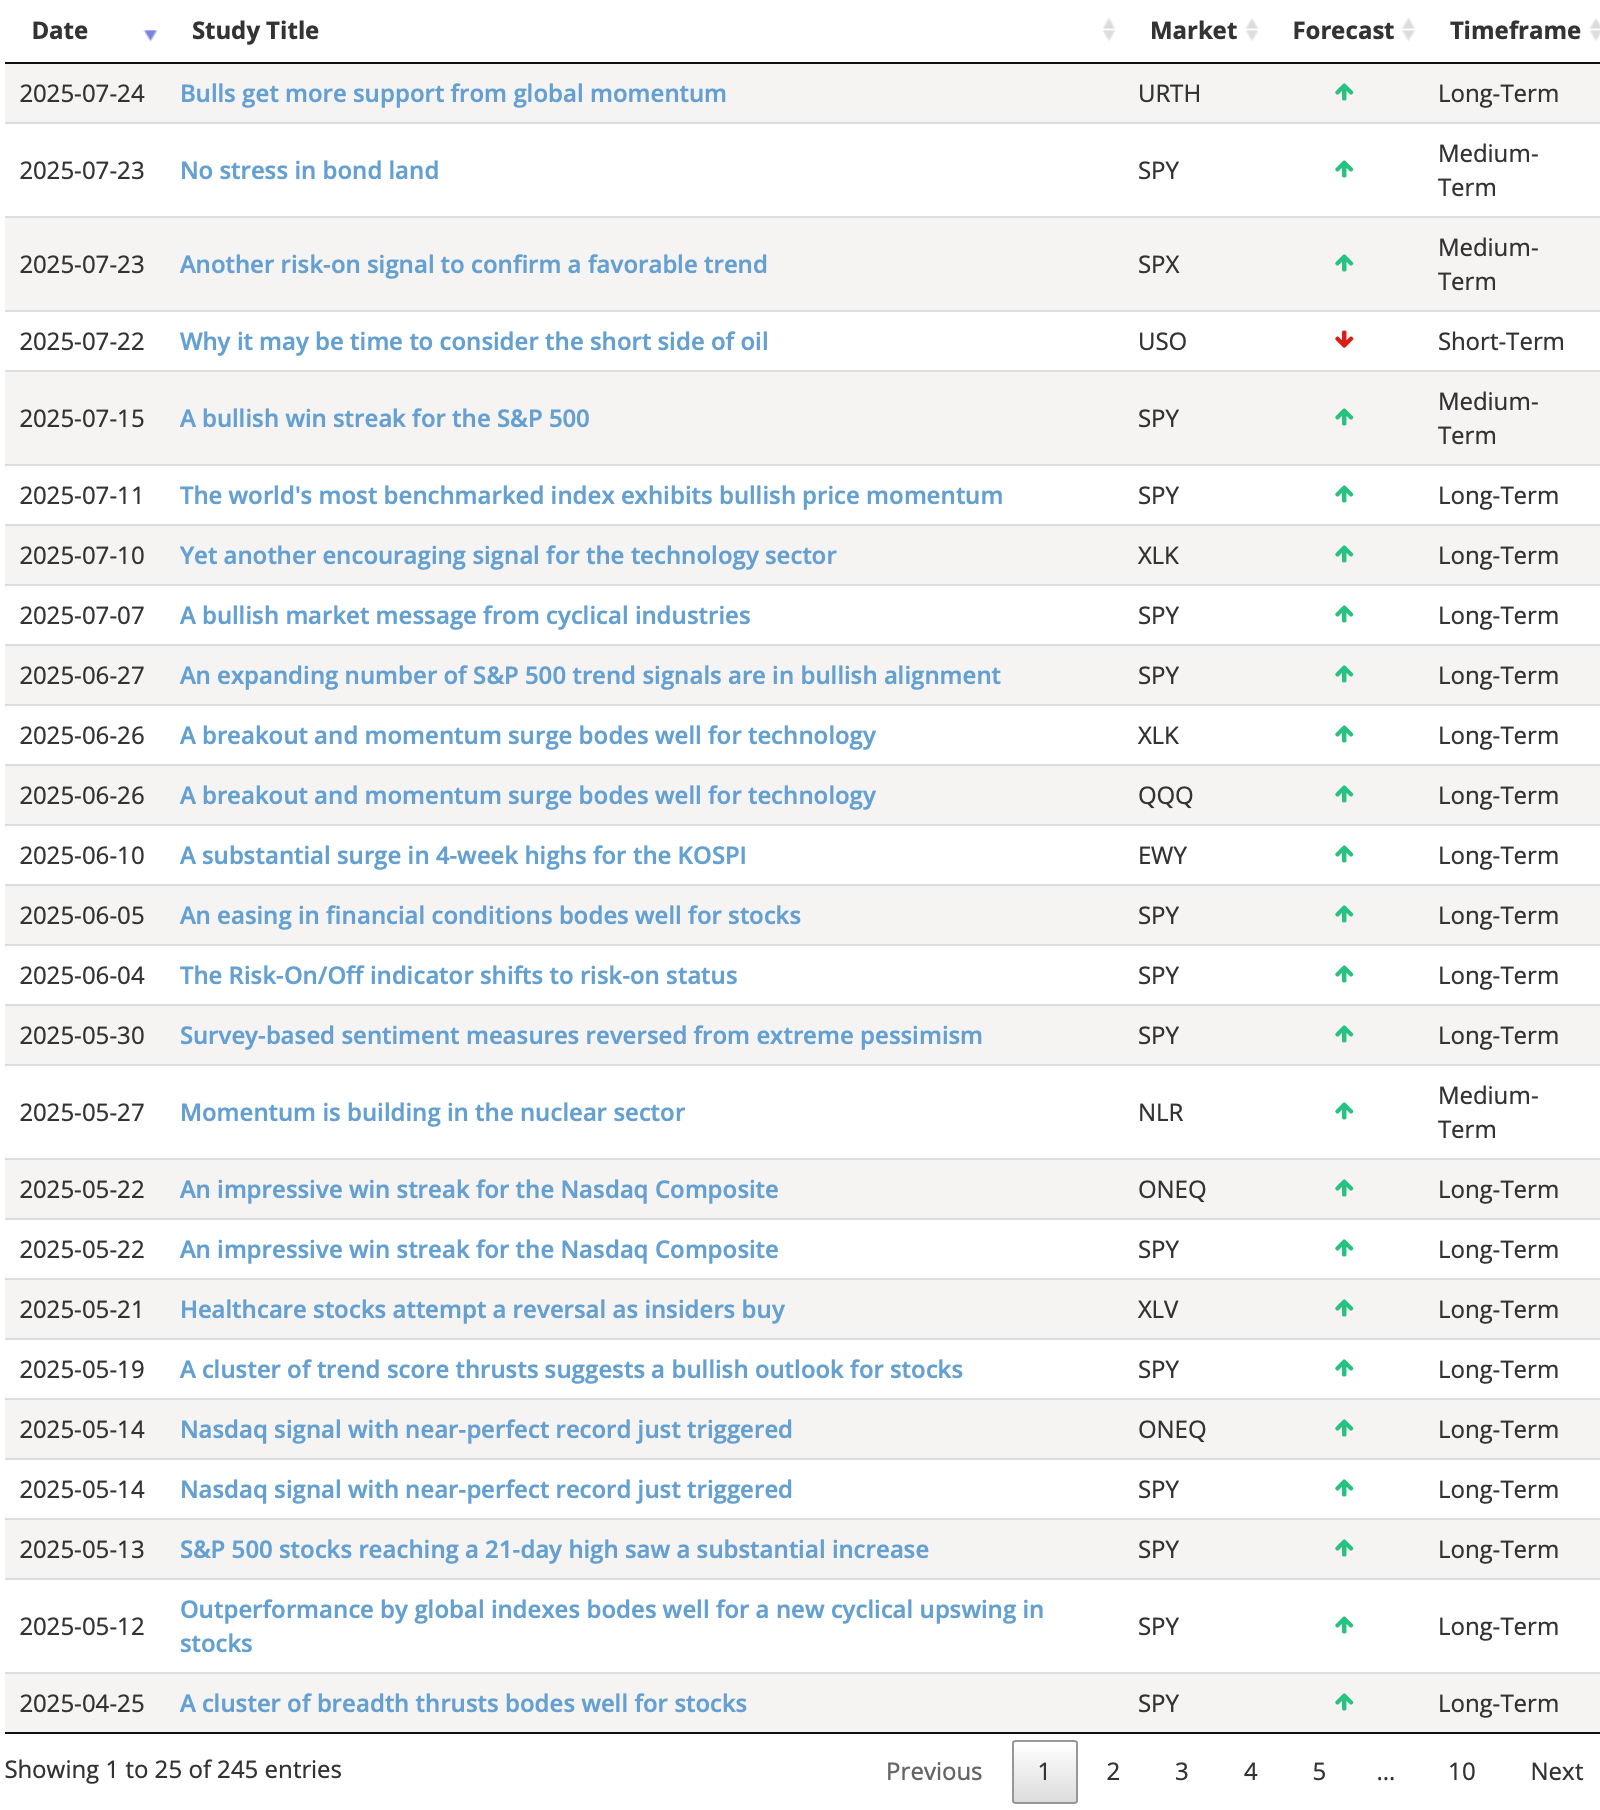
Since April, the most compelling studies have had a strongly bullish bias. You can follow these through the Active Studies page. From time to time, when the analysts' studies provide an overwhelming message, it will override whatever the Market Environment suggests. Currently, both the Environment and the studies have a solid bullish bias over a six- to twelve-month time frame.
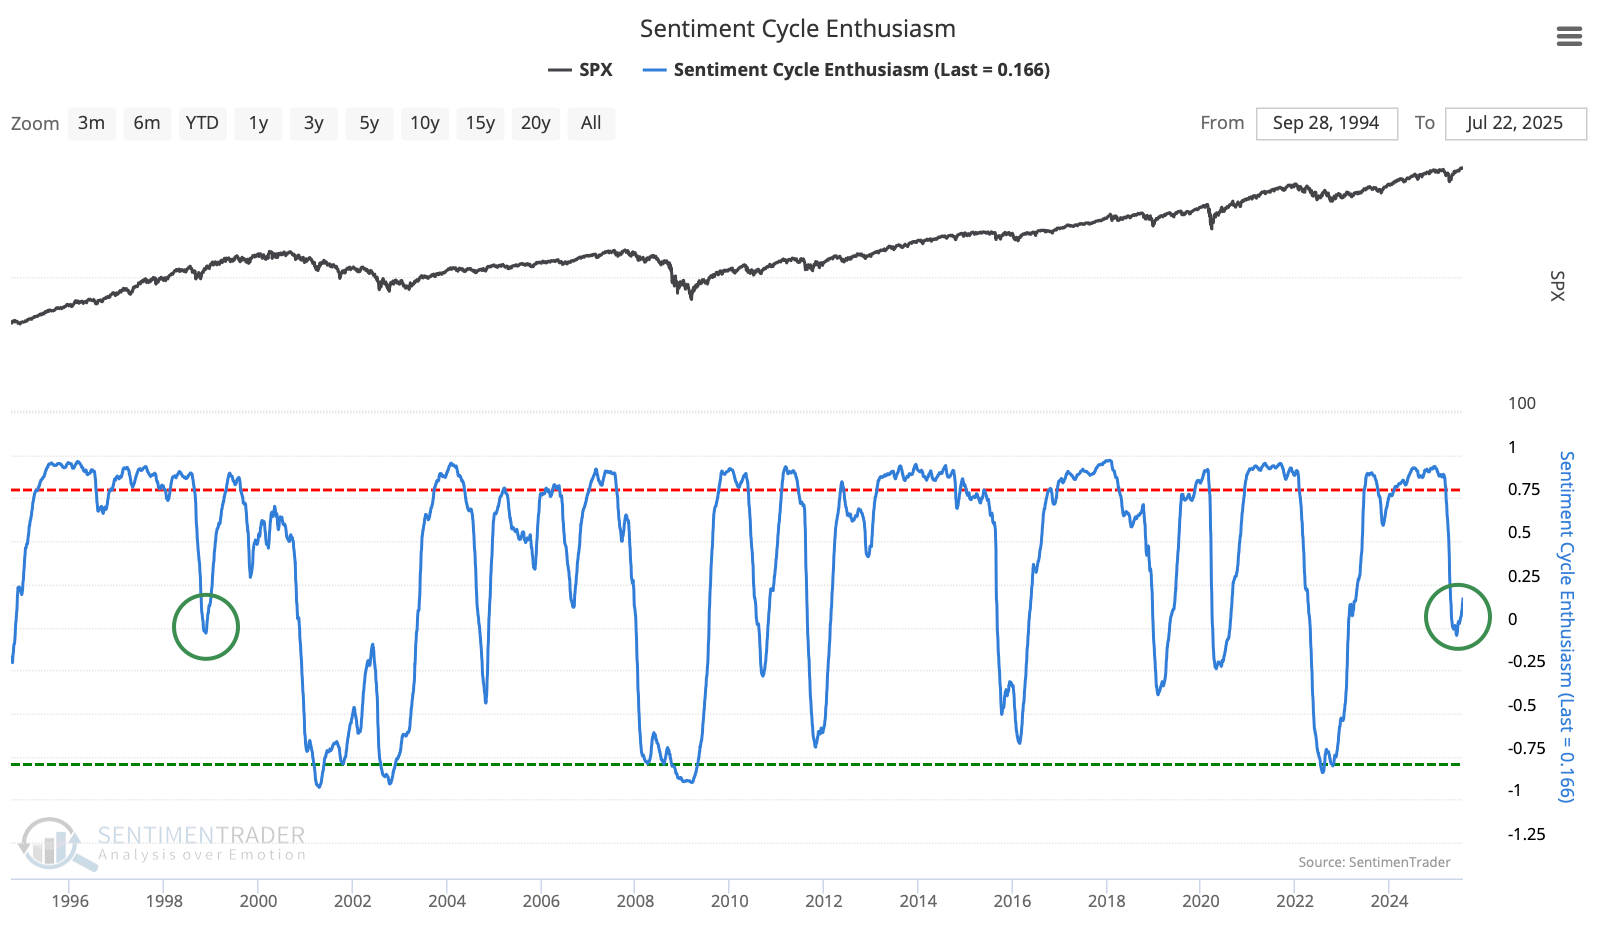
One of the biggest worries is where we are in the Sentiment Cycle. Many sentiment indicators are in the red zone of excess optimism.
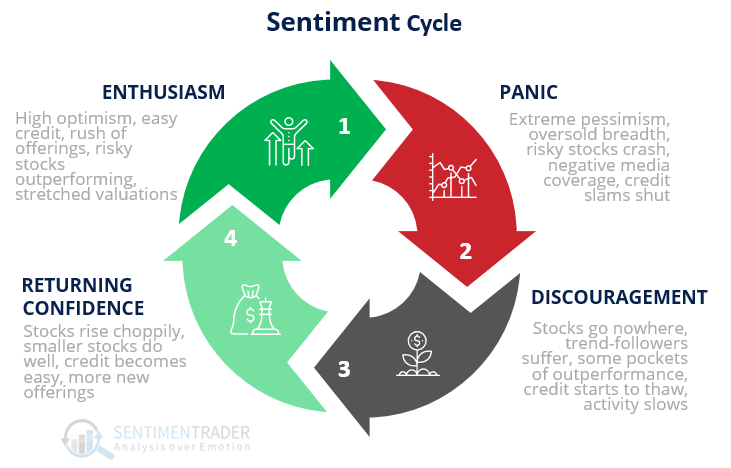
Objectively, our composite of similar Sentiment Cycles shows that we've just reset a period of excess enthusiasm. This is very similar to 1998.
However, some of the secondary considerations are ringing warning bells. There is strong evidence of high optimism, easy credit, a rush of offerings, risky stocks outperforming, and stretched valuations. This may temper returns over intermediate time frames, even given the momentum we've witnessed.
What we covered this week
Buy-the-dip is alive and well
So far this year, the cumulative gain by buying a down day in the Nasdaq 100 (NDX) and holding it only for the next session is +29%. That's second only to 2020 and ahead of the year 2000.
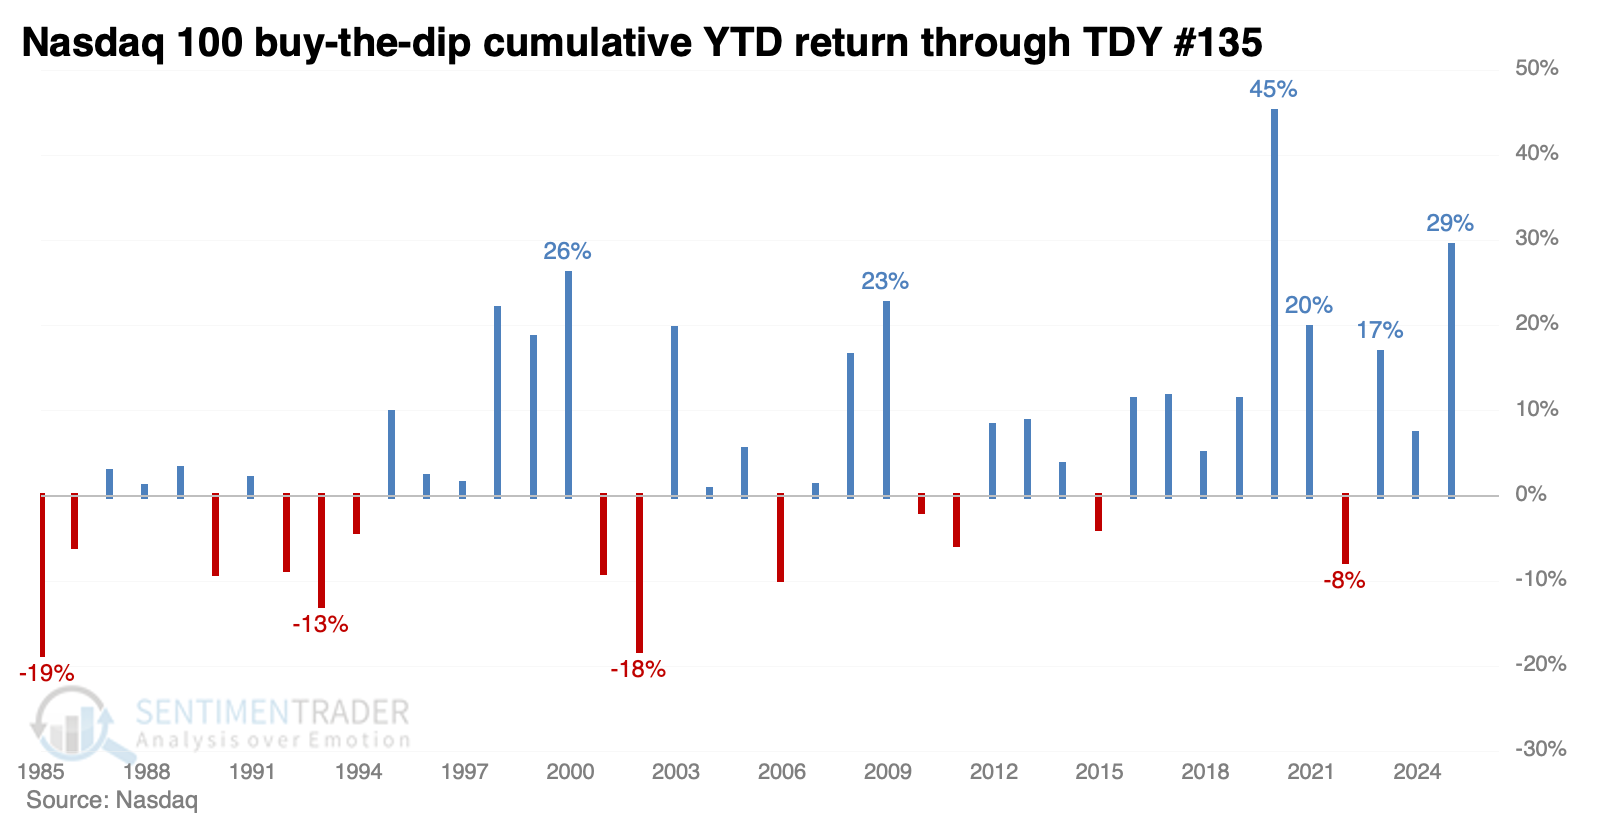
After years with a YTD buy-the-dip gain of +10% or more, the following five to six months were positive all but two times, so that's the good news. The bad news is that the two exceptions were horrible losses, and the median returns and risk/reward ratios weren't all that impressive.
The S&P 500 has a much longer history, but 2025 still stands out for buy-the-dip sentiment. The S&P's cumulative +18% return this year is tied for the 4th-highest since 1928. This was not such a great sign. There were several false signals mixed in, years when traders' buy-the-dip mentality preceded anxious declines. Across most time frames, the S&P's median return was below random, and risk was higher than reward.
Tech bounced back strong
During the depths of the April low, the S&P 500 technology sector fell 20.6% below its 200-day average, a scenario seen in fewer than 4% of trading sessions since 1956. Since then, it rebounded to close 15% above the often-cited long-term average.
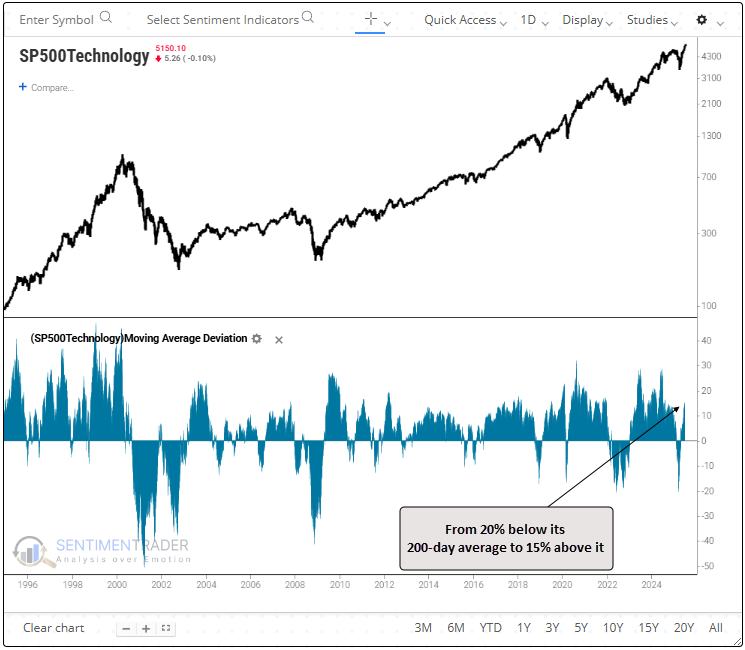
After the S&P 500 technology sector cycled from at least 15% below its 200-day average to 15% above it, those stocks displayed solid consistency and returns over the following year. Over the following six months, the sector fell by more than 10% on two occasions, but posted gains of more than 10% eight times. That asymmetry suggests a favorable risk/reward profile.
Annualized returns climb to an impressive 29% when the sector is 20% above the 200-day average but begin to decelerate from that peak at 25% and turn negative beyond 28%.
After these cycles in tech, the broader S&P 500 showed a positive return every time from five to twelve months later.
More cyclical success
For the first time following a six-month low, the percentage of stocks recording a 52-week high for members in the consumer discretionary, financial, industrial, and technology sectors simultaneously exceeded 10%.
In the early stages of a recovery, these four cyclical sectors tend to lead, and they just provided us with another critical piece of evidence suggesting that the uptrend in stocks should persist.
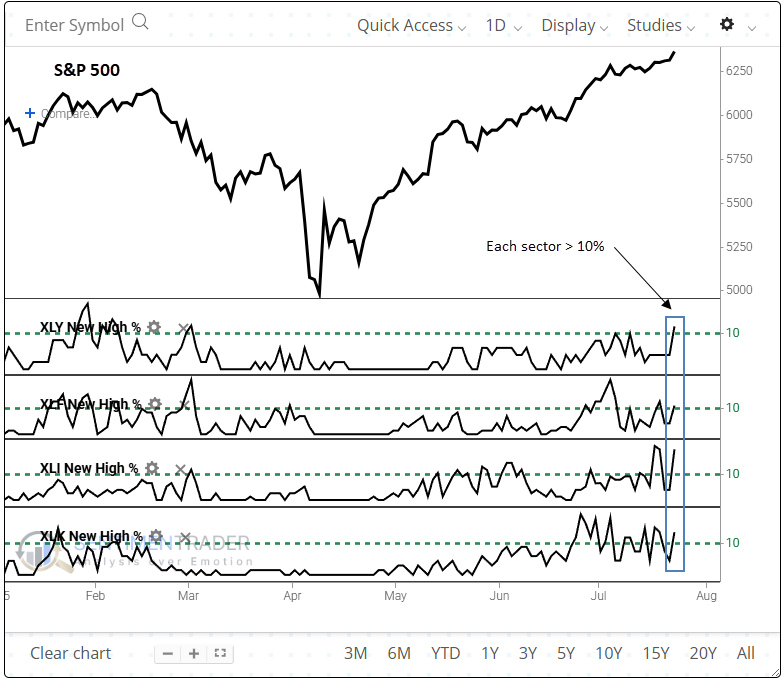
Whenever more than 10% of stocks in these cyclical sectors simultaneously hit 52-week highs for the first time following a 6-month low, the S&P 500 consistently delivered strong returns over the next 12 months. 25 out of 27 signals showed a gain over the following twelve months.
Remarkably, the S&P 500 never suffered a loss exceeding 10% within the next six months, though a few came close. Even at the one-year mark, 10% drawdowns remained rare, occurring only three times. In contrast, twenty of the signals enjoyed a gain larger than 10% at some point.
No stress in bond land
A good proxy for bond market anxiety is bond traders' pricing of credit default swaps. As long as traders are not paying up for protection against bond defaults, especially if they're not rapidly re-pricing that risk, things are usually okay in the stock market.
A primary indicator showing the prices traders pay for default protection has been holding below its 50-day moving average for nearly 50 sessions, one of the longest streaks of the past few years. The index acts like the VIX, so the CDX Index will rise if traders are concerned.
If we overlay the S&P 500 against the CDX Index, it's apparent that long streaks of calm in the bond market have coincided with happy times for stock market investors. The S&P's annualized return is double when the CDX Index is below its average compared to when it's above.
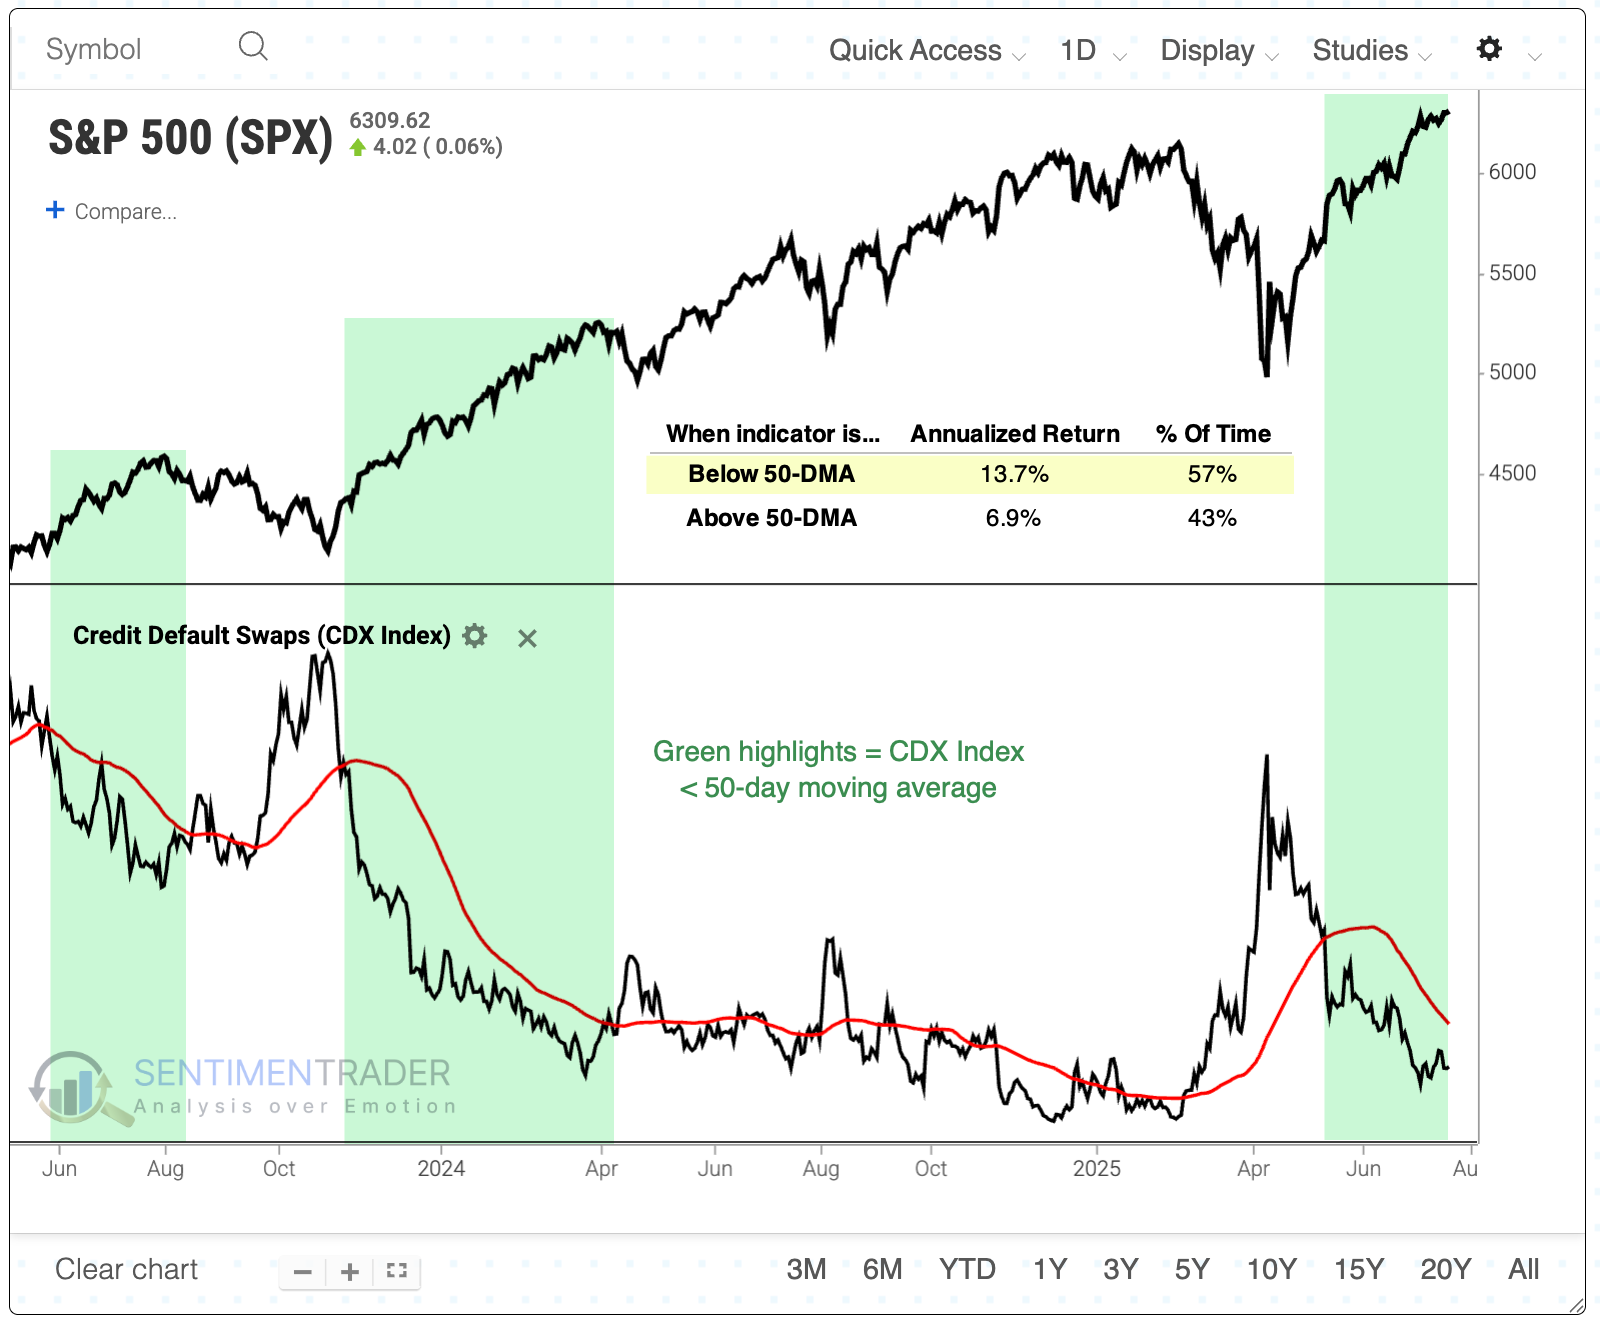
The trend in credit default prices has drastically impacted stock returns over the past 20 years. Using next-day returns, the S&P 500 turned $10,000 into nearly $40,000 when the CDX Index was below its 50-day moving average and suffered only a 19% drawdown. If the CDX Index was below its average, that $10,000 turned into only about $13,500, with a horrific drawdown exceeding 50%.
Firmly in risk-on mode
Investors have been in risk-on mode for a while. Actually, for most of the past two years.
In the chart below, the S&P 500 appears in the top pane. A green arrow appears when the 50-day average of the Risk On / Risk Off indicator falls below 32.7% and then rises above 67%. The exit dates, 126 trading days after a green arrow, are highlighted with a red arrow.
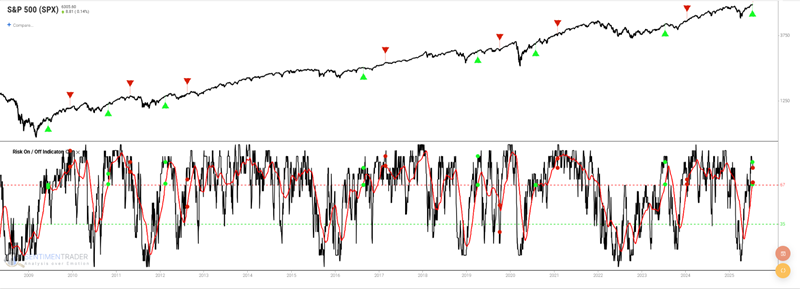
This strategy was only in the market 17.8% of the time, yet generated a return of 127%. The only unfavorable trade so far is the current one, which only triggered a few sessions ago and still has almost six months to go. Among the individual trades, not only are they all positive, but the max loss during the six-month holding periods was relatively minor, with none exceeding 10%.
After these risk-on signals, cyclical sectors tended to perform well. Discretionary, financial, and technology stocks witnessed strong, consistent gains over the following five and six months.
Good global momentum
The case for a sustained rally in stocks got an additional boost on Tuesday when over 80% of country indexes displayed a positive 252-day rate-of-change, the first such occurrence in more than a year. This favorable price momentum suggests that the strength in the U.S. market is not an isolated event, but part of a broader global trend.
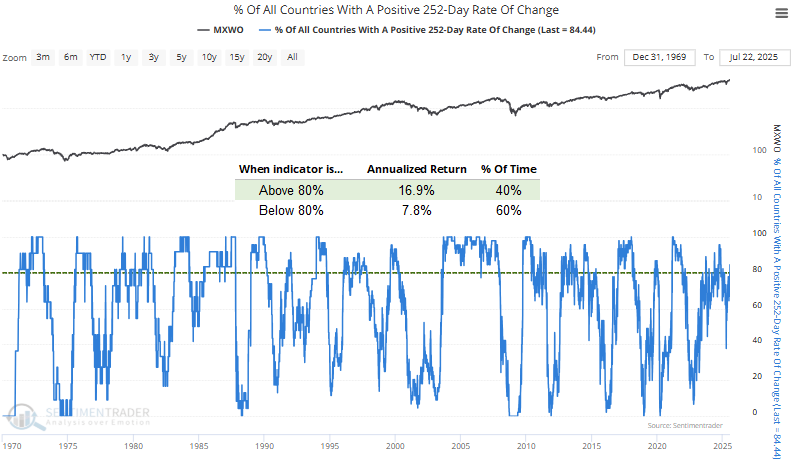 Although readings above 80% tend to align with robust annualized returns, it's also informative to analyze what happens when the percentage of countries with a positive 252-day rate of change rises from below 40% to above 80%.
Following similar cycles, the MSCI World Index produced uniformly solid returns, advancing in every instance over the next 12 months.
The MSCI World Index tended to outperform the S&P 500 in the initial four months. However, a year later, it lagged the U.S. benchmark.
Troubling seasonality for oil
As the old saying goes, "Seasonality is climate, not weather." That climate is looking dicey for oil.
The chart below displays the Annual Seasonal Trend for USO since its inception in 2006. The last six months of the year all show a negative average return.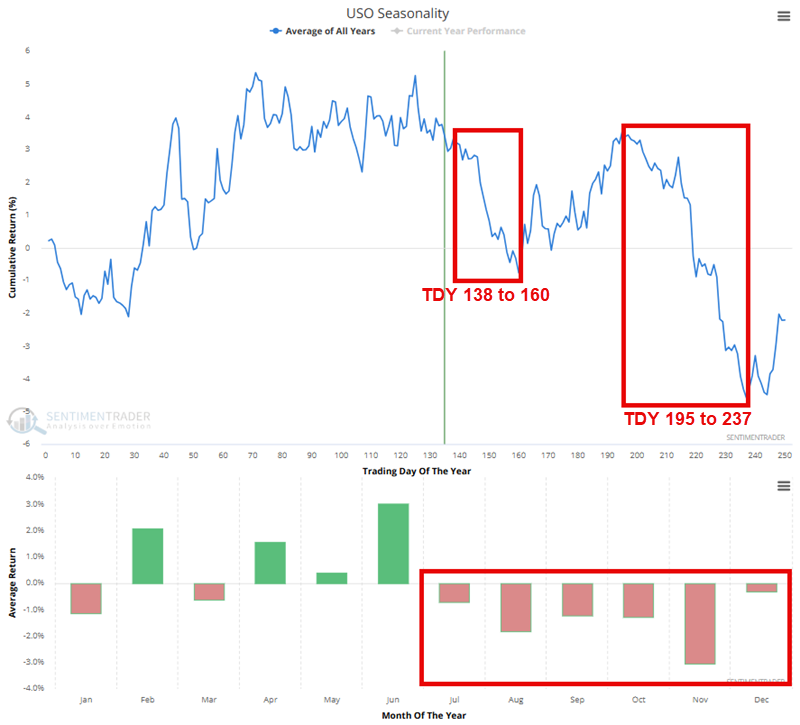
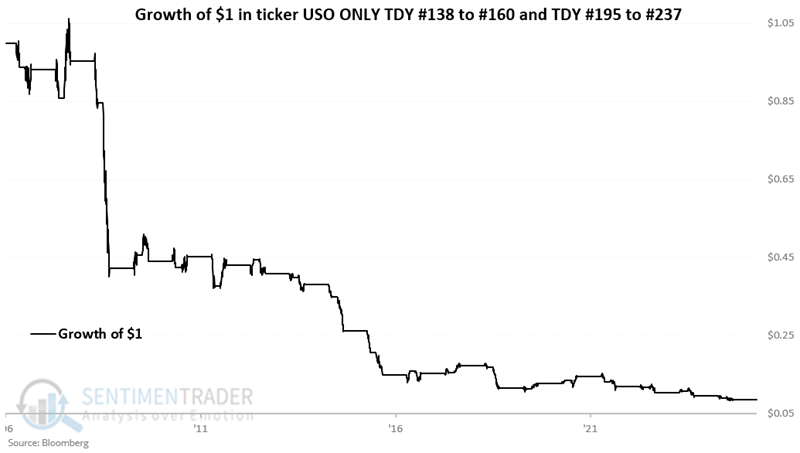
For 2025, the first unfavorable seasonal period extends from 2025-07-23 through 2025-08-22, and the second unfavorable period extends from 2025-10-13 through 2025-12-11. Holding a long position in USO only during these two seasonal windows and being flat the rest of the year resulted in a cumulative loss of 91%.
About TradingEdge Weekly...
The goal of TradingEdge Weekly is to summarize some of the research published to SentimenTrader over the past week. Sometimes there is a lot to digest, and this summary highlights the highest conviction or most compelling ideas we discussed. This is NOT the published research; rather, it pulls out some of the most relevant parts. It includes links to the published research for convenience, and if you don't subscribe to those products, it will present the options for access.