
Weekend summary: Gold and Silver Join the Speculative Boom
I publish a weekly summary note which highlights what factors are most important to understanding the markets right now. These important factors may stay consistent from time to time (e.g. sentiment is consistently high over the past month), so each weekly summary will have some overlap with the previous one.
The U.S. stock market's massive 4 month rally has triggered similarities between today and the 1999/2000 dot-com bubble. This isn't to say that "today is just like 2000" - the future is never just like the past. But there are enough similarities to make risk-sensitive traders think twice before throwing caution to the wind and bet on 2%-a-week gains. Meanwhile, some of the speculative ferver in EM and Chinese equities has worn off.
In this post I will highlight the most important data points and charts right now. These indicators primarily impact markets in the short-medium term. They are not meant for long term investing. So if an indicator is short term bearish for stocks, that DOES NOT mean stocks can't rise over the next year (long term).
Monitor these data points carefully but always think for yourself. You are the master of your own portfolio. As always, I welcome those who disagree with me (feel free to email me your thoughts [email protected]).
So without further ado, we'll look at the following:
- (NEW) Falling U.S. Dollar and precious metals speculation
- (NEW) Chinese and EM stocks cooling off
- Sentiment
- Options
- Incredible momentum
- Weak breadth
(NEW) Falling U.S. Dollar and precious metals speculation
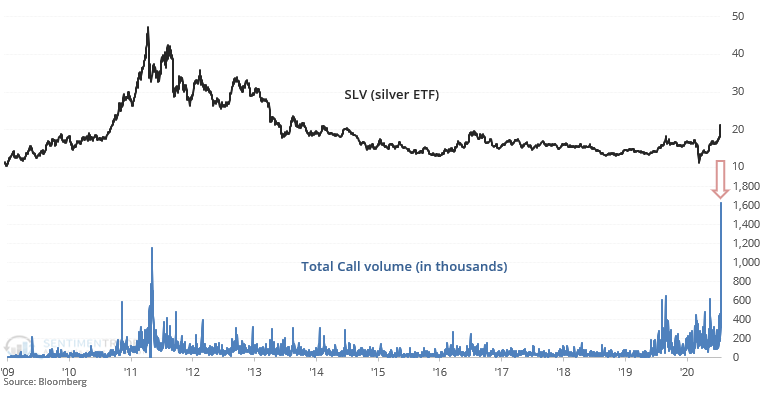
This past week saw stunning speculation in gold and silver while the U.S. Dollar sank. The popular narrative is that government monetary support will lead to inflation and currency debasement, so buy precious metals as a hedge. Regardless of whether this theory is right or wrong, the fact remains that traders are full-bore bullish on metals.
SLV call volume is at an all-time high, shattering its previous record in 2011:
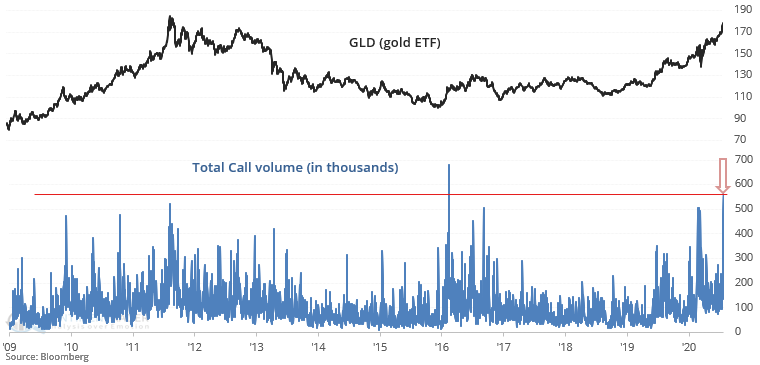
GLD call volume is near an all-time high:
Gold and silver strength has been matched by USD weakness. Dollar Optix fell to a level where in the past 10 years, consistently led to USD rallies:
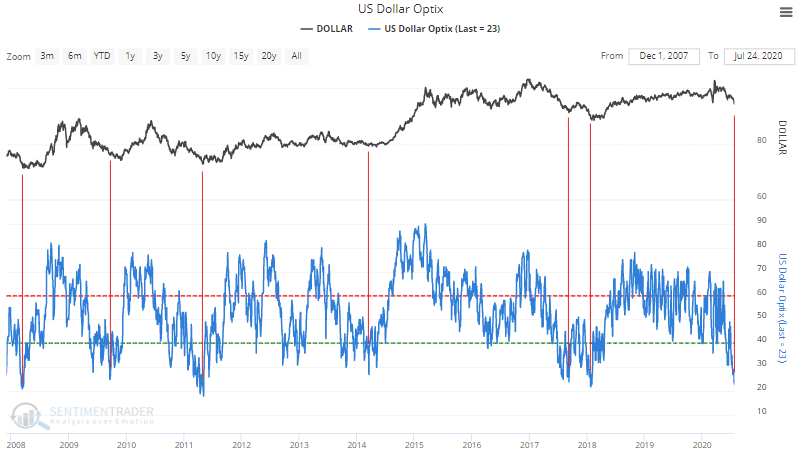
A potential USD rally (coupled with short term precious metals weakness) is a short-medium term worry for U.S. equities.
(NEW) Chinese and EM stocks cooling off
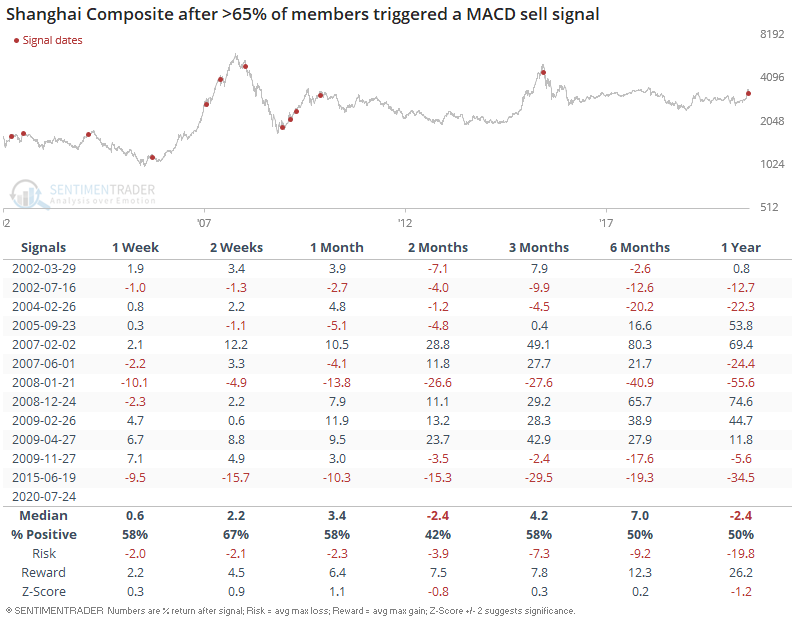
A week ago I highlighted off-the-charts greed in Chinese and emerging market equities. And right on cue, Chinese and EM stocks pulled back. A historic 66% of Shanghai Composite members triggered a MACD sell signal:
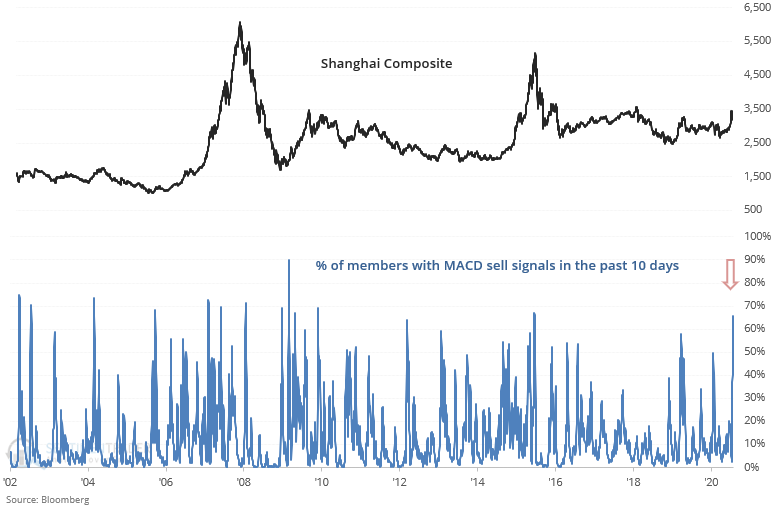
By the time this happened in the past, sometimes Chinese equities could pullback more in weeks and months ahead, but sometimes the pullback was already over:
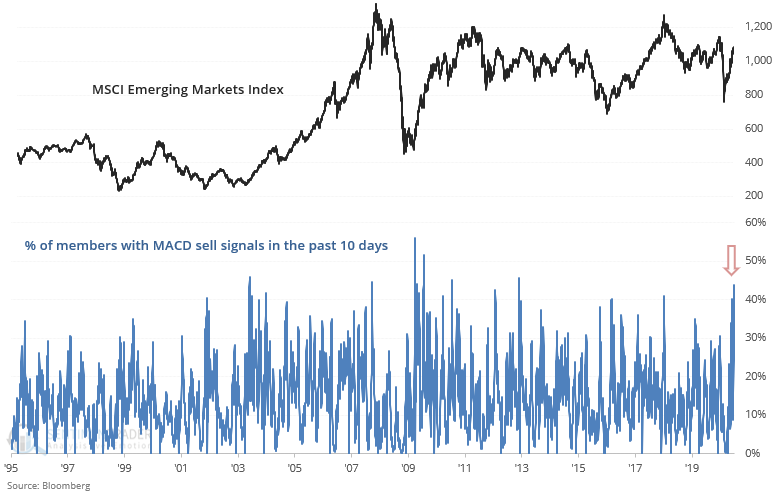
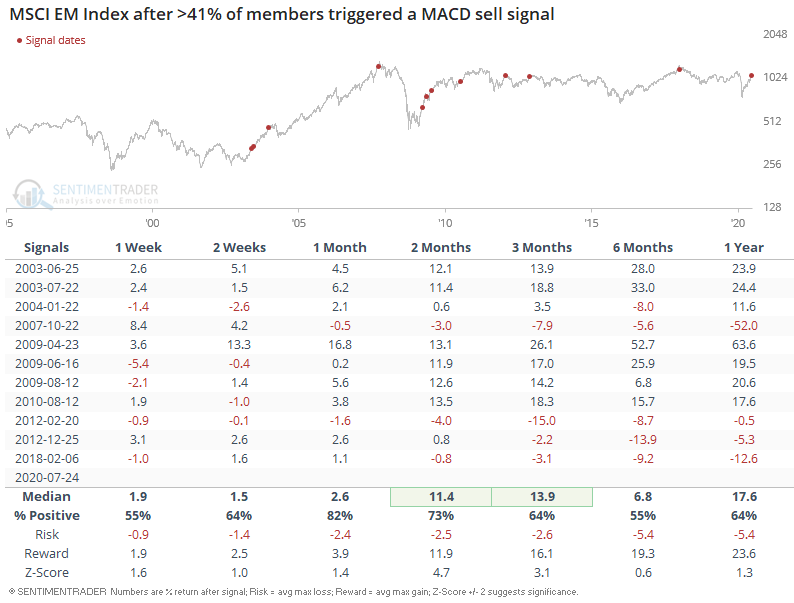
Similarly, a near-record % of MSCI Emerging Markets Index members triggered a MACD sell signal:
By the time so many EM stocks had already rolled over, it was no longer clear that EM would pull back further. It's safe to say that the recent pullback in China/EM has washed away some of the previous excessive optimism, so the path going forward for China/EM is no longer clear.
Sentiment
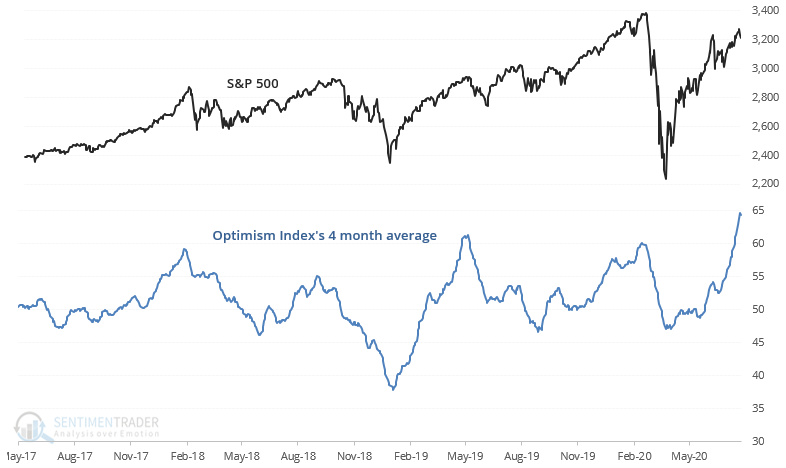
The stock market's stunning 4 month rally pushed various sentiment indicators to truly rare levels. Our S&P 500 Optimism Index's 4 month average is at a level where over the past 2 years, typically led to pullbacks/corrections.
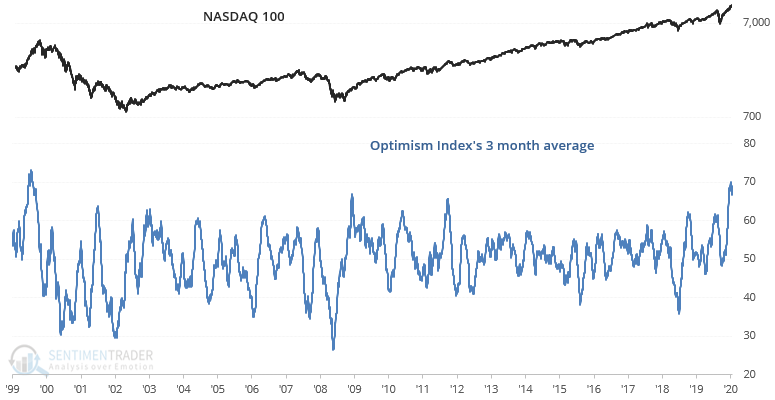
Meanwhile, our NASDAQ 100 Optimism Index's 3 month average is at the highest level since the peak of the dot-com bubble. Once again, this doesn't necessarily mean that the U.S. stock market will crash 50-70% over the next 3 years, but this does suggest that investors and traders should be cautious going forward.
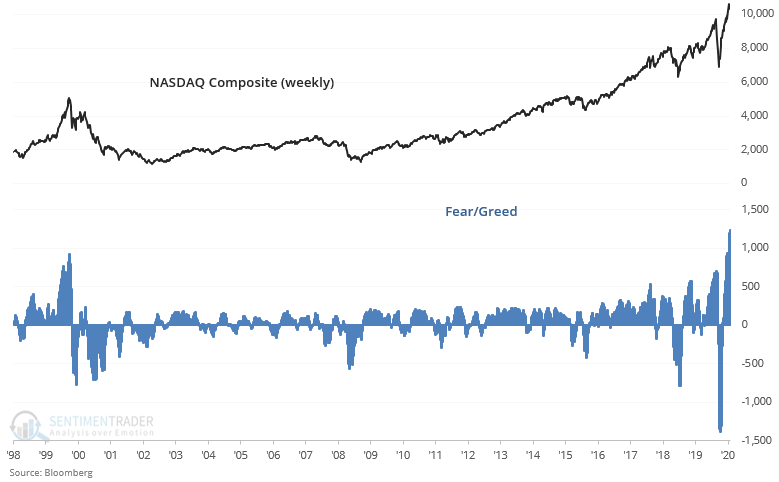
It's not just our sentiment indicators that are demonstrating extreme complacency. Bloomberg's Fear/Greed indicator for the NASDAQ Composite is at an all-time high. The previous 2 highs were in:
- Dot-com bubble. This historical case needs no rehashing.
- January/February 2020. Stocks plunged in March, pushing the Fear/Greed indicator to its lowest level ever. Extremes beget more extremes.
Options
As I'm sure you're aware of by now, options speculation has surged over the past few months. The surge in retail trading and options speculation is a concept that Jason first mentioned in mid-May (see here and here). Since then, this topic has been repeated over and over on the internet/social media.
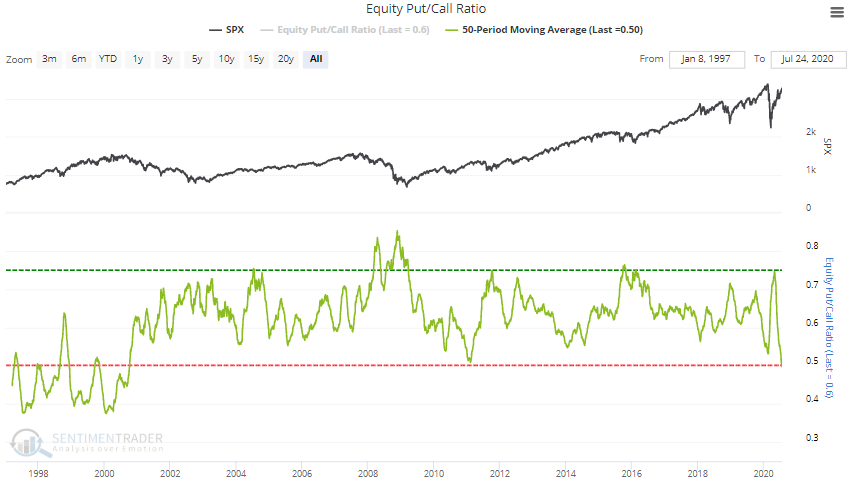
I'll just touch on this briefly. The Equity Put/Call ratio's 50 day average is at its lowest level in nearly 2 decades. Less extreme cases over the past 20 years led to sharp stock market corrections.
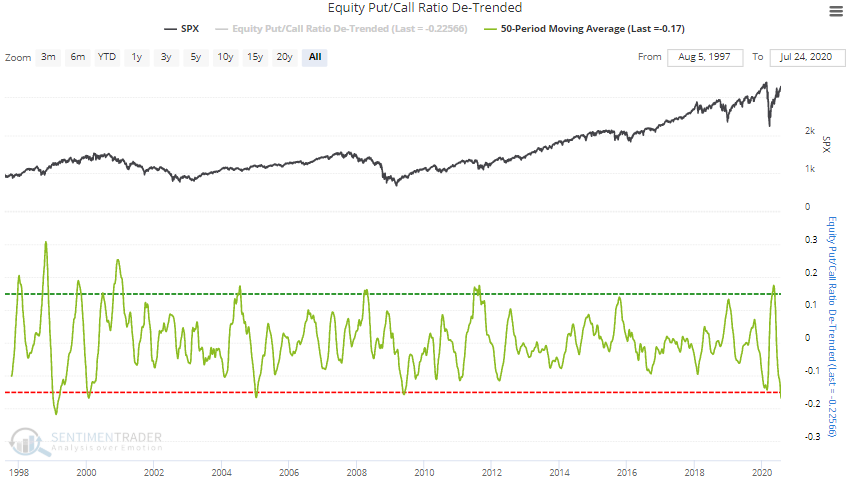
As popular as the Equity Put/Call ratio is, applying a moving average isn't the best way to look at this indicator. I.e. you'll notice that the ratio's 50 day average was consistently lower pre-2001. We created a De-Trended Put/Call Ratio to account for this upwards shift in the ratio since 2001. Once again, historical cases when the ratio was this low (below -0.13) led to worse-than-random returns for the S&P over the next 2-3 months:
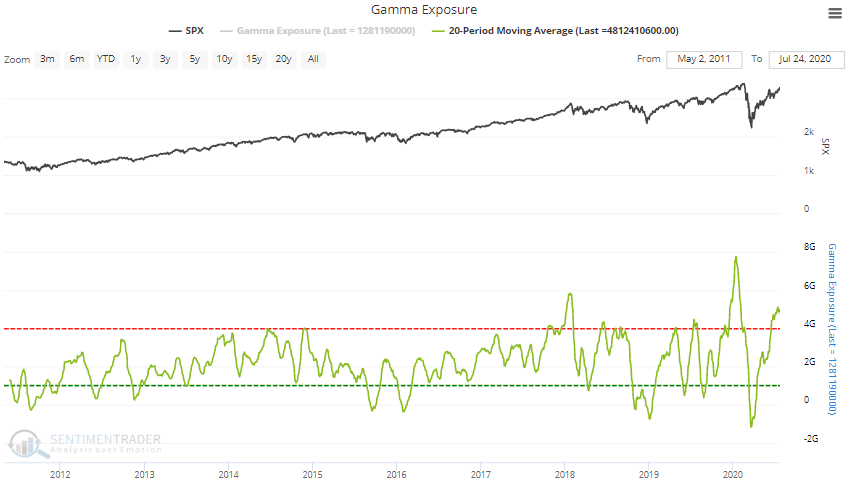
Speaking about options, Gamma Exposure remains extremely elevated. This is an idea I originally mentioned in June, so it's interesting how others are copying it now for their marketing material.
There have only been 2 other historical cases in which Gamma Exposure's 20 dma was this high. The first historical case led to a sharp correction in early-2018, and the second led to the stock market's crash this March:
Incredible momentum
A wild speculative orgy is particularly noticeable in tech stocks. The sensible and rational belief that "tech stocks should outperform during a pandemic" has turned into the irrational belief that "tech is a SCREAMING BUY at any price". Looking at a few long term charts, here's an update of one I posted on Twitter:
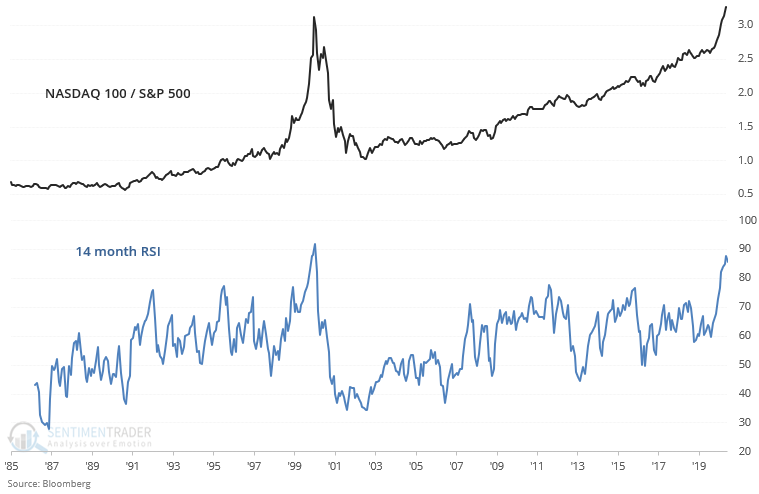
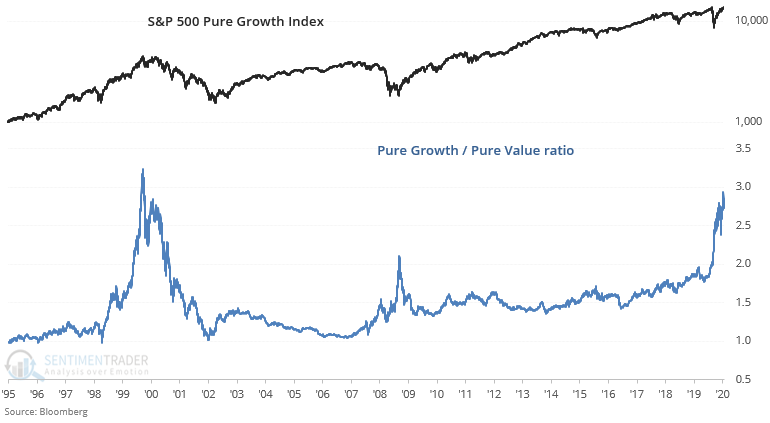
The NASDAQ 100 / S&P 500 ratio's 14 month RSI is at its highest level since the peak of the dot-com bubble! Again, this doesn't mean that a 50-70% stock market crash is imminent, but one has to wonder how much longer the "buy everything tech/growth" train can continue. Speaking of growth, the S&P 500 Pure Growth/Value ratio is also near its highest level since the peak of the dot-com bubble.
Weak breadth
The past 1.5 months has been dull for the U.S. stock market if you look at the S&P 500. The S&P mostly bounced sideways. This isn't true for tech traders though, who are probably partying like it's 1999.
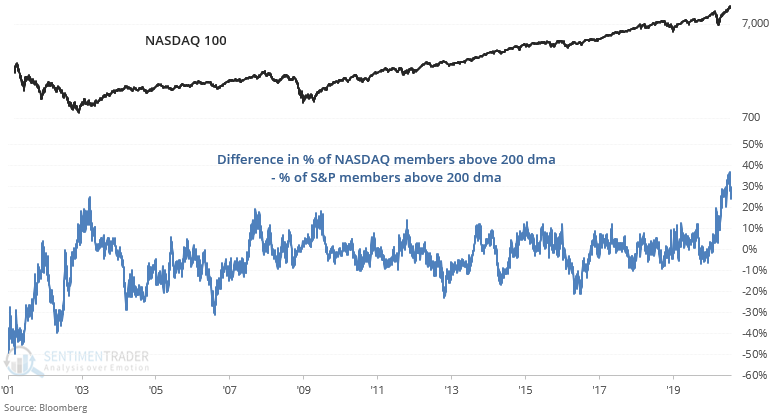
As one would expect, a large % of NASDAQ 100 stocks are firmly in a long term uptrend:
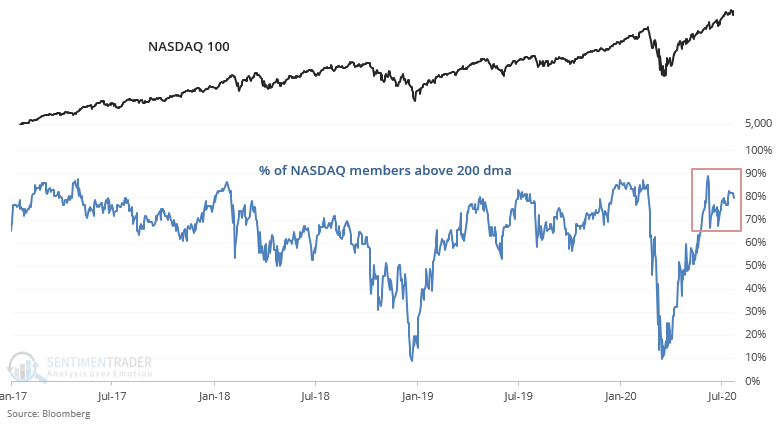
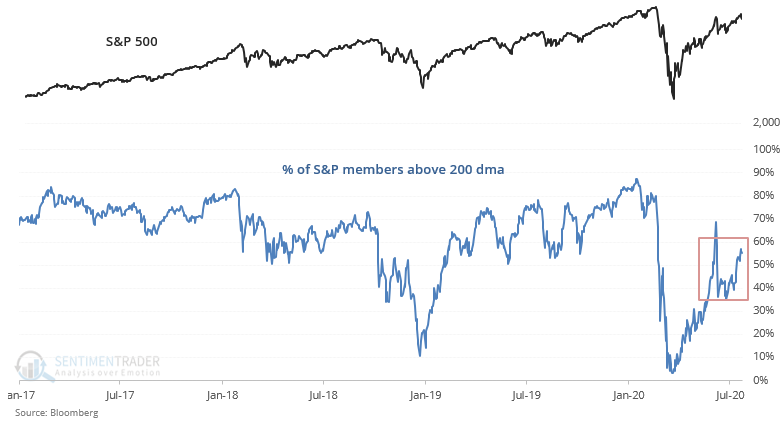
But the same cannot be said outside of tech, where barely half of S&P 500 stocks are above their 200 dma:
This created the widest gap between the % of NASDAQ stocks that are in an uptrend vs. the % of S&P stocks that are in an uptrend. I repeat, this is not an outright bearish sign, but one has to wonder how much longer this rally can be sustained without widespread participation:
Wrapping up
No one has a crystal into how the future will play out. Those who pretend that they do typically use arrogance to scare people into agreeing with them. Always remember that only you are responsible for your own portfolio. Look at data/charts like this carefully and with a skeptical eye. Always think for yourself.
With that being said, I hope these data points helped you understand some of the risks that the market faces right now. The U.S. stock market's rally is overextended, and this will probably lead to a pullback/correction in the weeks/months ahead. As always, stay alert and stay safe.
Regards,
Troy
Feel free to email me your thoughts at [email protected]