Wednesday Midday Color - Vol Surge, Dow Drops, Sector Extremes

Here's what's piquing my interest so far on this meandering day.
Vol Surge
There are no shortage of measures which capture the big move on Tuesday. Perhaps because of the headline-driven nature of the decline, historical comparisons are less appropriate, but that seems to be the case ever time. Each moment is unique, but investor behavior surrounding extremes still tends to stay relatively consistent.
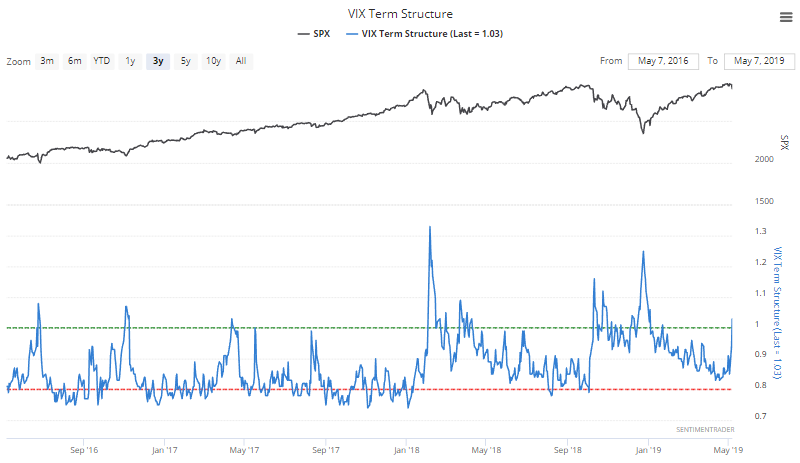
The sudden nature of the decline was enough to propel some fear about near-term volatility, triggering an inversion in the VIX Term Structure.
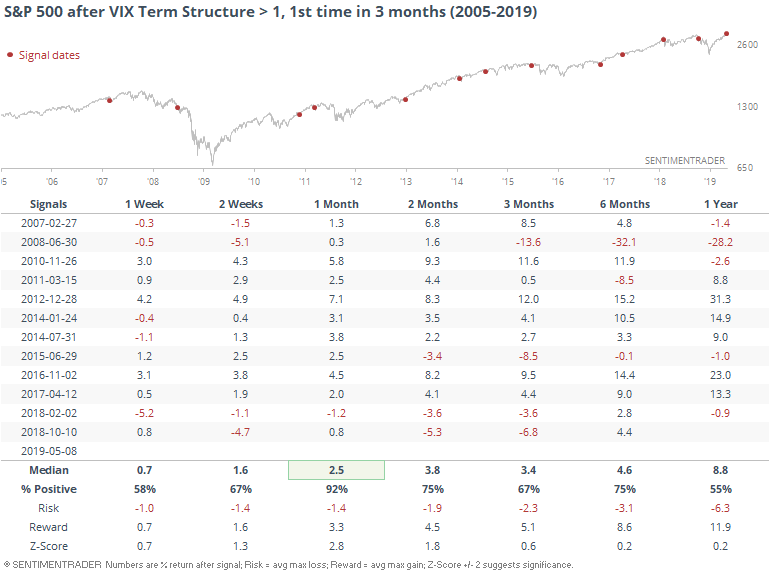
History is relatively short, most of which was dominated by a bull market. Because of that, when we look at future returns, they were excellent over the next month, with a 92% win rate. These are times when the Term Structure inverted for the 1st time in 3 months.
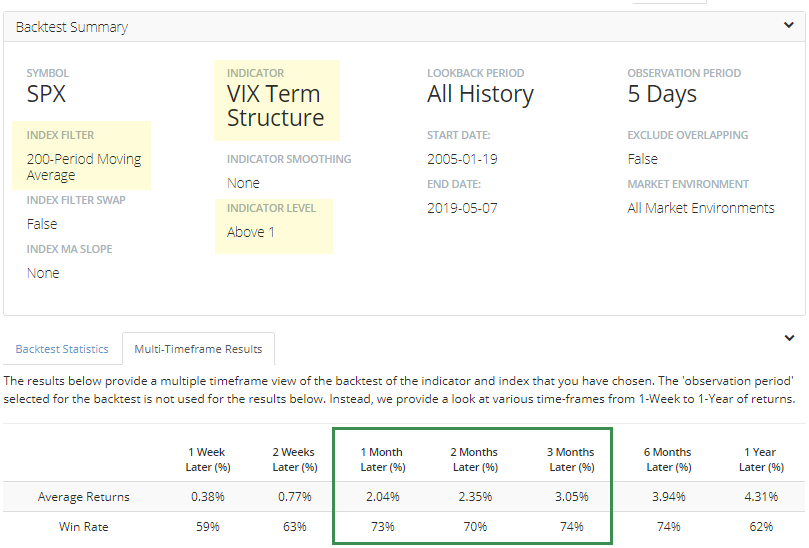
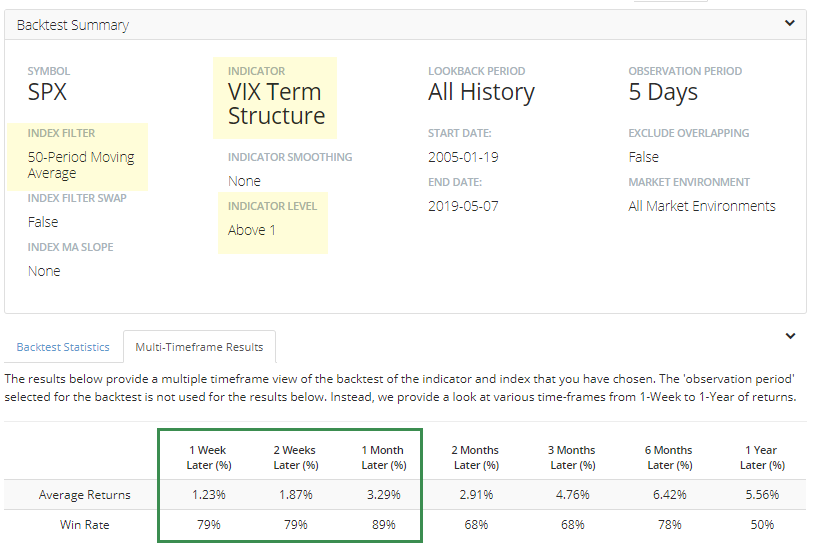
If we use the Backtest Engine to look at all days when there was this kind of short-term fear, while the S&P 500 was still above its 200-day average at the time, future returns were good, but not great, after the 128 days that qualified.
It was much less common (only 19 days) to see this happen when the S&P was trading above its 50-day average, and also more front-end loaded with returns.
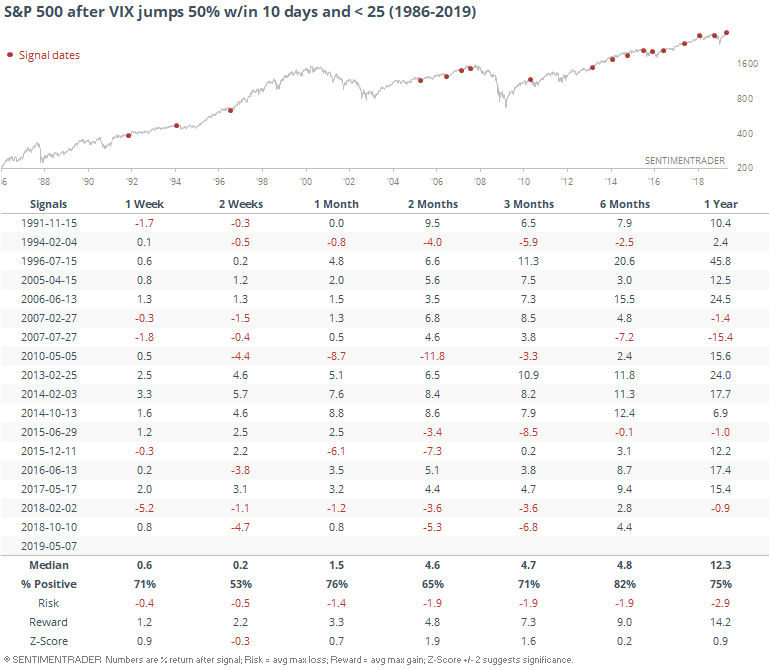
If we focus on the level of the VIX itself, Tuesday's spike caused it to rise more than 50% from its low over the past couple of weeks, but it's still below 25.
Even more extreme, it's still below 20.
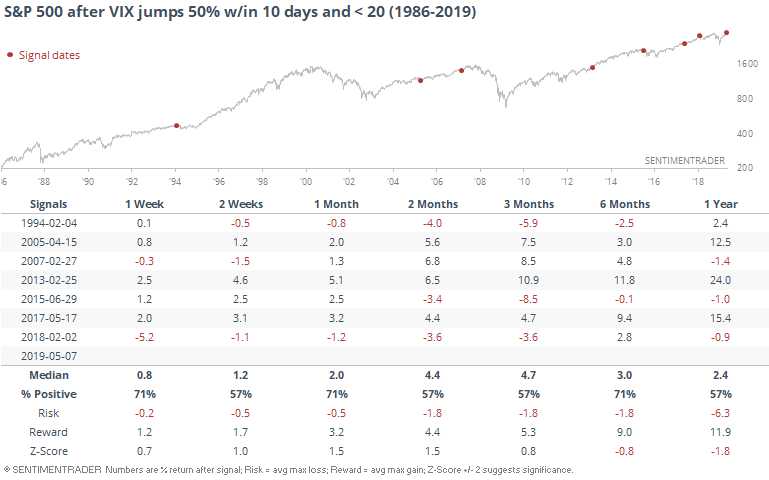
Both tended to lead to positive returns, but not with great consistency. Most remarkable about these signals is the low risk over the next few months. While there were some losses, there were only isolated times with ones larger than -5% on any time frame. So the "risk" part of the returns stayed extremely low up to six months later.
We rarely see volatility regimes change immediately from "extremely low" to "extremely high."
Shock Days
We've discussed behavior following "shock days" many times over the years, and Tuesday's session qualified in a number of ways. My personal favorite is looking at z-scores when stocks were near a price extreme. These incorporate the average daily returns that investors have gotten used to over a long period of time, as well as the daily variation in those returns.
Tuesday's session was 2 standard deviations below average, coming on a day when the S&P had been within 0.5% of a multi-year high.
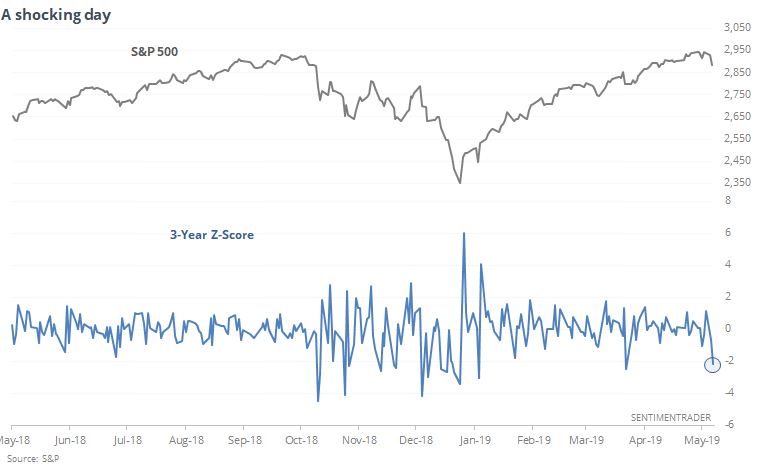
In the past, we've usually seen strongly positive returns following these kinds of days. That's still mostly the case when looked at using a 3-year time frame, but it's not super strong.
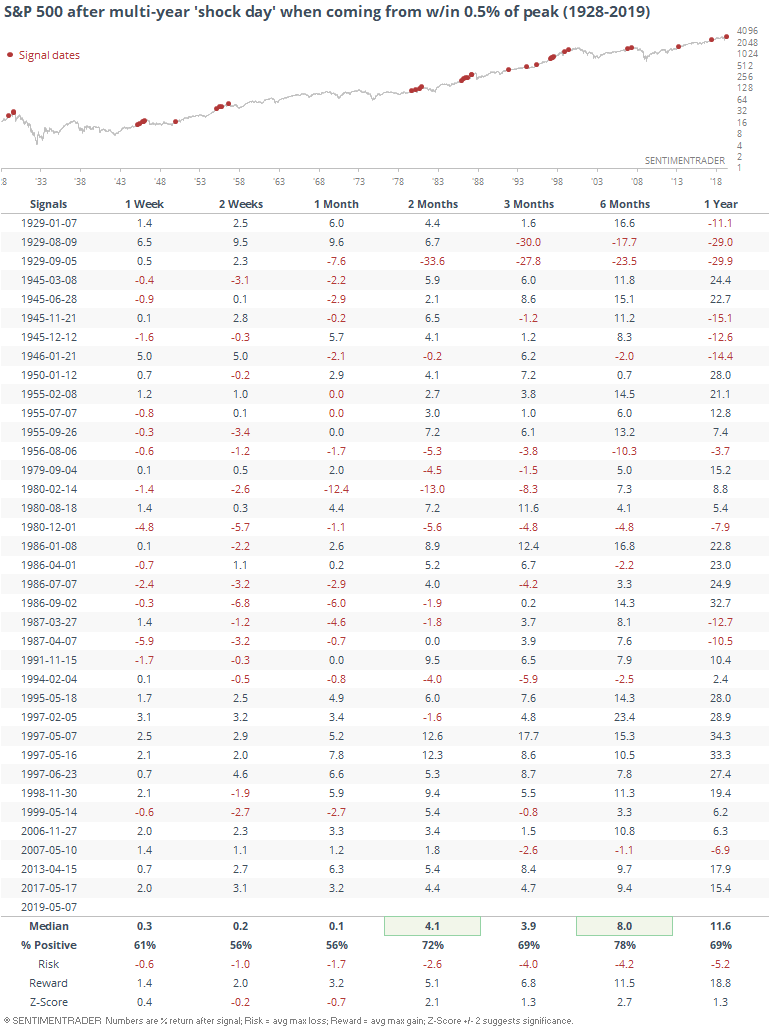
Since 1997, returns have been extraordinarily strong during the next 2 months.
Dow Dribbles
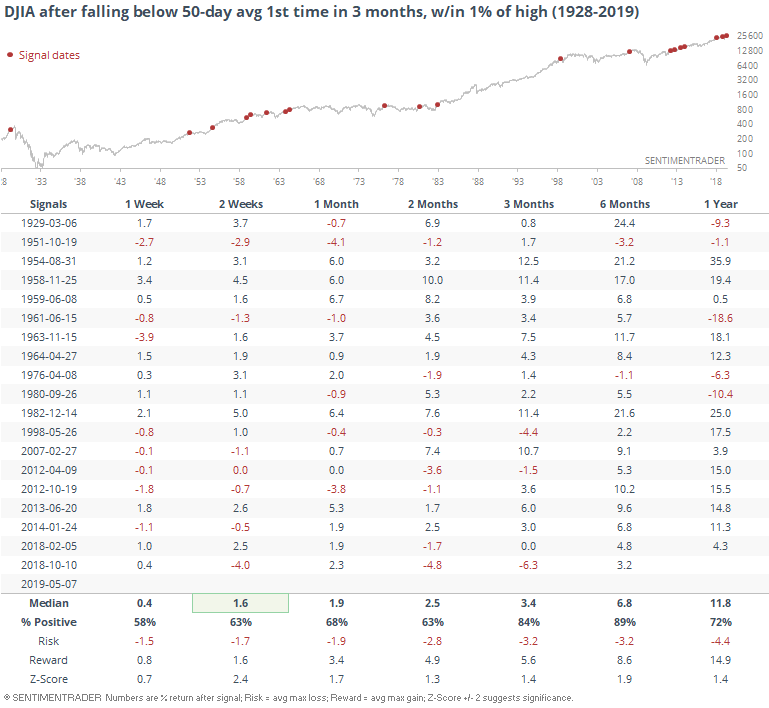
The Dow Jones Industrials Average was the first major average to fall below its 50-day average during what has been a tremendous couple of months. That's the first time in more than three months it's been below its medium-term average, and had been within 1% of a multi-year high in the past week.
It hasn't been an effective "get out now" signal at all.
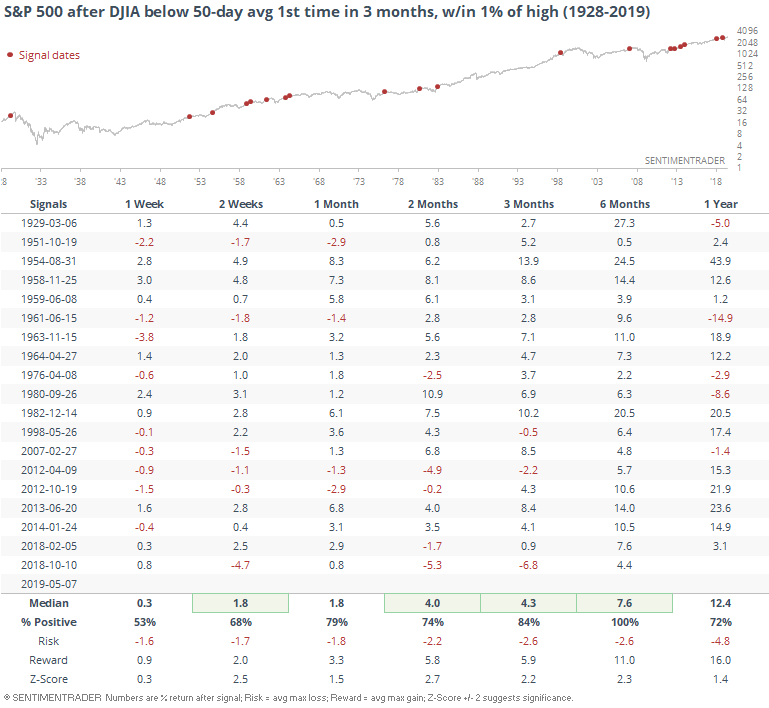
That was even more the case for the S&P. Six months after the Dow fell below its average, the S&P was higher all 19 times.
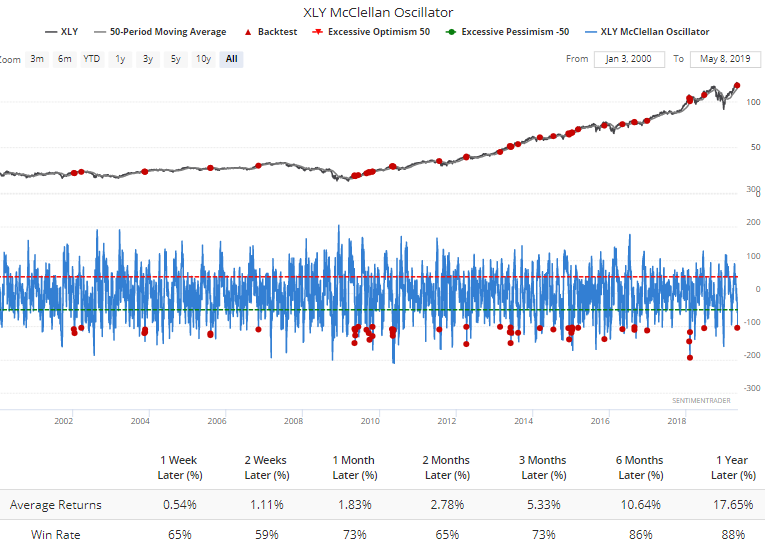
Sector Extremes
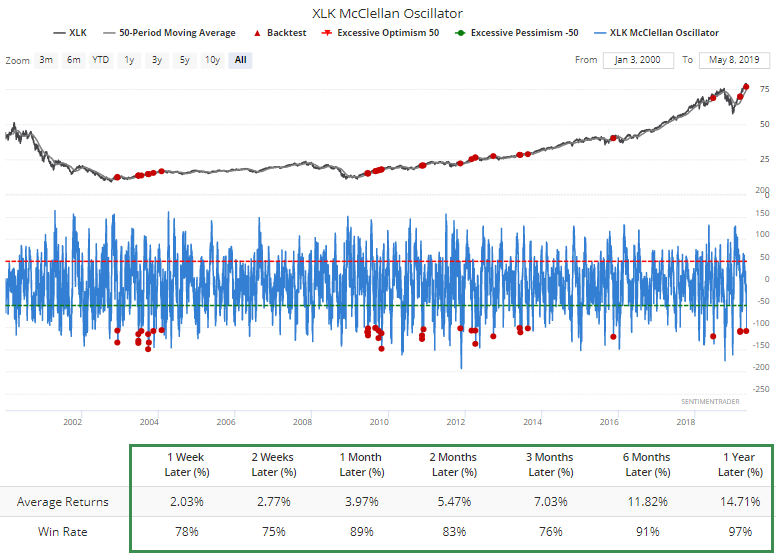
Among sectors, the carnage was enough that it pushed the McClellan Oscillator for discretionary stocks below -100. That's fairly rare when XLY is still trading above its 50-day average.
That was also the case for Swiss stocks, which had a stronger tendency to rebound in the weeks ahead.
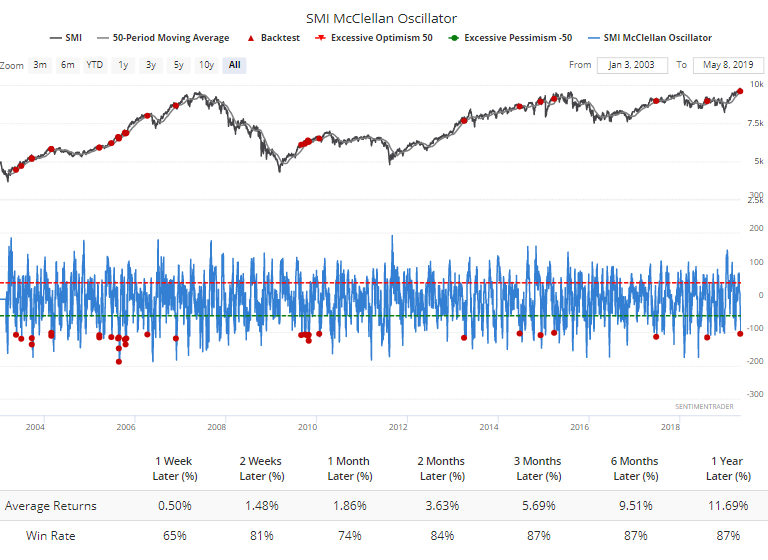
Same for technology stocks here in the U.S.
Also notable among tech is that fewer than 5% managed to remain above their short-term 10-day moving averages. This doesn't happen very often when the indices are still in medium-term uptrends (above the 50-day average).
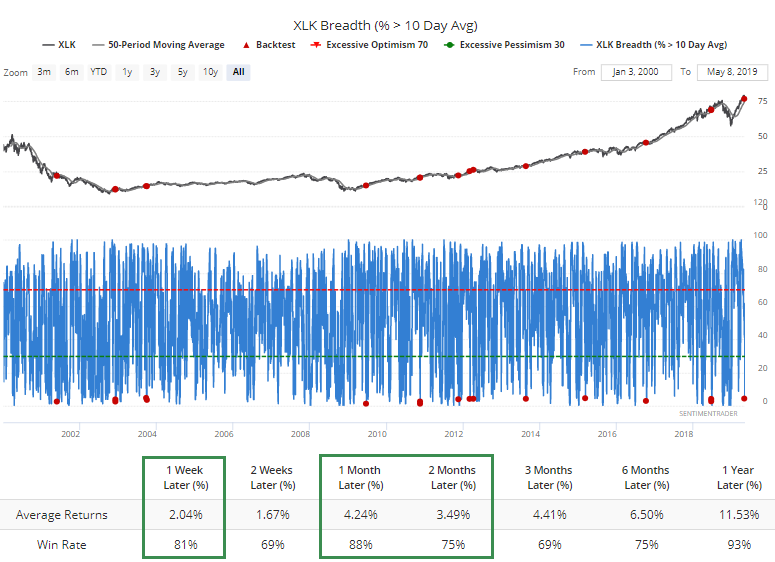
We can see that XLK had a pretty strong tendency to bounce.
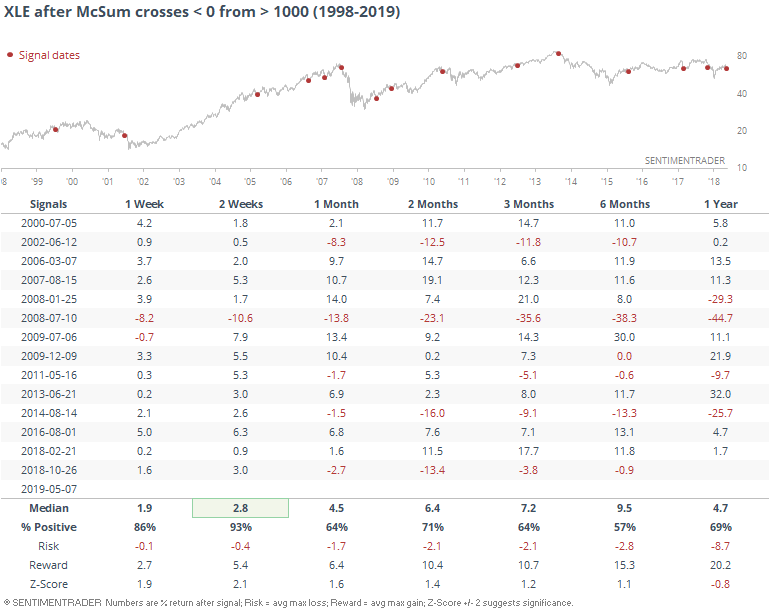
In energy, breadth momentum has waned so much that the McClellan Summation Index dropped below 0 for the first time in months, after being above +1,000.
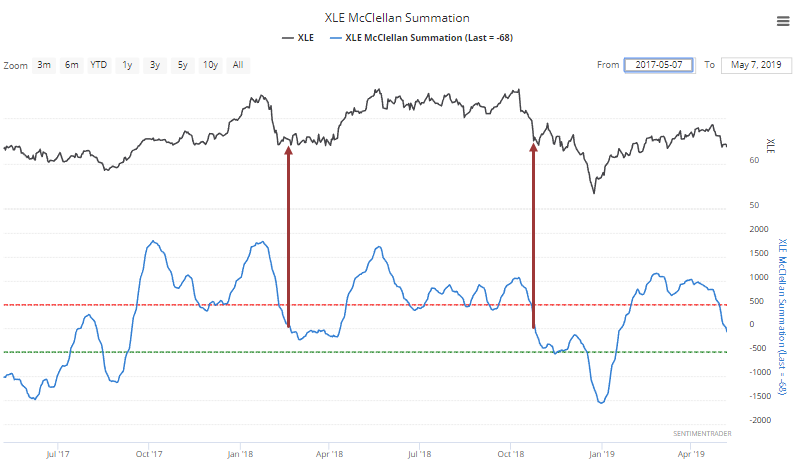
Historically, those stocks have bounced over the next couple of weeks, but there was that doozy of a loss during the financial crisis.