Wednesday Midday Color

Here's what's piquing my interest so far today.
Gap And Go?
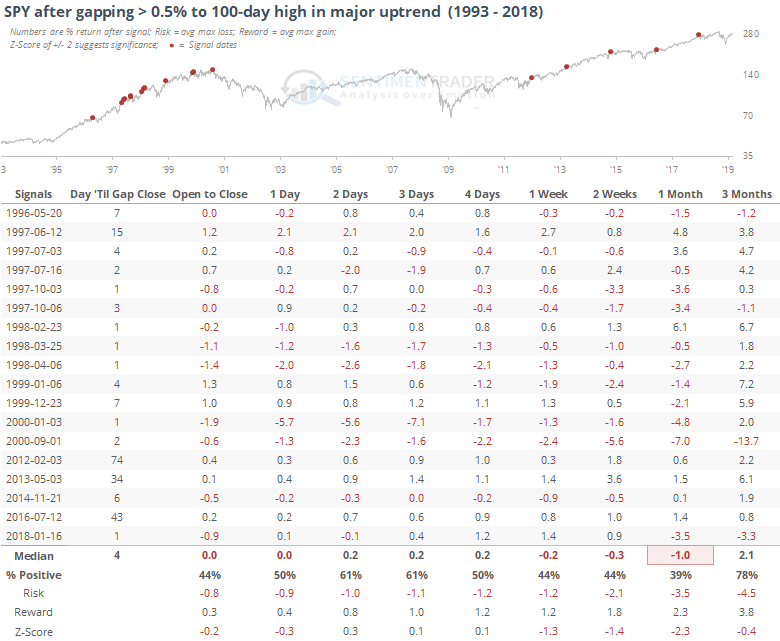
The gap up this morning faded a bit right before the open, but SPY still managed to add nearly half a percent before regular trading opened. This comes on the heels of a 100-day high during a major uptrend. That's triggered a few times since the financial crisis, otherwise only during the late 1990s.
It took an average of 4 days before the gap was filled, but mostly that was due to them closing quickly in the 90s. Not so much in the past 7 years. If we focus on that time, we can see that it took an average of more than 30 days.
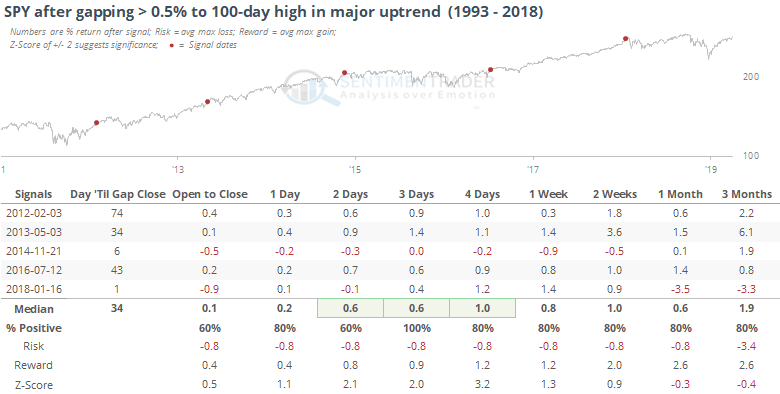
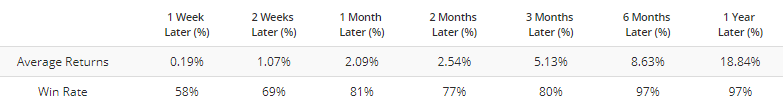
Over the next few sessions, SPY added to its opening gains every time, though they were still relatively modest. And by a month later, SPY averaged a gain of only 0.6%, with none of them being more than 1.5% higher than when it gapped up. If we're in the same kind of market environment, then this morning's gap (while not quite qualifying for the study) suggests there could be more upside, but it's likely limited and subject to falling below Tuesday's close at some point. Not a high probability of a "gap and go" scenario.
Breaking Barriers
Chinese stocks continue to recover from the minor digestion following the initial blast-off from the lows earlier this year. The rally has been broad-based enough that more than 90% of stocks in the Shanghai Composite, or more than 1200 of the ~1400 stocks, are now above their 200-day moving averages.
During the rally in 2016, it wasn't broad-based or long-lasting enough to reach this threshold.
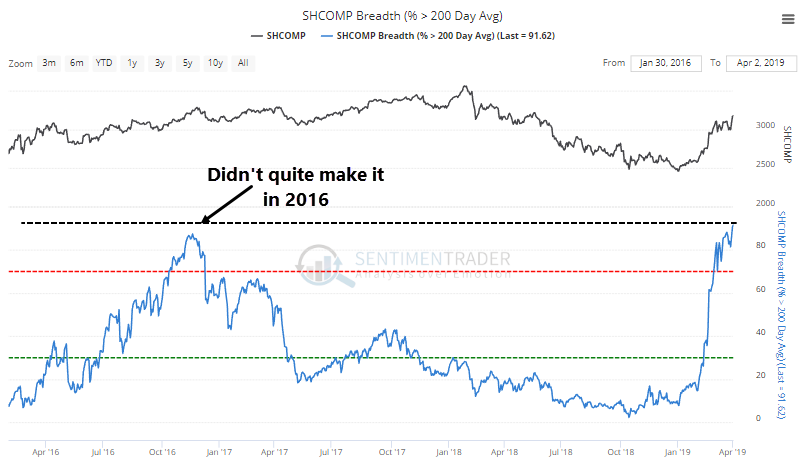
Going back to 2002, this is only the third time it's happened. All three saw the Shanghai settle back in the days ahead, but all three also marked long-term inflection points.
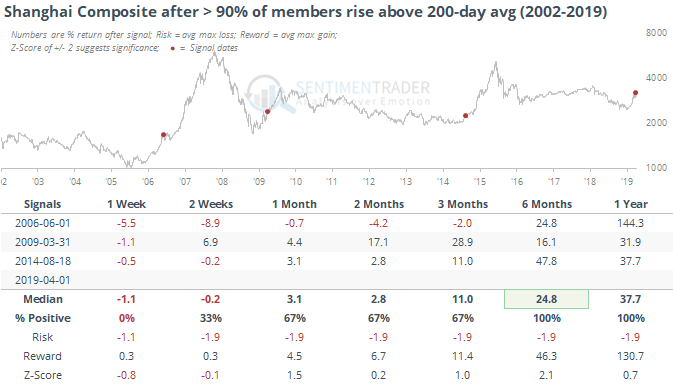
When the rallies reached this threshold, it was a sign that investors were moving back into stocks in a big way, and they all saw the index tack on at least another 30% over the next year. The risk/reward was heavily skewed to the upside, with most of the risk concentrated in the very short-term.
FOMO-MOMO Market
This is starting to be a FOMO-MOMO Market (Fear Of Missing Out on Momentum)
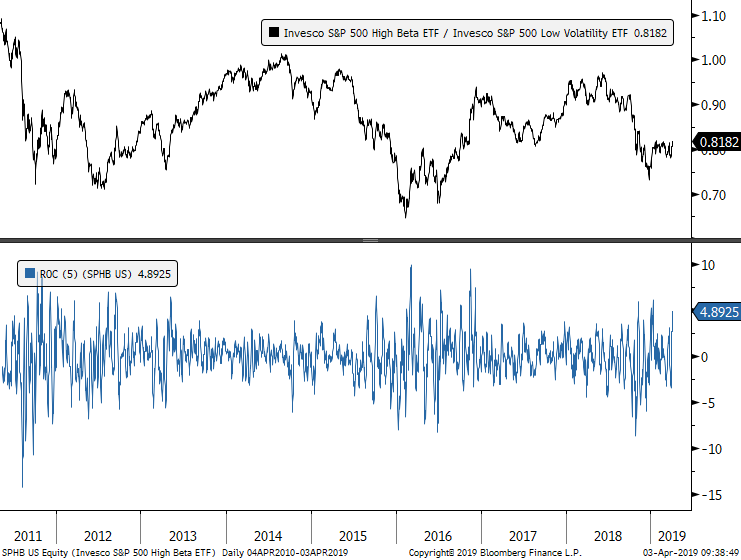
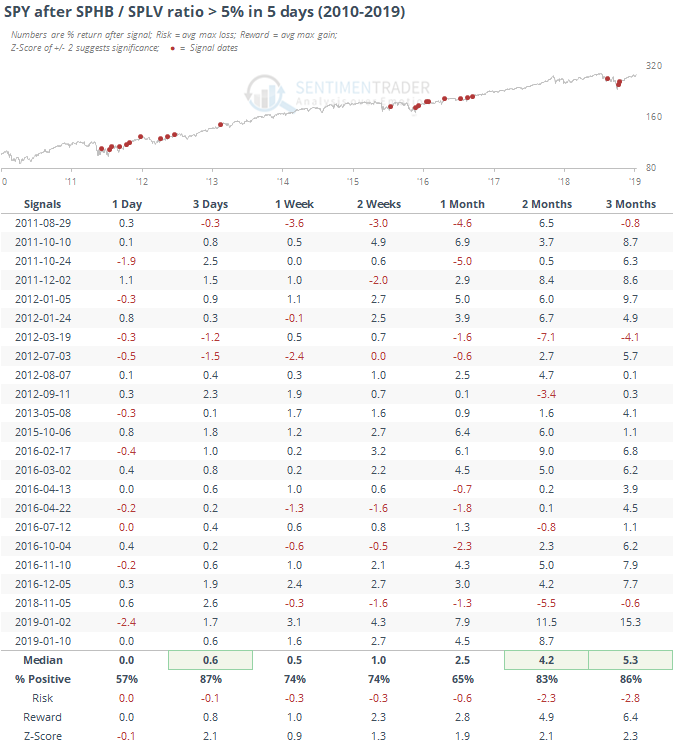
The ratio of the S&P 500 High Beta ETF to the S&P 500 Low Volatility ETF is spiking, as traders rush to take on higher-risk stocks. The 5-day rate of change of the ratio is up nearly 5%, one of the largest weekly rushes in risk-on sentiment since 2011.
This has been mostly a good shorter-term sign for SPY itself, though most of the bigger gains came as this ratio initially surged out of a risk-off period, and not after months of rallying like we have now.
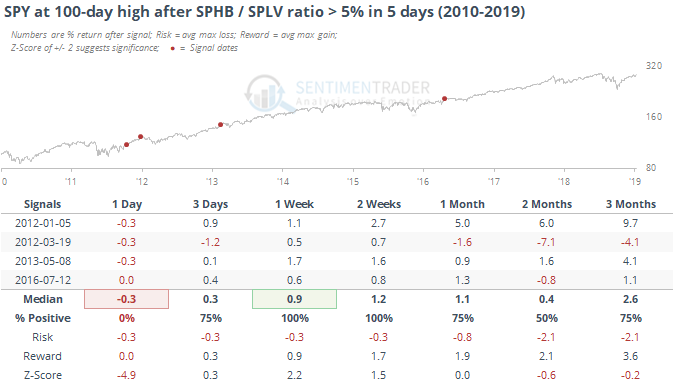
When SPY was at a 100-day high at the time of the risk-on surge, it still added to gains over the next few sessions but only the Jan 2012 one managed to see SPY keep rallying basically uninterrupted.
Another sign of sudden risk-off mentality could be the big outflow from gold, with GLD losing nearly $500 million on Tuesday alone. That hasn't been a big plus for GLD since it peaked in 2011, other than in the very short-term.
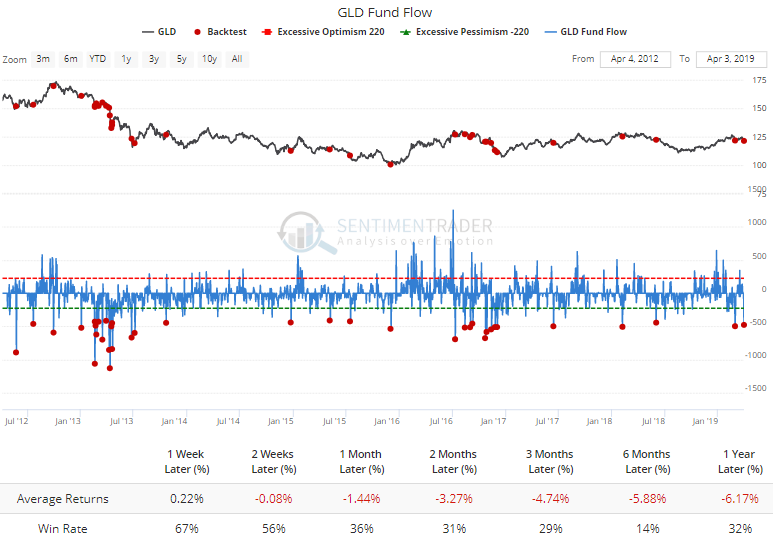
Interestingly, it's been a pretty good sign for SPY.