Data &
Technology
Research
Reports
Report Solutions
Reports Library
Actionable
Strategies
Free
Resources
Simple Backtest Calculator
Simple Seasonality Calculator
The Kelly Criterion Calculator
Sentiment Geo Map
Public Research Reports
Free Webinar
Pricing
Company
About
Meet Our Team
In the News
Testimonials
Client Success Stories
Contact
Log inLoginSign up
< BACK TO ALL REPORTS

Wednesday Midday Color - Technical Buy, Asia Flows, Economic Woes

Jason Goepfert
2019-05-22
null

Here's what's piquing my interest so far on this waiting-for-the-Fed day.

Momentum Shift

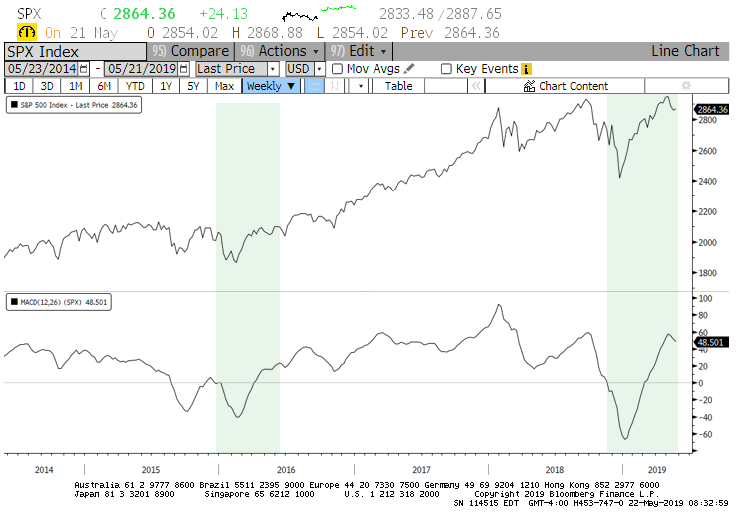
Marketwatch notes that there has been a long-term momentum shift in stocks that has had an unerring ability to lead to higher prices. This last happened in 2016, according to a popular technical indicator.

If we look for times when MACD had been negative for at least 12 weeks and then turned positive for 12 weeks, it has been a positive signal for forward returns across all time frames, with good consistency on longer-term ones. A year later, there was only a single loss, and it was minuscule.

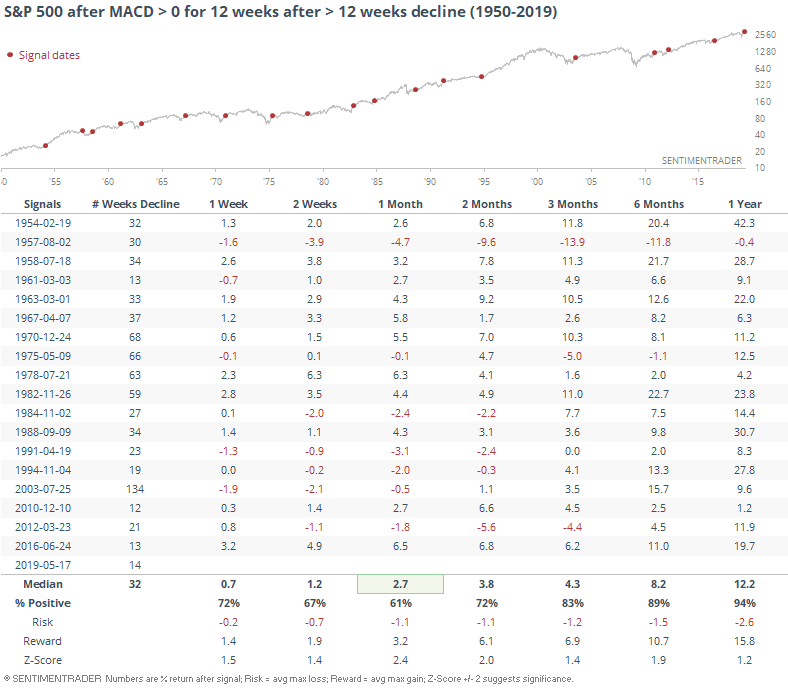
If we focus on longer time frames, returns continued to be somewhere between good and excellent. Over the next 2 years, there was a 100% win rate and the risk/reward ratio was ridiculously skewed to the upside.

This is not an indicator we regularly follow, we could always find one indicator or another that gives whatever message we want to send, and it didn't work so well pre-1950, so won't be including it in the Active Studies. It's some confirmation that the previous momentum studies we've looked at, though, are still valid.

Flow

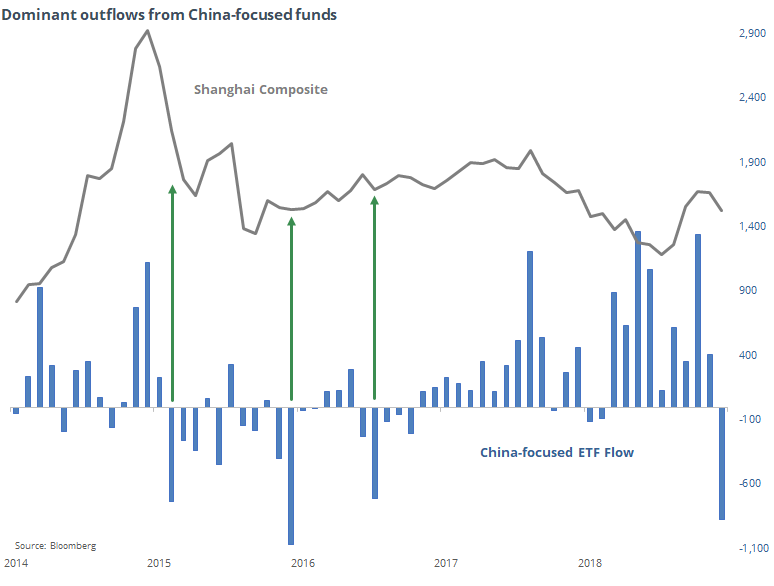
So far this month, investors have been busy pulling money from ETFs focused in Asia. Pretty much all other major regions as well, but not to nearly the same extent. 

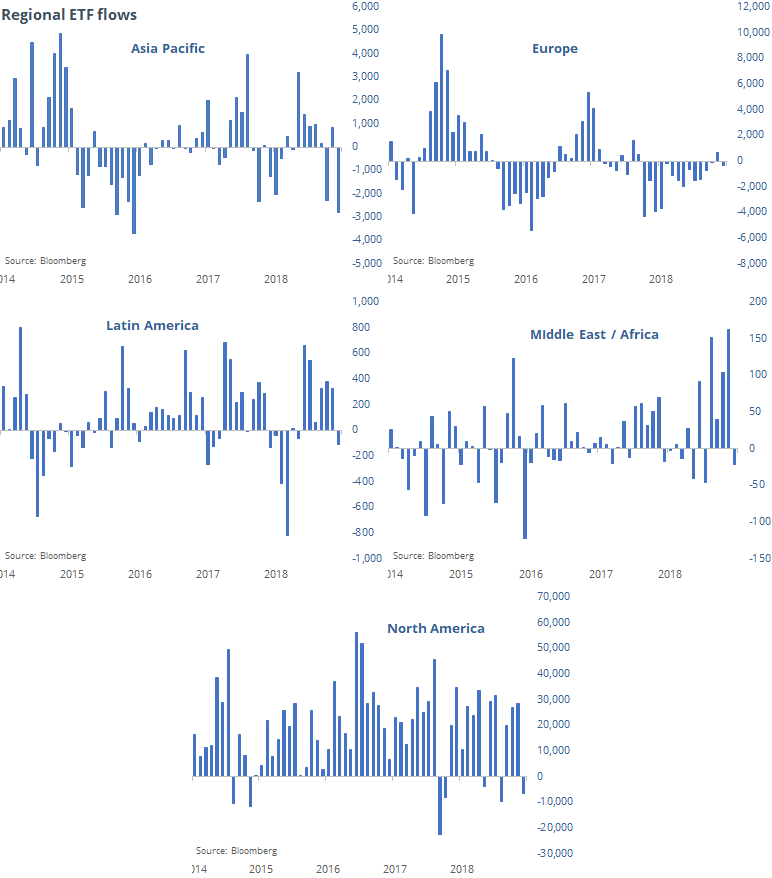
Much of that outflow in Asian funds is focused on China, with the consensus opinion being that investors are nervous about the trade war and other economic worries.

Fund flows are an iffy indicator sometimes, and that seems to be the case here. While a huge outflow seems like it should be a potential buy signal, it has been inconsistent the few times it has been seen before.

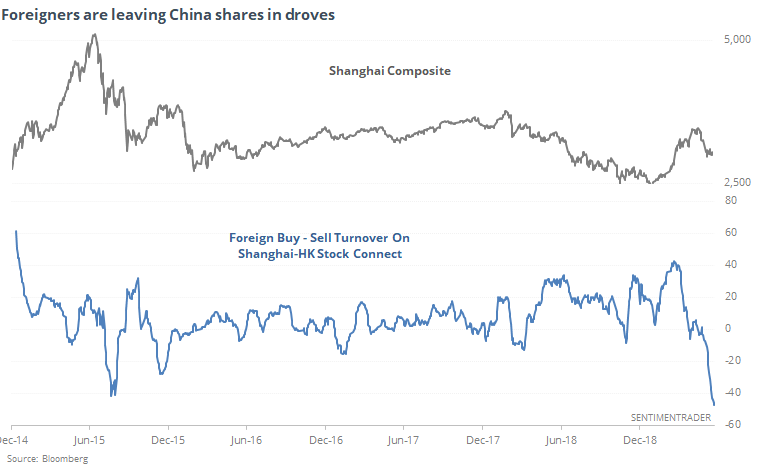
We can also see foreigners leaving Chinese shares via the Shanghai - Hong Kong Stock Connect program. Over the past 20 days, the outflow has hit a record low. It has a mixed record at being a contrary (or otherwise) indicator, however.

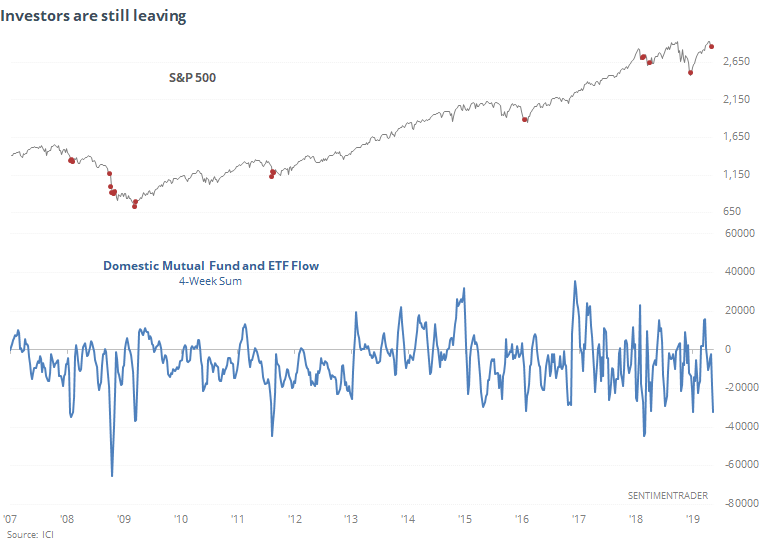
We've already touched on this before, but the latest aggregate fund flow data from the Investment Company Institute shows that investors in domestic (U.S.-focused) mutual funds and ETFs have pulled more than $34 billion in assets over the past four weeks. The little red dots on the chart show us that other times flows have been this negative, stocks did well (okay, the fall of 2008 not so much).

Economic Woes

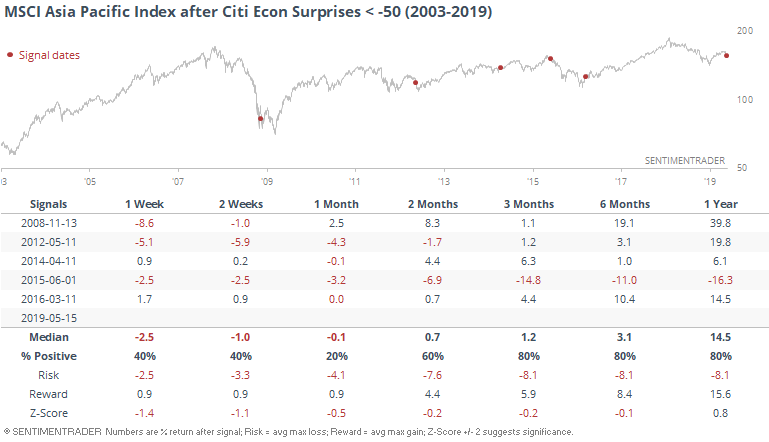
The WSJ notes that part of the nervousness in Asian shares is due to poor economic results. The Citigroup Economic Surprise Index for Asian Pacific countries is down to -50, one of the worst readings in 16 years.

As we've seen with other economic surprise indexes, this is usually more of a contrary indicator for stocks than it is a harbinger of trouble ahead. By the time economic reports have been this bad, for this long, stocks have typically already born the brunt of the selling pressure from forward-looking investors.

Sorry, you don't have access to this report

Upgrade your subscription plan to get access
Go to Dasboard
DATA &
TECHnologies
IndicatorEdge
‍
BackTestEdge
‍
Other Tools
‍
DataEdge API
RESEARCH
reports
Research Solution
‍
Reports Library
‍
actionable
Strategies
Trading Strategies
‍
Smart Stock Scanner
‍
FREE
RESOUrCES
Simple Backtest
Calculator
Simple Seasonality
Calculator
The Kelly Criterion
Calculator
Sentiment Geo Map
‍
Public Research Reports
‍
Free Webinar
COMPANY
‍
About
‍
Meet our Team
‍
In the News
‍
Testimonials
‍
Client Success Stories
Pricing
Bundle pricing
‍
Announcements
‍
FAQ
© 2024 Sundial Capital Research Inc. All rights reserved.
Setsail Marketing
TermsPrivacyAffiliate Program
Risk Disclosure: Futures and forex trading contains substantial risk and is not for every investor. An investor could potentially lose all or more than the initial investment. Risk capital is money that can be lost without jeopardizing ones’ financial security or life style. Only risk capital should be used for trading and only those with sufficient risk capital should consider trading. Past performance is not necessarily indicative of future results.

Hypothetical Performance Disclosure: Hypothetical performance results have many inherent limitations, some of which are described below. No representation is being made that any account will or is likely to achieve profits or losses similar to those shown; in fact, there are frequently sharp differences between hypothetical performance results and the actual results subsequently achieved by any particular trading program. One of the limitations of hypothetical performance results is that they are generally prepared with the benefit of hindsight. In addition, hypothetical trading does not involve financial risk, and no hypothetical trading record can completely account for the impact of financial risk of actual trading. for example, the ability to withstand losses or to adhere to a particular trading program in spite of trading losses are material points which can also adversely affect actual trading results. There are numerous other factors related to the markets in general or to the implementation of any specific trading program which cannot be fully accounted for in the preparation of hypothetical performance results and all which can adversely affect trading results.

Testimonial Disclosure: Testimonials appearing on this website may not be representative of other clients or customers and is not a guarantee of future performance or success.