Data &
Technology
Research
Reports
Report Solutions
Reports Library
Actionable
Strategies
Free
Resources
Simple Backtest Calculator
Simple Seasonality Calculator
The Kelly Criterion Calculator
Sentiment Geo Map
Public Research Reports
Free Webinar
Pricing
Company
About
Meet Our Team
In the News
Testimonials
Client Success Stories
Contact
Log inLoginSign up
< BACK TO ALL REPORTS

Wednesday Midday Color - Big Outflows, More Hedging, Falling Momo

Jason Goepfert
2019-05-15
null

Here's what's piquing my interest so far today.

Flows

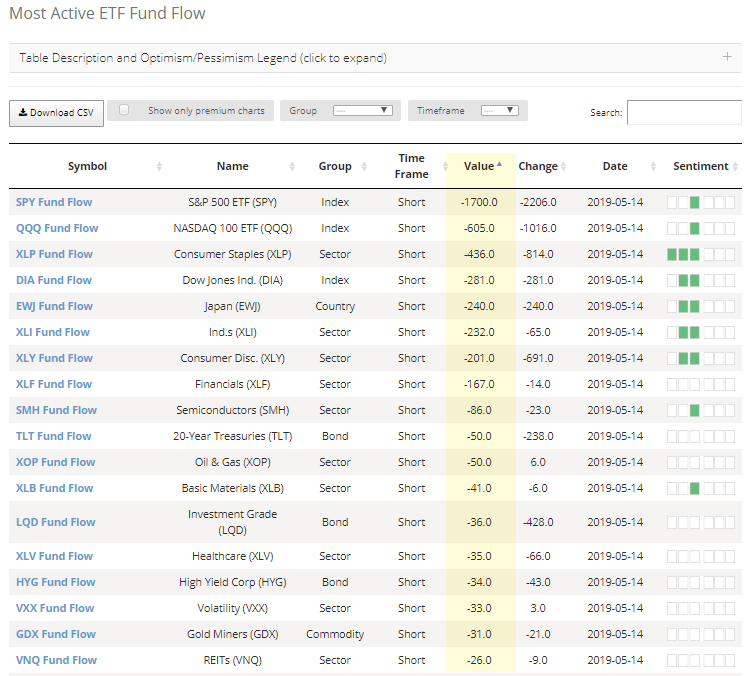
On Tuesday, there were outflows among a large number and variety of equity funds. A bunch of them lost more than $25 million in assets on the day, led by the two most popular.

That continues a trend for both SPY and QQQ. Across all of the major index, sector, and country ETFs that we follow, they've lost more than $20 billion in assets over the past two weeks.

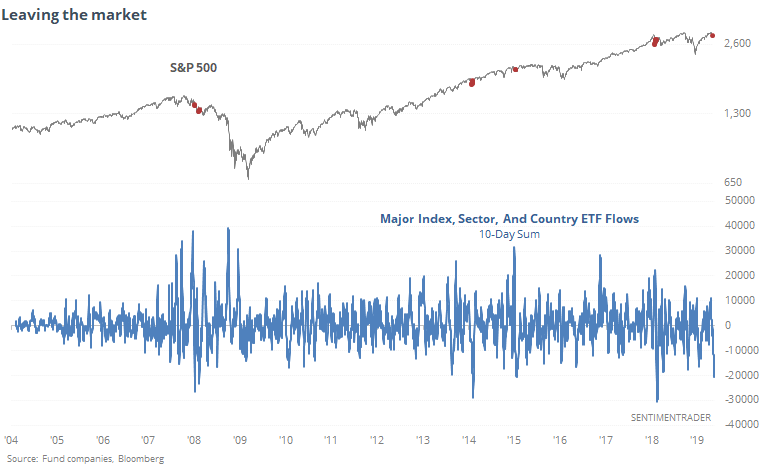
We can see from the chart above that when the flows get this heavily tilted to the downside, it's meant some relief for stocks, for a while at least.

Hedging

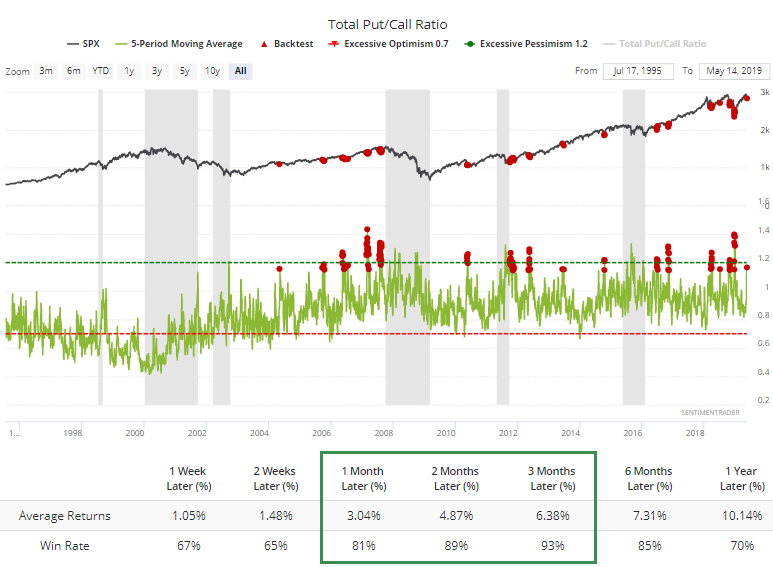
There has also been a pickup in assumed hedging activity, judging by the protracted rise in the Total Put/Call Ratio. It has been above 1.0 for the past 5 sessions, meaning more puts have been traded than calls every day for the past week. The average is now 1.15, which has been high enough to be contrarian on a medium-term time frame.

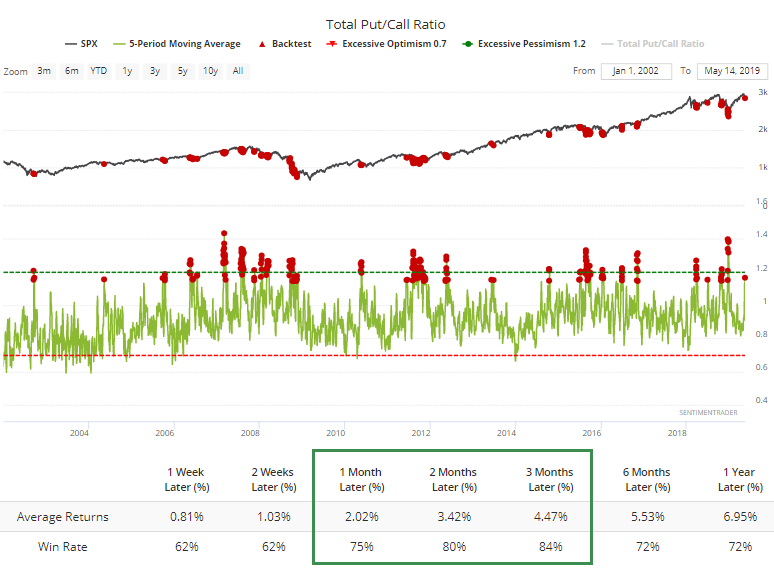
Especially during bull markets.

Breadth Review

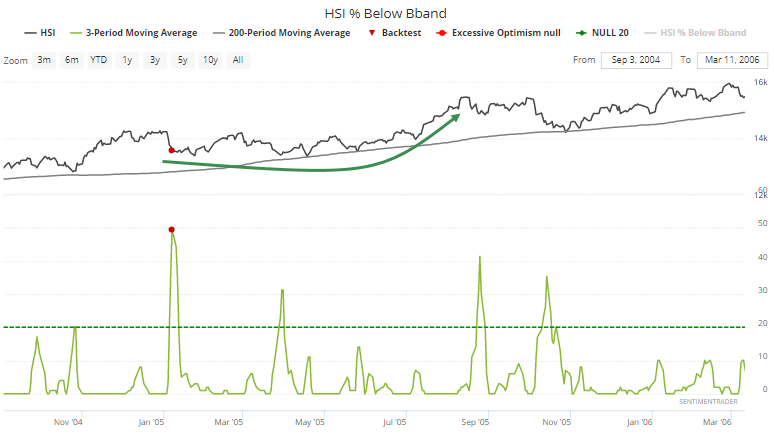
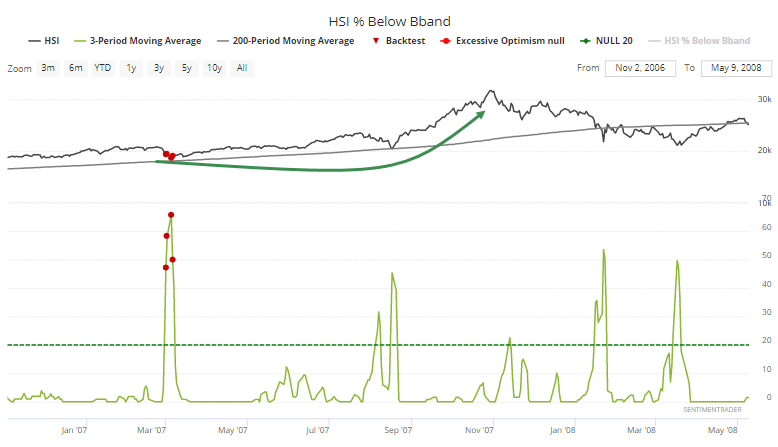
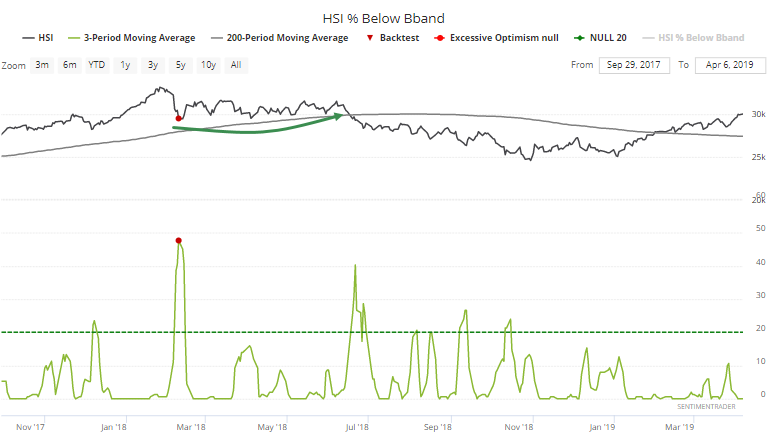
Within the Hang Seng, an average of more than 45% of stocks have traded below their lower volatility bands over the past 3 sessions. That's a very high figure for when the index itself is still trading above its 200-day average. It has triggered only a few other times, all leading to medium-term gains, but one had to be nimble in 2018.

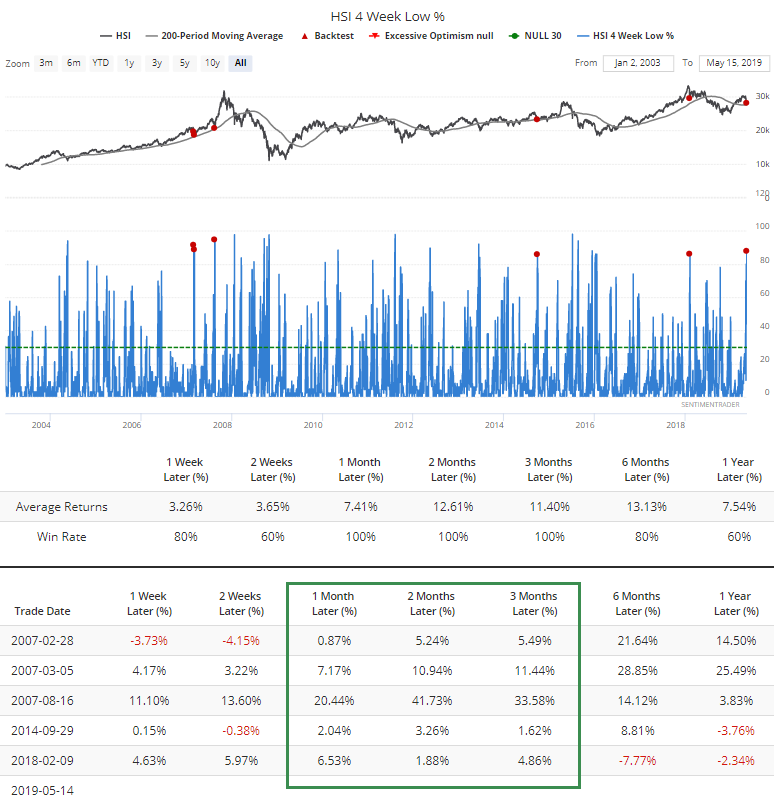
This is also one of the few times that more than 85% of stocks in the index collapsed to at least a one-month low while the index was still above its long-term average.

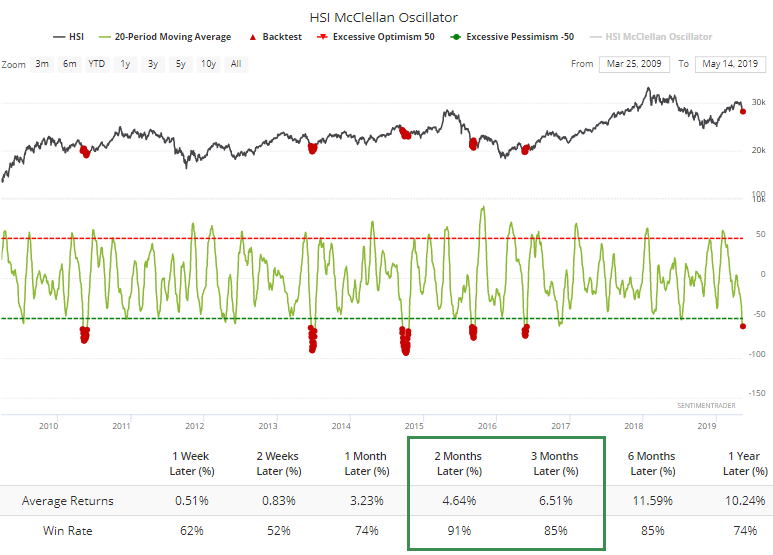
The selling has been intense, broad, and persistent enough to drag the 20-day average of the McClellan Oscillator for the Hang Seng below -60. Including all market environments, it has dropped this low five other times, all since 2010.

Momentum has ebbed enough that the McClellan Summation Index dropped below 0. Very generally, markets do better when the Summation is above zero than below.

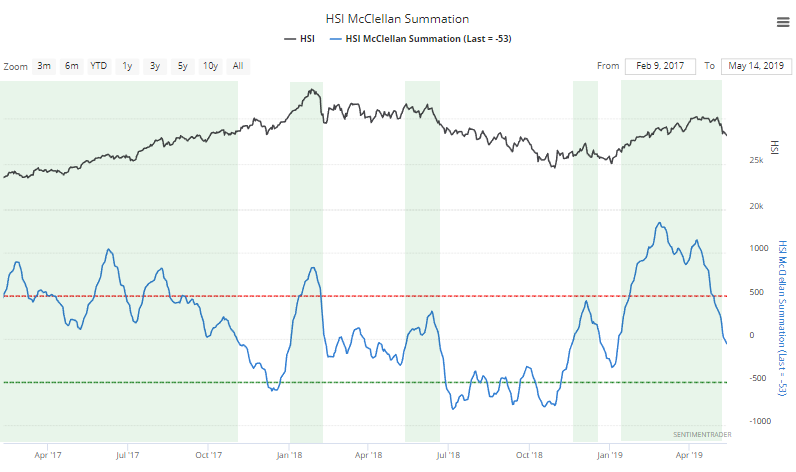
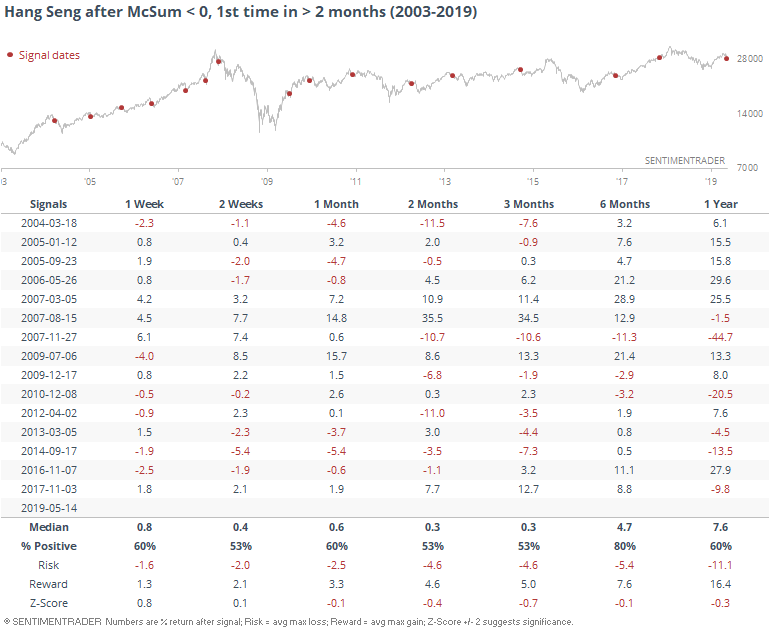
A mitigating factor is that momentum had been strong enough that the Summation Index was above zero for months before falling below. After these kinds of scenarios, returns were better...but it's still best of the indicator goes back above the zero line.

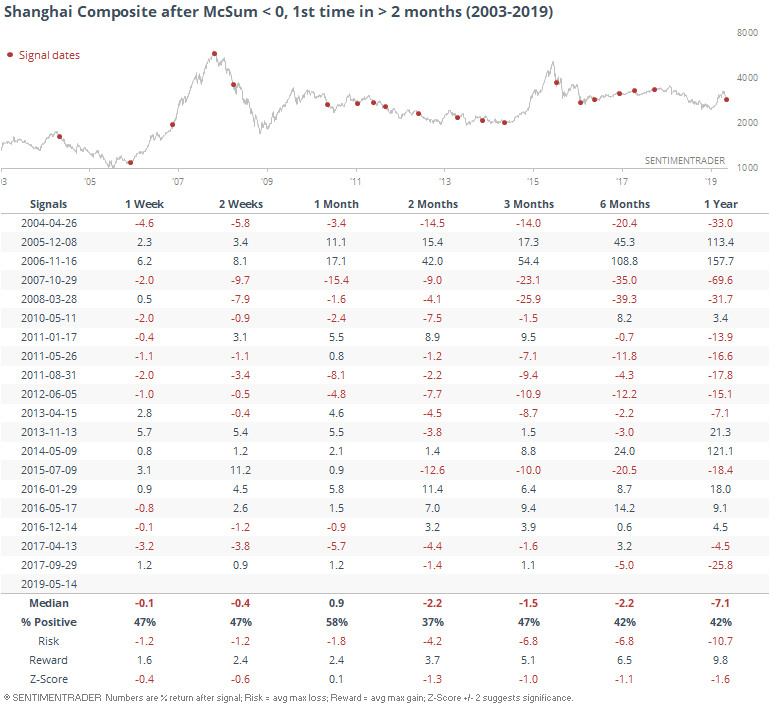
It's also happening in the Shanghai Composite.

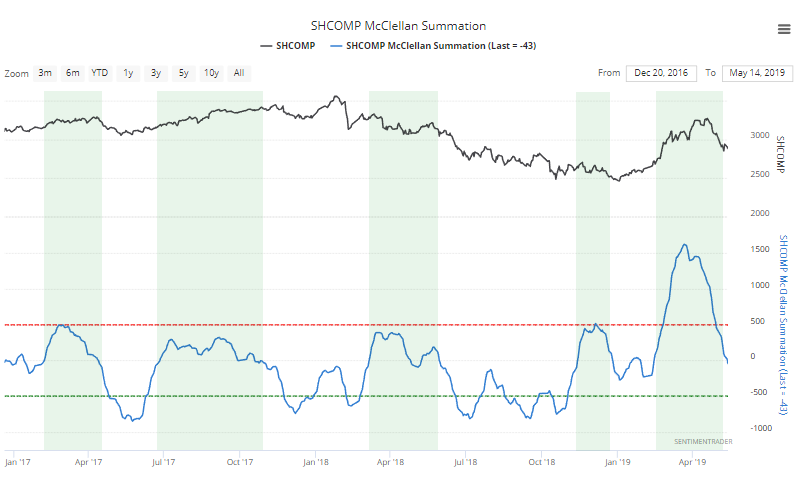
Here, the loss of long-term underlying momentum has been much more of an issue.

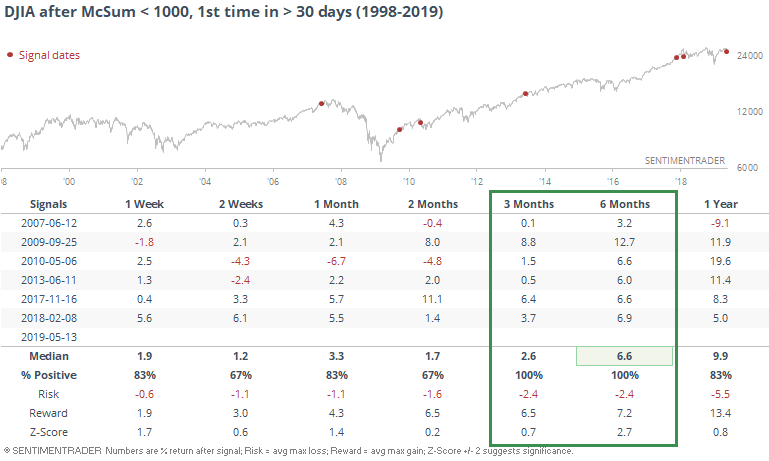
In the U.S. momentum has been much strong, and the Summation Indexes for the major indexes and sectors are all much higher than overseas markets. For the Dow Industrials, the Summation just fell below 1000 for the first time in more than 30 days.

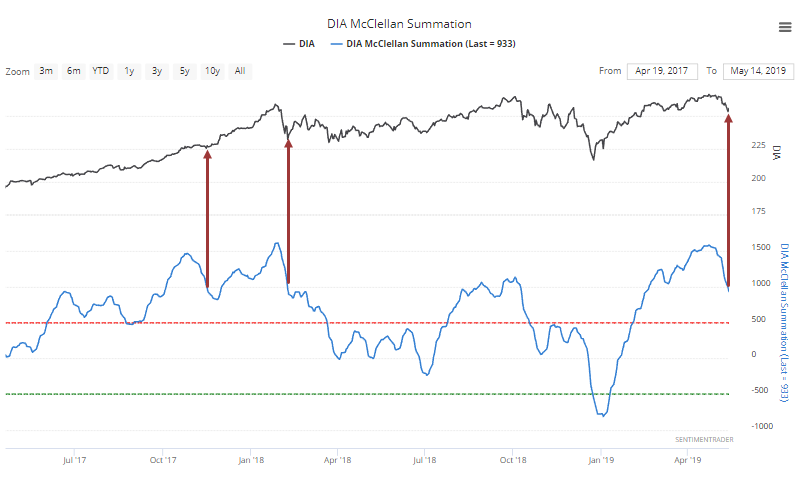
Since 1998, there haven't been many times it went this long with this kind of persistent momentum. it was a good medium-term sign.

Sorry, you don't have access to this report

Upgrade your subscription plan to get access
Go to Dasboard
DATA &
TECHnologies
IndicatorEdge
‍
BackTestEdge
‍
Other Tools
‍
DataEdge API
RESEARCH
reports
Research Solution
‍
Reports Library
‍
actionable
Strategies
Trading Strategies
‍
Smart Stock Scanner
‍
FREE
RESOUrCES
Simple Backtest
Calculator
Simple Seasonality
Calculator
The Kelly Criterion
Calculator
Sentiment Geo Map
‍
Public Research Reports
‍
Free Webinar
COMPANY
‍
About
‍
Meet our Team
‍
In the News
‍
Testimonials
‍
Client Success Stories
Pricing
Bundle pricing
‍
Announcements
‍
FAQ
© 2024 Sundial Capital Research Inc. All rights reserved.
Setsail Marketing
TermsPrivacyAffiliate Program
Risk Disclosure: Futures and forex trading contains substantial risk and is not for every investor. An investor could potentially lose all or more than the initial investment. Risk capital is money that can be lost without jeopardizing ones’ financial security or life style. Only risk capital should be used for trading and only those with sufficient risk capital should consider trading. Past performance is not necessarily indicative of future results.

Hypothetical Performance Disclosure: Hypothetical performance results have many inherent limitations, some of which are described below. No representation is being made that any account will or is likely to achieve profits or losses similar to those shown; in fact, there are frequently sharp differences between hypothetical performance results and the actual results subsequently achieved by any particular trading program. One of the limitations of hypothetical performance results is that they are generally prepared with the benefit of hindsight. In addition, hypothetical trading does not involve financial risk, and no hypothetical trading record can completely account for the impact of financial risk of actual trading. for example, the ability to withstand losses or to adhere to a particular trading program in spite of trading losses are material points which can also adversely affect actual trading results. There are numerous other factors related to the markets in general or to the implementation of any specific trading program which cannot be fully accounted for in the preparation of hypothetical performance results and all which can adversely affect trading results.

Testimonial Disclosure: Testimonials appearing on this website may not be representative of other clients or customers and is not a guarantee of future performance or success.