
Wednesday Midday Color - Sagging Summation, Missing MoMo, Strategist Switch

Here's what's piquing my interest as traders await the latest guidance from the Fed.
Breadth Review
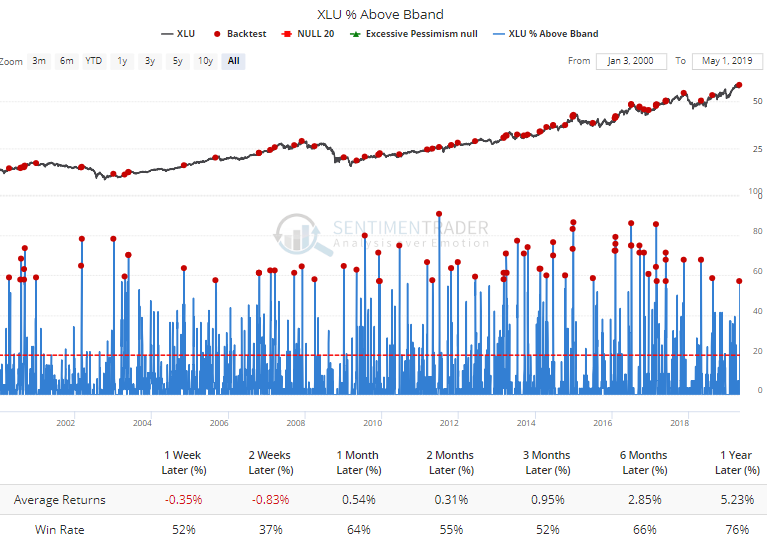
Utilities have picked up again. Most of the breadth measures are meandering around neutral or slightly stretch. The big move yesterday, though, pushed nearly 60% of those stocks outside of their upper Bollinger Bands. It's been tough for XLU to hold short-term gains after such a quick move for such a usually slow-moving group.
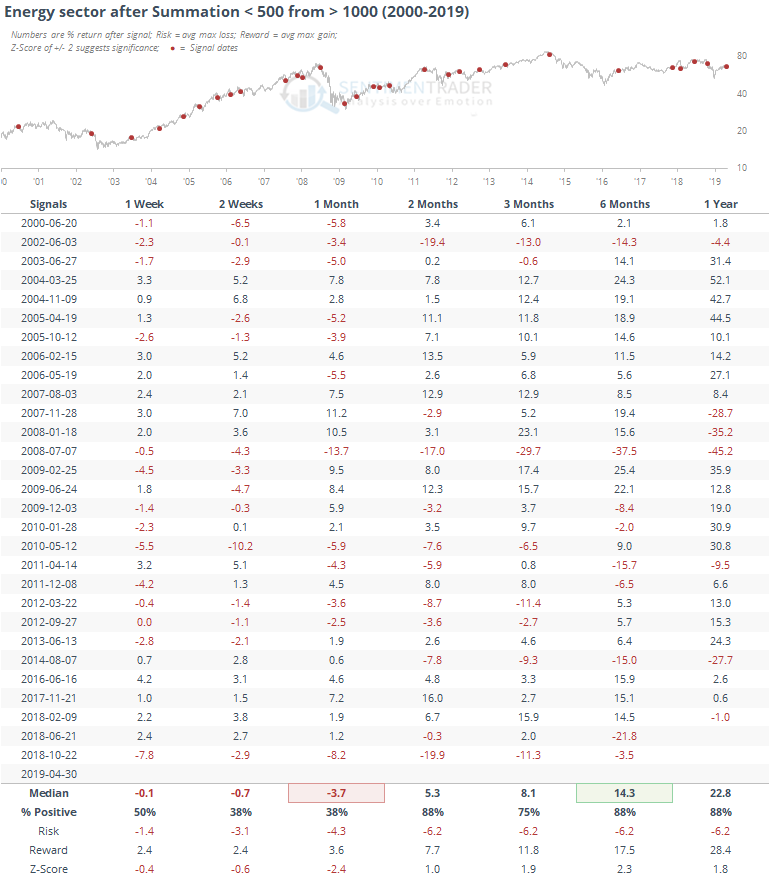
Long-term breadth momentum has waned enough in the energy sector that the McClellan Summation Index has crossed below 500 after being above 1000 at some point in the past six months.
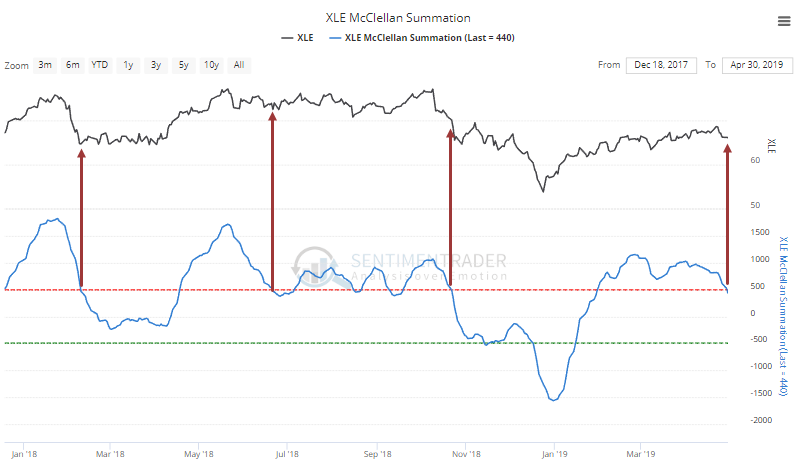
That has caused some indigestion for those stocks up to a month later.
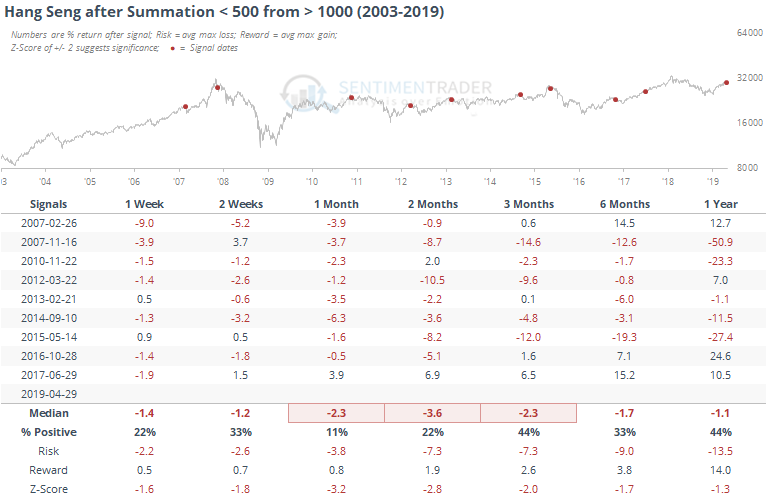
Overseas, the Hang Seng is showing the same slowing long-term breadth momentum.
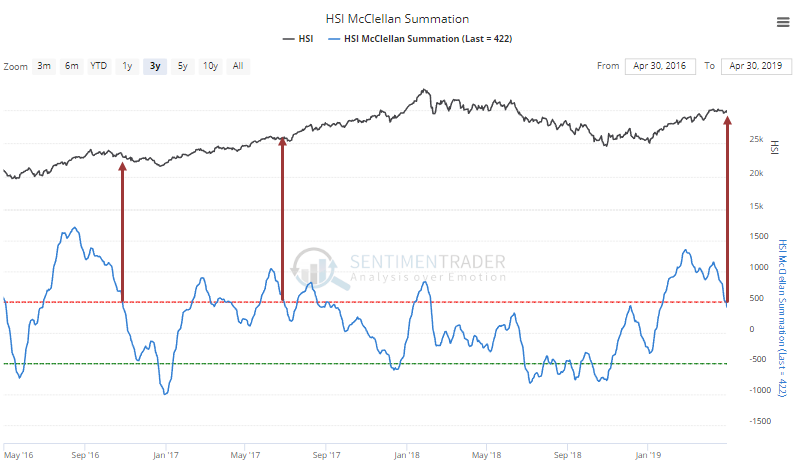
Other times it has done this, those stocks have struggled mightily over the next month.
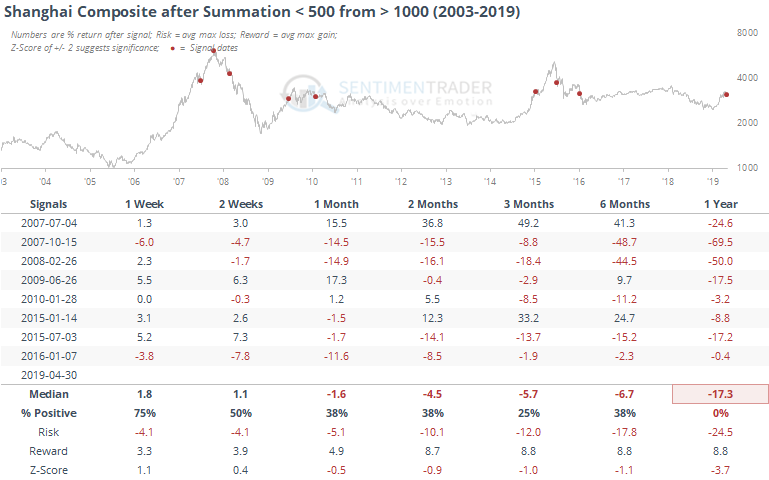
Same thing in the Shanghai Composite.
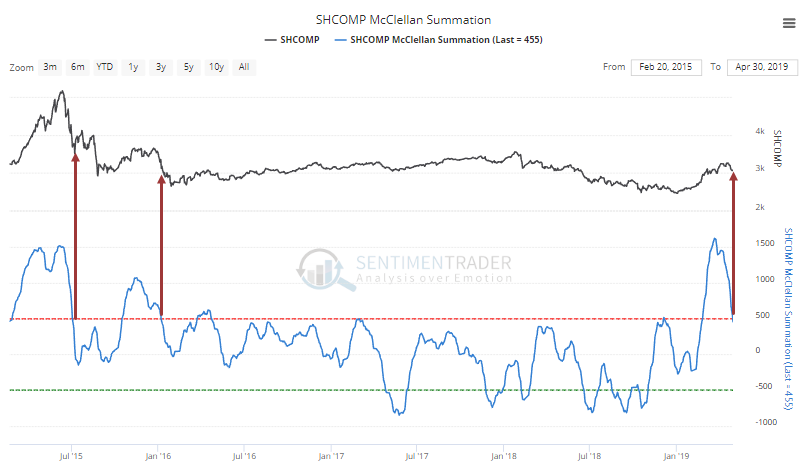
That's another market that hasn't reacted well to waning momentum underlying the index.
Missing Momentum
There are increasing signs that momentum has ebbed, which seems like it should be a negative. In some cases it is, but it's not as simple as saying waning momentum = bad.
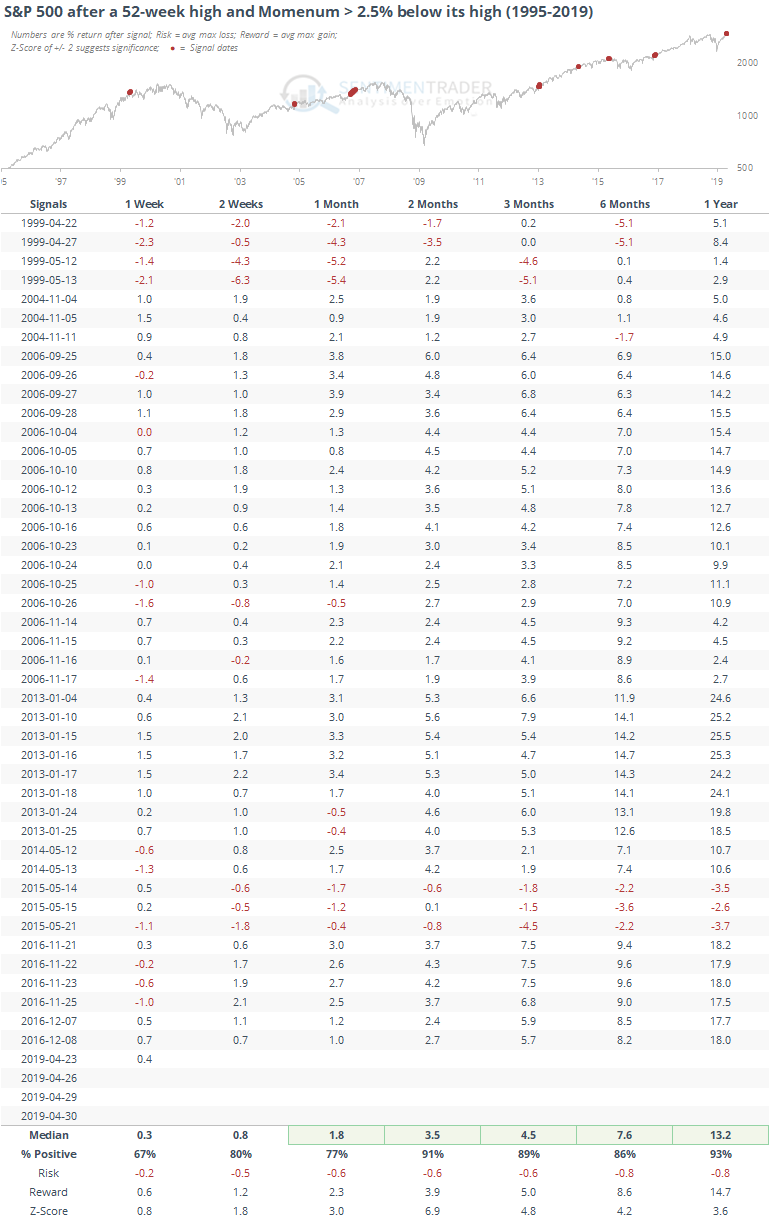
As an example, the S&P 500 has been hitting new highs over the past few days while its momentum stocks have not. The S&P 500 Momentum Index has remained at least 2.5% below its own high all week.
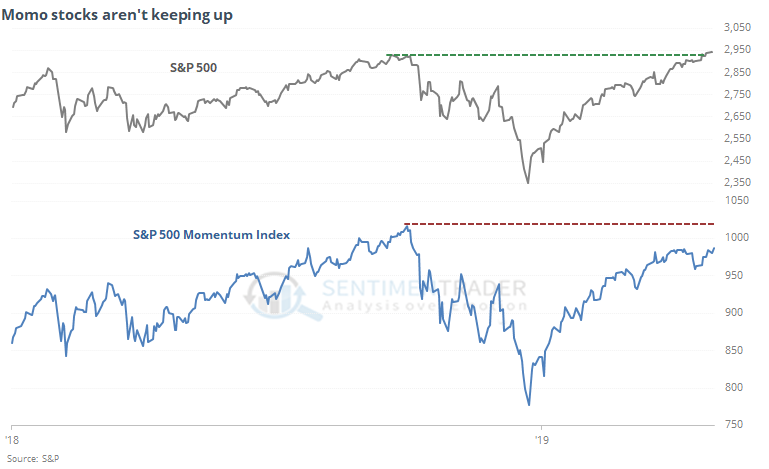
Going back to 1995, here is every date when that has triggered. Two months later, the S&P was higher 91% of the time.
Flow
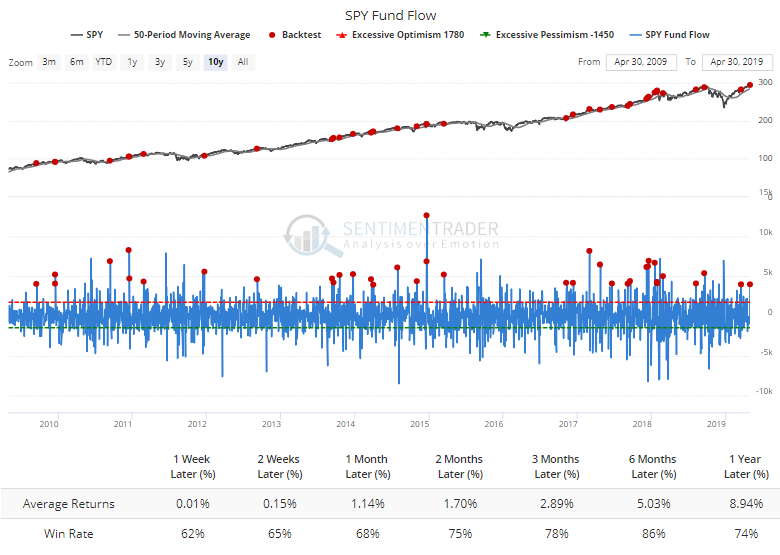
The SPY S&P 500 fund had a big inflow of $4 billion on Tuesday. When the fund was in an uptrend, that has coincided with a few short-term peaks over the past year.
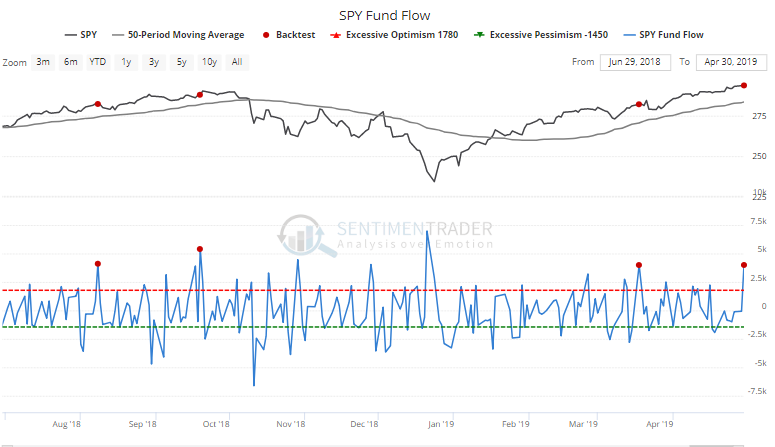
Historically, though, it has not been an accurate contrary indicator.
Strategist Sentiment
Bloomberg notes that one of the most negative Wall Street strategists has become one of the most positive. The Wells Fargo strategist just upped his year-end price target for the S&P 500 by 16%.
The curious part is that he's assuming all of that gain is going to come from investors willing to pay an ever-higher multiple for earnings, since the bank still expects S&P earnings to stay where they estimated they would be in January.
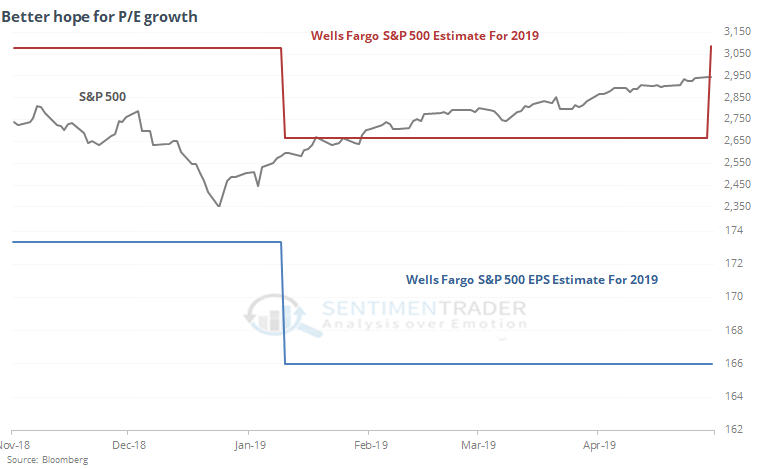
Strategists aren't market-timers, or at least not explicitly so. Because of that, they generally follow trends in prices and don't anticipate them. So it's not a big surprise that it took a month after the market bottomed before Wells lowered their 2019 target and EPS estimate. Part of this is also due to when Bloomberg polls them, so the timing could certainly be off.
The main takeaway is just the shift in sentiment. That at least some on Wall Street are expecting stocks to continue to rally throughout the year not because of improving fundamentals, but solely because of the "greater fool" theory.
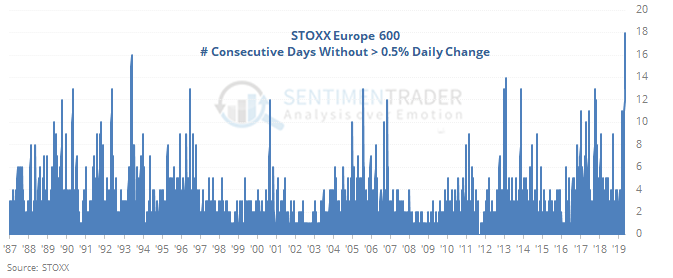
No Movement
The WSJ notes that the STOXX Europe 600 index hasn't moved much lately. It's gone more than three weeks without a daily change greater than +/- 0.5%.
Going on 18 days, this is now the longest streak in its more than 30 years of history, eclipsing the prior streak of 16 days from late May 1993.
If we look for times when the index went 13 days without a large move, then we can at least get a handful of samples.
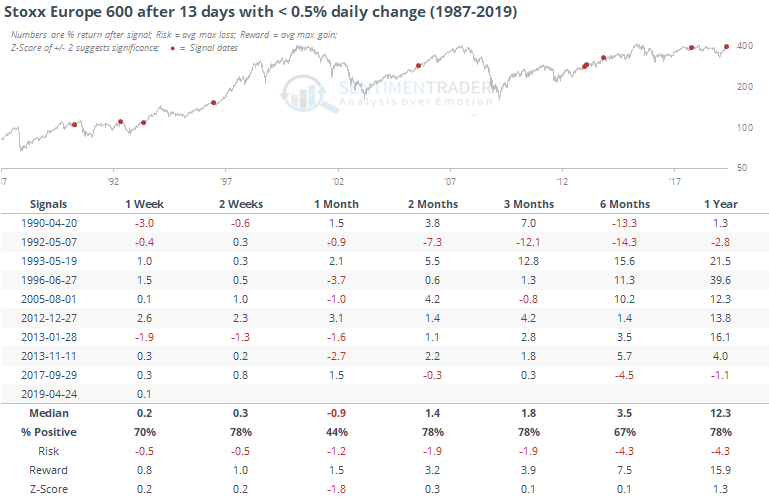
Over the next month, returns were weak, but that was isolated. Both before and after that, the momentum was a sign of buying interest that didn't back off easily.