Wednesday Color - Gaps, Confidence, Staples, May Loss, Options Fear

Here's what's piquing my interest on another morning with a largish negative gap open.
Gap
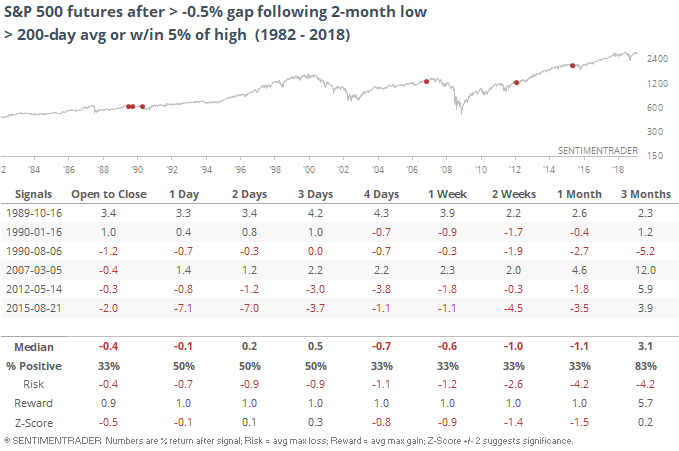
Stocks are showing another large negative gap this morning, adding to what has been a near-record cluster of anxious openings. Forgetting the fact that this comes on the heels of that cluster, we can see below that a relatively large negative open hasn't been a great sign for a reversal when coming on the heels of a multi-month low within what had been a healthy market.
If we just look for similar gaps when within "correction" territory, results are a little better but still not very positive.
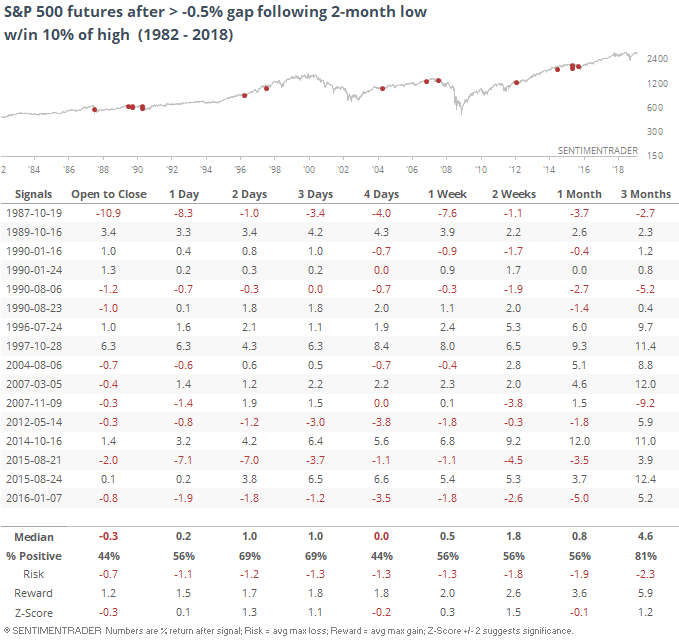
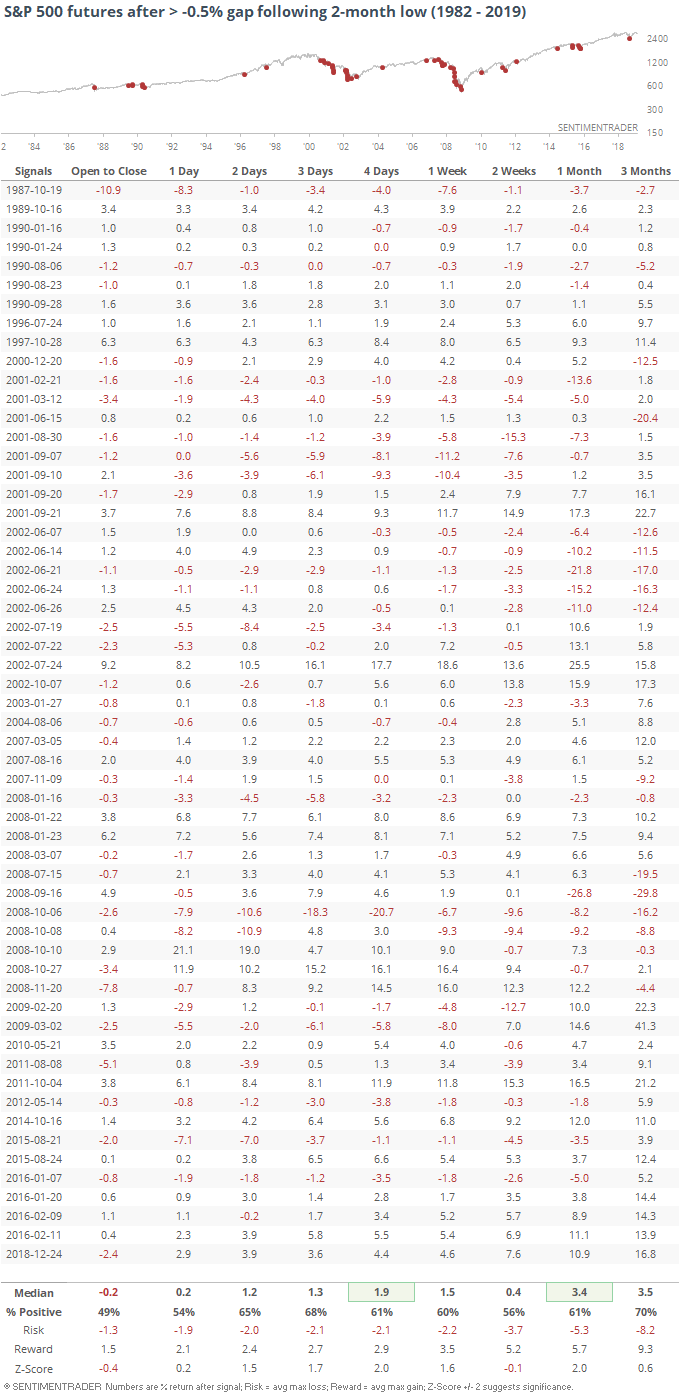
If we include every environment when the S&P gapped down following a 2-month low, the results are actually more positive than they are when stocks had been doing well.
Supreme Confidence
Most market-watchers are concerned about the high level of Consumer Confidence, and usually for good reason. The one triggering some concern now is the highest level of consumers thinking the present economic conditions are good since 2000. Peaks in this measure have preceded recessions every time.
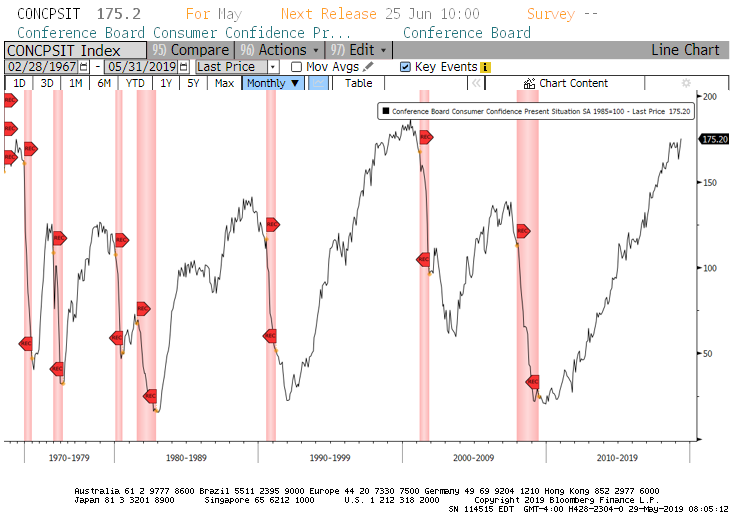
Here's the rub, though - it hasn't peaked. It just made a new high. Most of the doomsayer stats are backward-looking, assuming we know when the data peaks. If we act like we need to in real-time and without perfect hindsight knowledge, then it doesn't look so bad.
The table below shows the S&P's returns after any month in which the present conditions index hit a new high above 125, after at least two months having not been at a high.
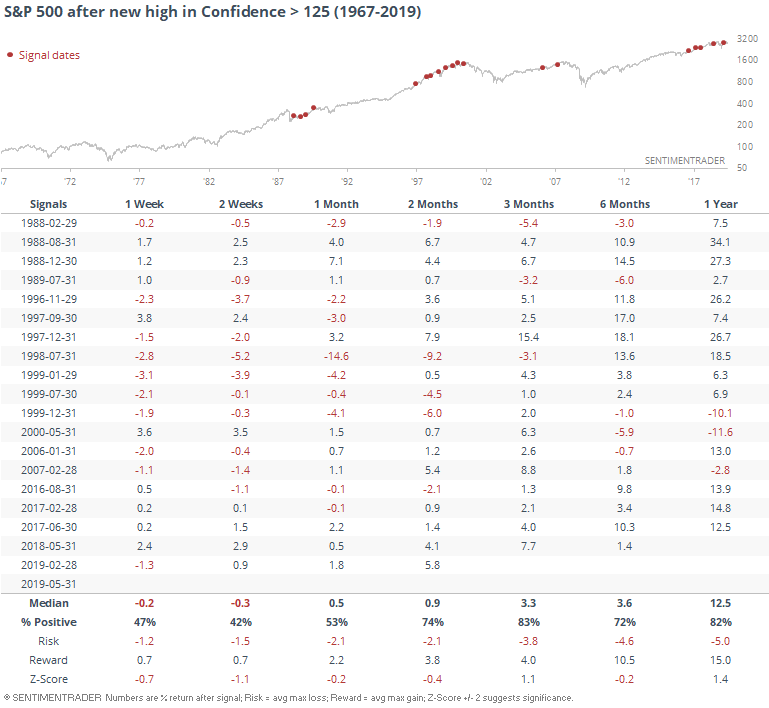
A couple of these preceded heavy long-term drawdowns, but those were the outliers. Over the next three months, these new highs in Confidence led to rallies in the S&P 83% of the time. Half of the "risk" over the next three months was due to four signals from 1998-99.
Breadth Review
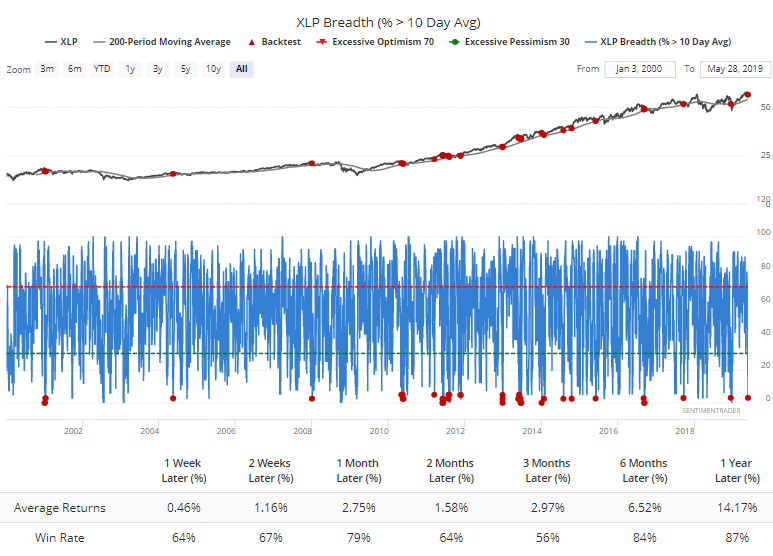
The "safe" sectors got hit pretty hard on Tuesday, among them consumer staples. The selling was swift and severe enough that fewer than 5% of the stocks were able to hold above their 10-day averages. That's a hard hit when XLP is still trading above its 200-day average, and led to snapbacks over the next month 79% of the time according to the Backtest Engine.
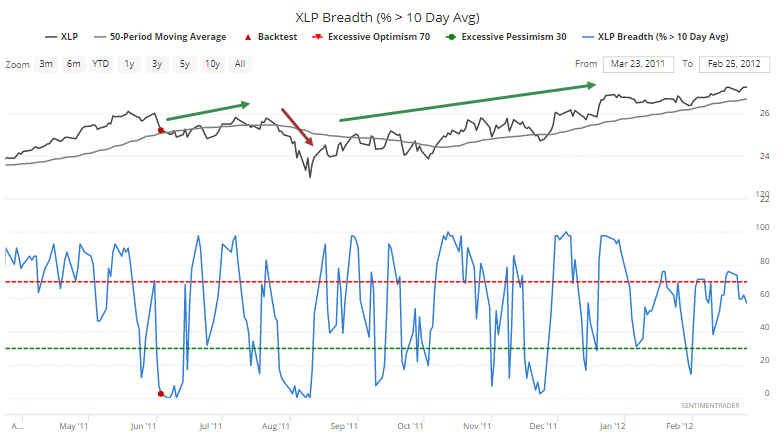
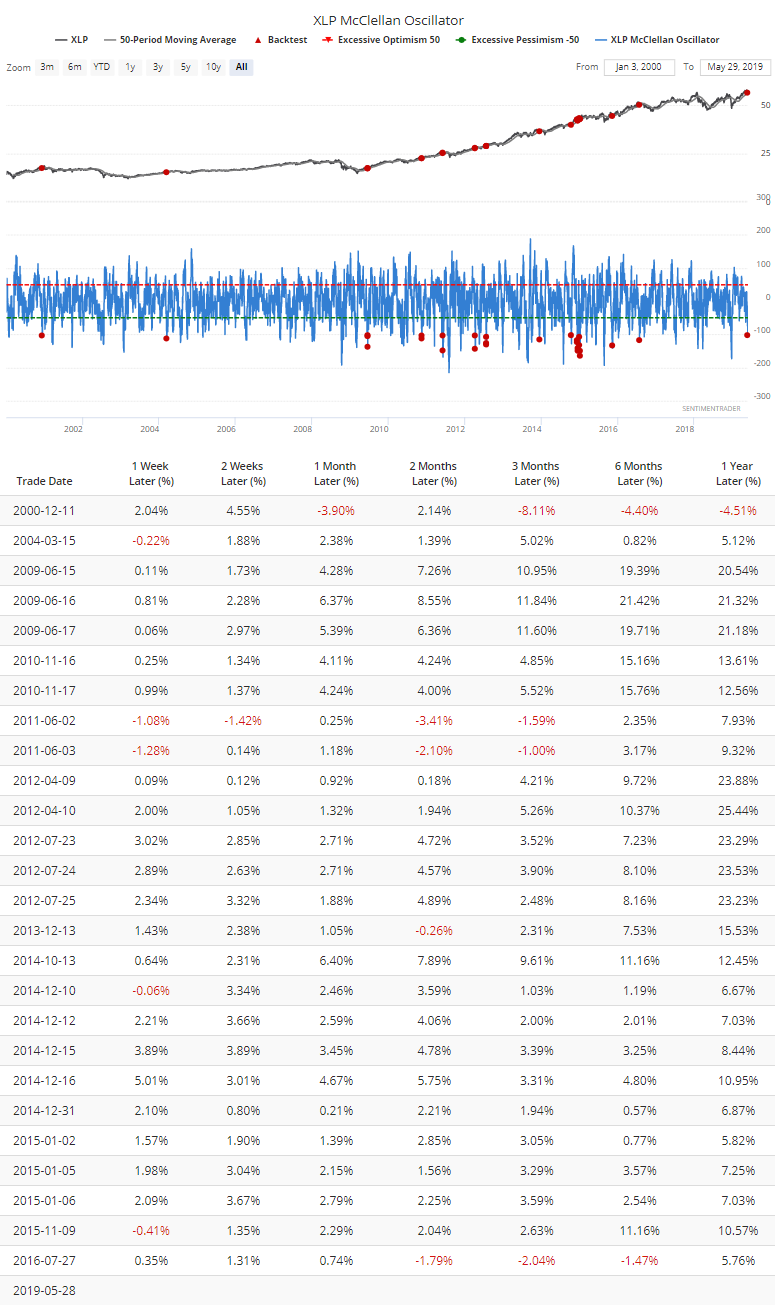
It was even rarer to see it happen when XLP was still above its 50-day average. It only happened once before, in June 2011. That led to a rebound over the next couple of months, a dive lower, then a resumption of the uptrend.
The selling impulse was enough to push the McClellan Oscillator for staples below -100. When the fund was in an uptrend at the time, the typical response was a rebound over the next month.
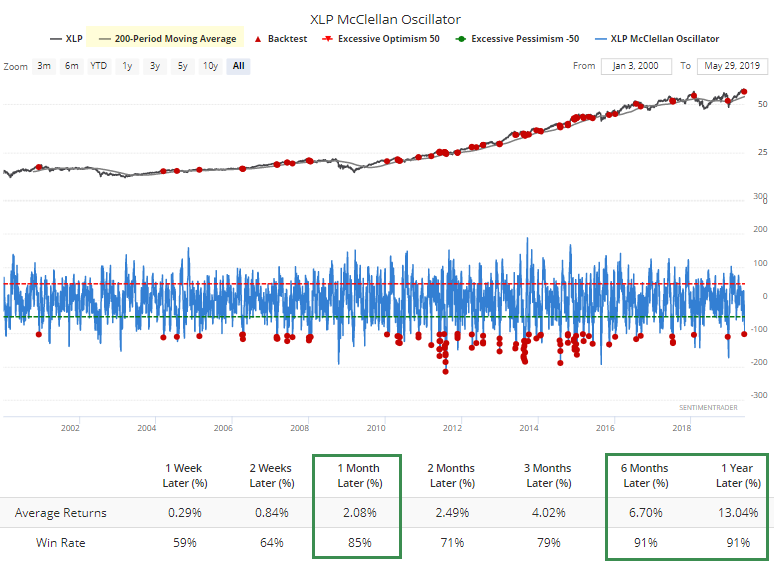
If the fund was still above its 50-day, as it was on Tuesday, then we can see just how few negative returns it suffered in the weeks and months ahead.
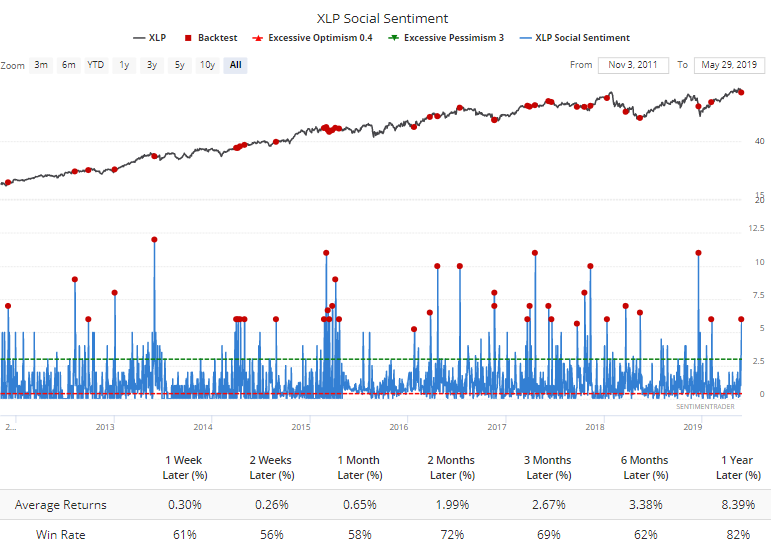
The move must have made the Twitterverse mad. There were more than 6 negative tweets about XLP than positive ones.
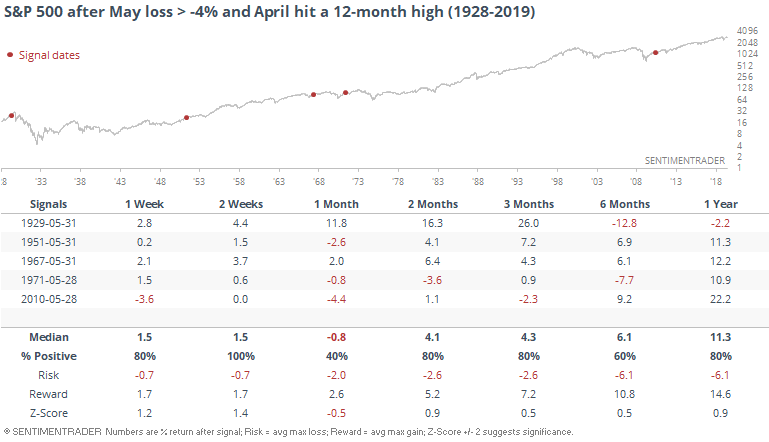
Sell In May
Those ridiculing the "sell in May" phenomenon in April when stocks were hitting new highs have quieted down now that stocks have taken a hit and markets are looking uglier heading into the summer.
But a bad May does not necessarily increase the probability that we'll see a continued selloff into the summer. Mostly the opposite.
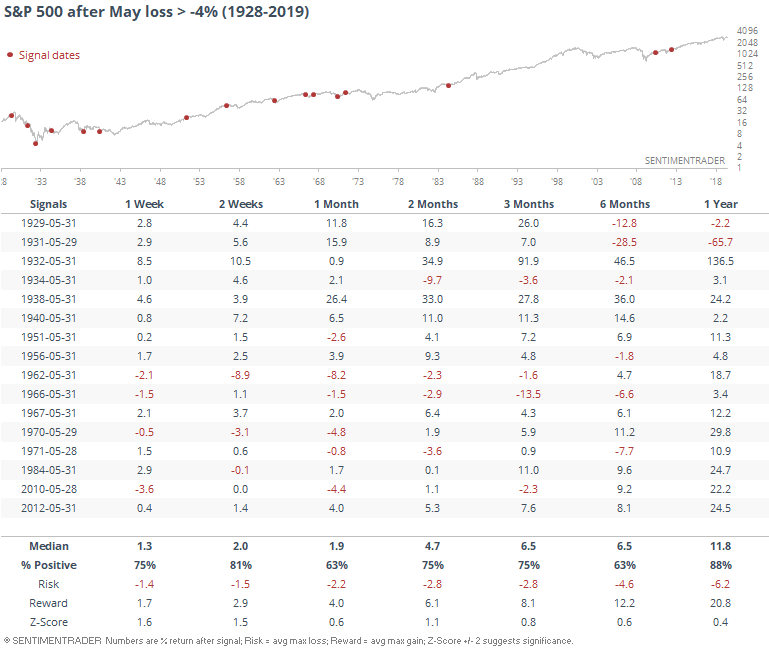
If the S&P had hit a 12-month high in April, then it was even less of a concern.
Getting A Bit Nervous
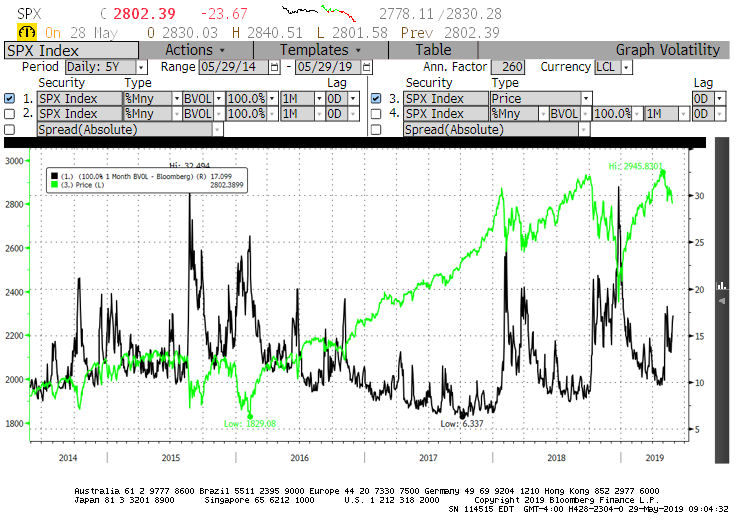
Options traders are showing rising concern. The skew among major indexes is rising quickly and is nearing the upper end of its range for several of them.
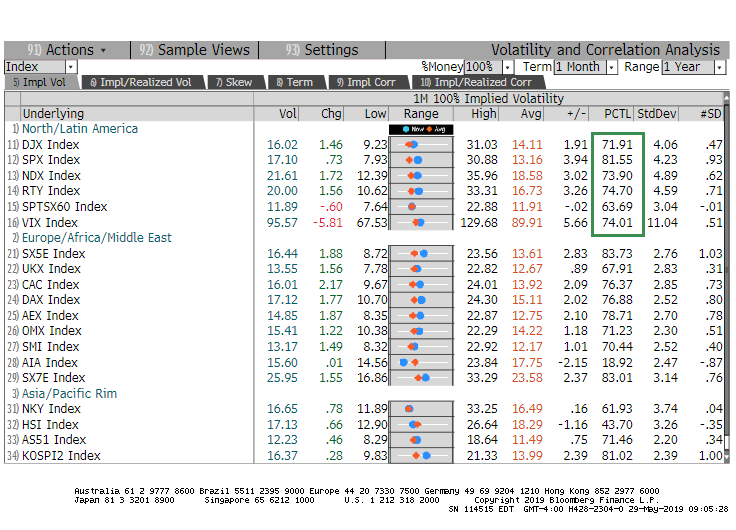
For the S&P, skew (in black below) is up nearly 70% from its low. It's still well below peak fear levels of 20-25 but it's getting there quickly.
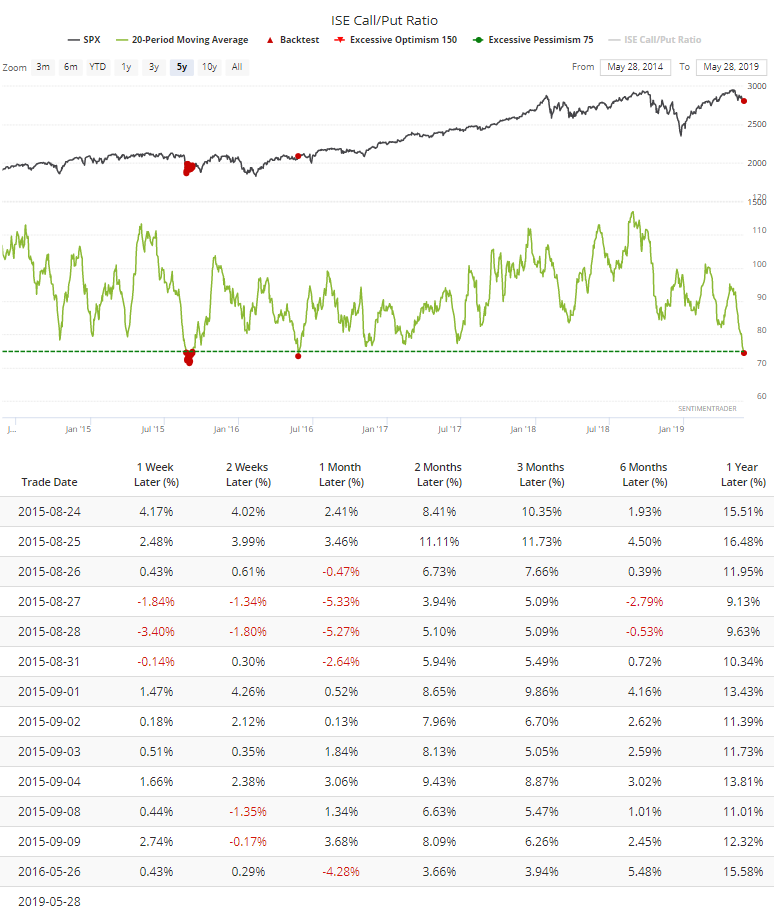
The 20-day average of the ISE Call/Put Ratio shows that traders have bought to open fewer than 75 call options for every 100 puts during the past month. That's nearing the lowest level in history, matched by only two other periods.