
Wednesday Color - Wall Street Pessimism, Utility Surge, Overseas Flow, Copper

Here's what's piquing my interest as stocks bounce back after a lessening of geopolitical tension, for the moment at least.
Sad Street
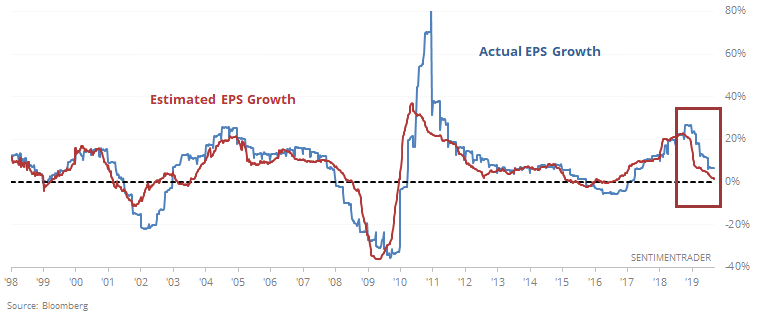
The WSJ notes that expected forward earnings for the S&P 500 is expected to show barely any growth in the quarters ahead according to Wall Street analysts. That's not really a change, as the S&P's forward earnings has trailed actual earnings for nearly a year.
It turns out that since 1990, that's a long time for Wall Street to underestimate corporate America. At nearly a year, this streak of 50 straight weeks of underestimating earnings ranks as one of the longest.
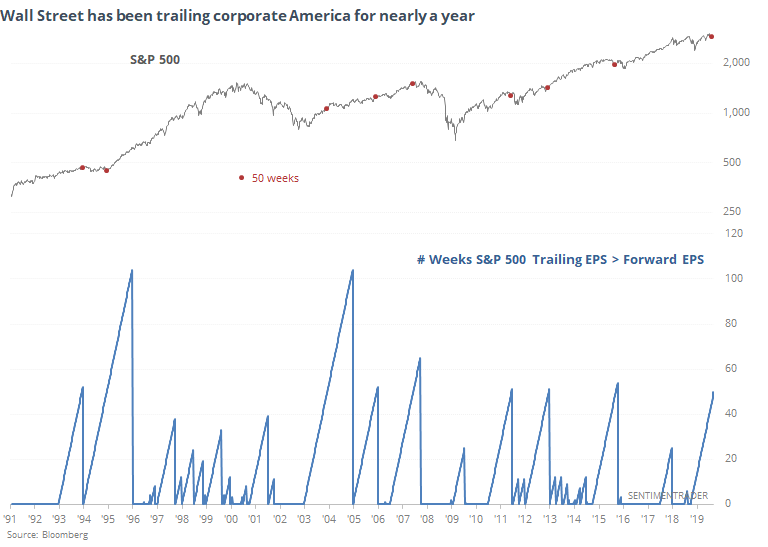
As we can see by the red dots on the chart, other long streaks generally led to higher returns. Over the next 9 months, there was only a single loss.
The long streak of analysts missing the strength of corporate earnings from a bottom-up perspective has bled into confusion among strategists as well.
Of the 21 Wall Street strategists tracked by Bloomberg, there is a 176 point standard deviation among their year-end price estimates for the S&P 500. That's the highest in at least 20 years.
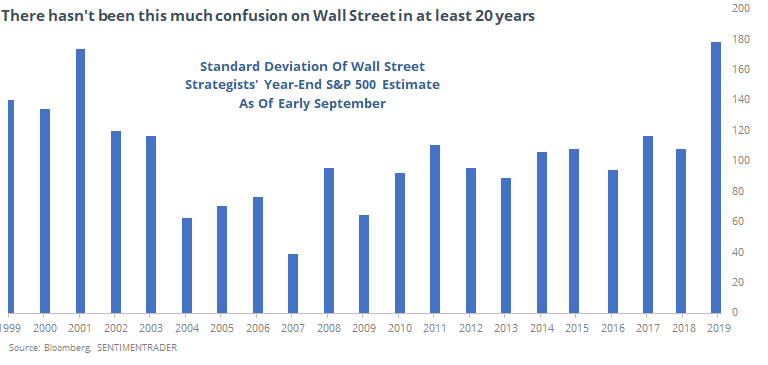
It's interesting to note that prior to this year, the most confusion was in 2001. Markets were stumbling, cracked after the 9/11 tragedy but then rallied into year-end.
The year they were the most confident (lowest standard deviation) was 2007, the year the bull market ended. We don't have enough to suggest this is a solid edge, but such confusion among the Wall Street bank crowd should be a good sign.
Sectors
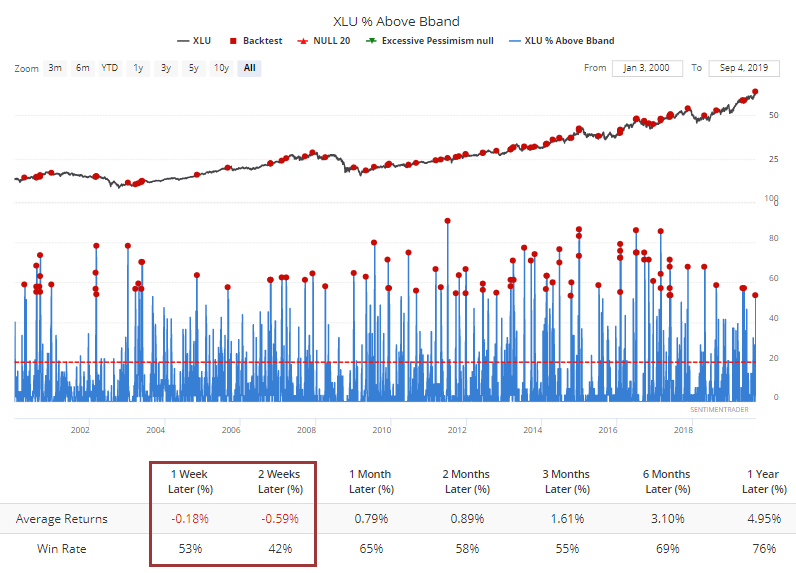
A jump in some defensive sectors on Tuesday benefited utilities, with many of those stocks jumping. More than half of them managed to pop outside of their upper volatility bands, and as we have often seen with defensive sectors, bouts of extreme momentum tend to lead to poor shorter-term returns.
The buying pressure was enough to push nearly 80% of the stocks to their highest price in the past month.
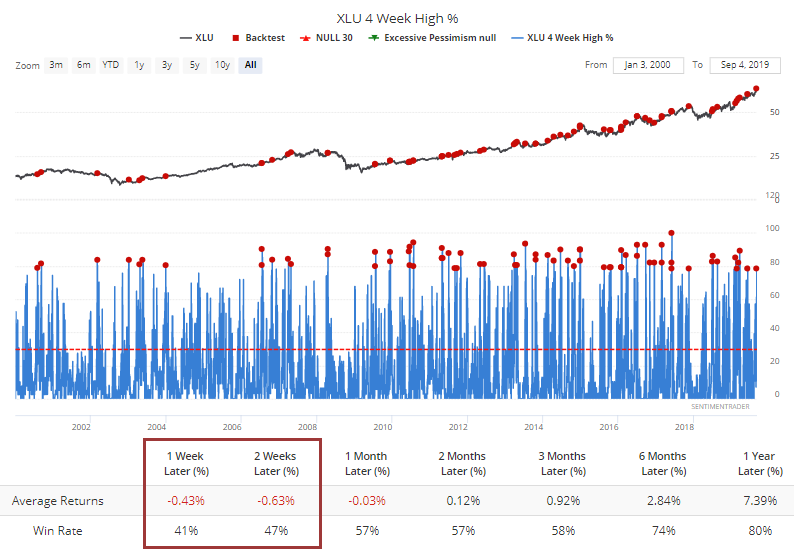
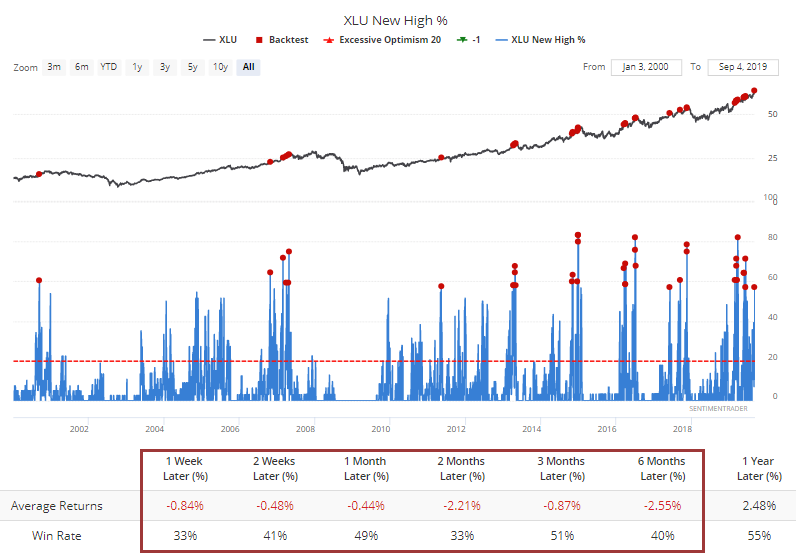
Even more impressively, nearly 60% of them also hit 52-week highs. This sector has not been very successful at holding this kind of widespread momentum.
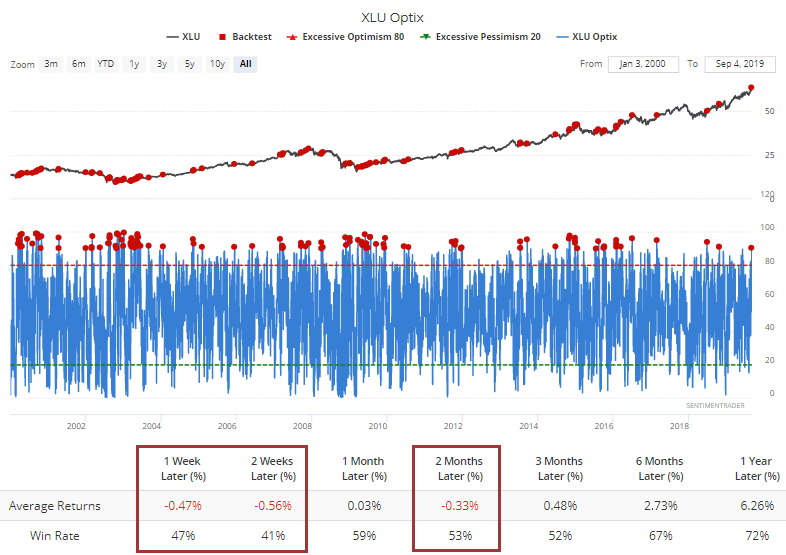
The Optimism Index for XLU jumped above 90, again something that has preceded weak returns.
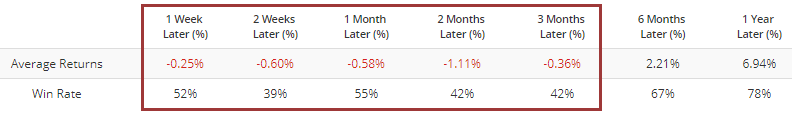
Especially when looking at the past 10 years.
Overseas Flow
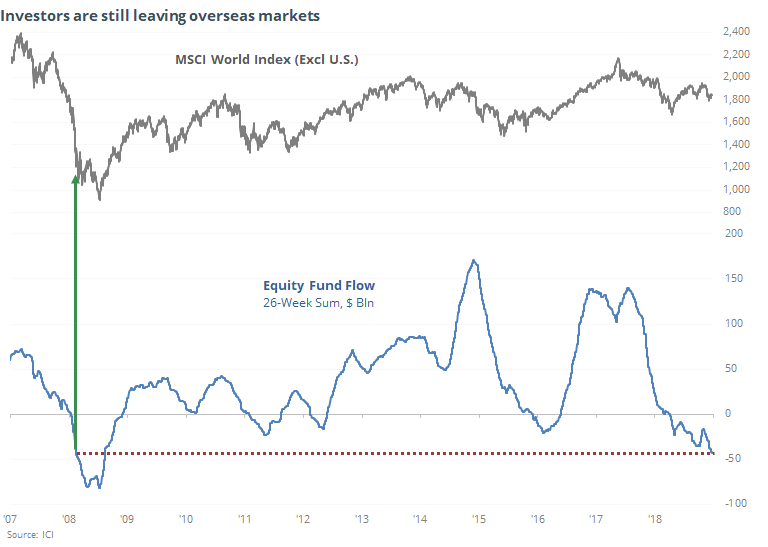
We've looked at this several times in recent weeks, and it just keeps getting more extreme. According to the Investment Company Institute, investors continue to leave overseas equities. U.S. equities, too, but especially overseas. Almost every week over the past 6 months has seen an outflow (including both mutual funds and ETFs), now totaling nearly $50 billion.
The only period that can match this was the collapse into the fall of 2008.
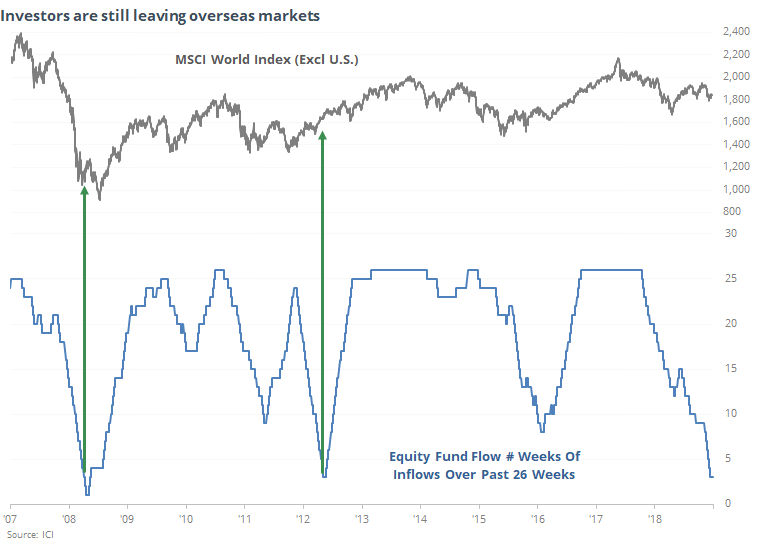
We can see the persistence of the outflows by summing how many weeks in the past 6 months had an inflow. Right now, there have only been 3 weeks with inflows out of the past 26.
Metal Mush
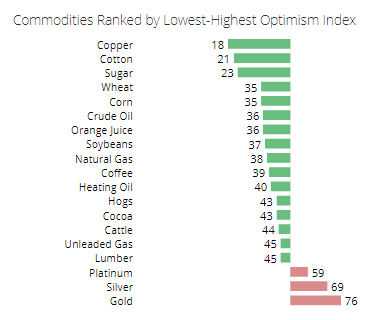
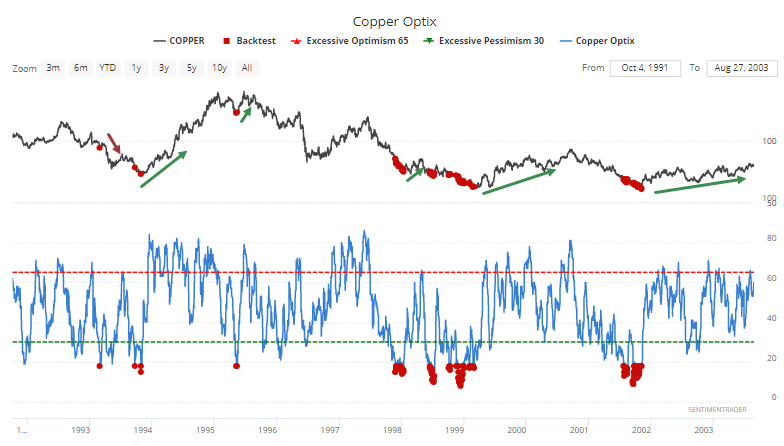
Copper still can't catch a sustained bid, and it's again the most-hated commodity.
An Optimism Index below 19 hasn't happened too many times before, and returns going forward weren't all that impressive, even though the only other time in the past 17 years that it got this low, the metal soon bottomed and went on a multi-year tear.
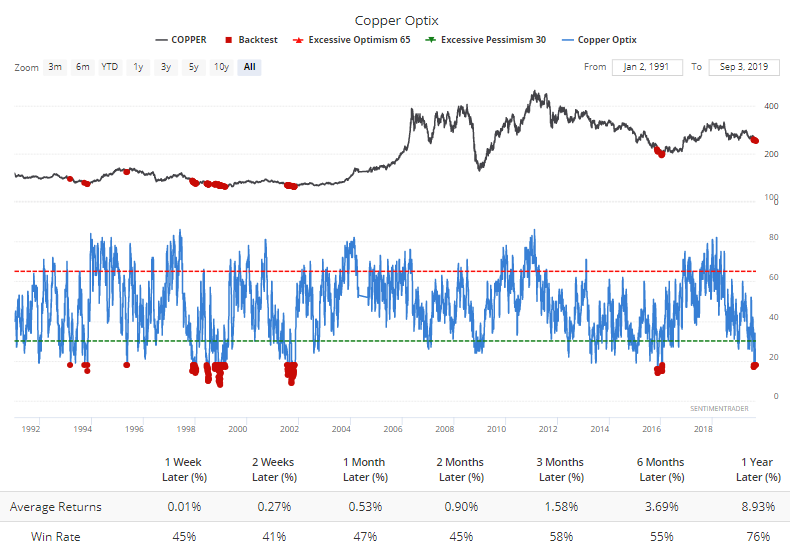
Zooming in on the 1990s through early 2000s, most of the other periods of heavy pessimism did ultimately lead to any further shorter-term losses being erased during a subsequent rally, but the timing was inconsistent, making it hard to trade especially when having to use futures contracts.
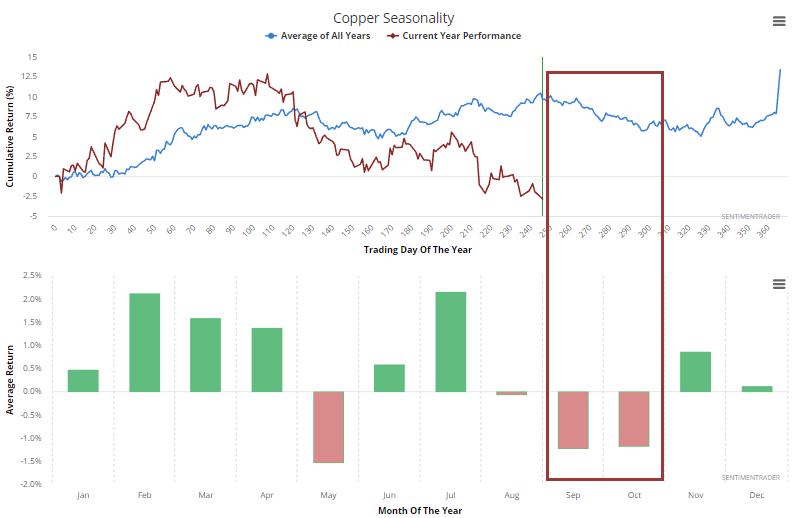
It doesn't have good seasonality right now, either.
Hedgers are holding more than 21% of open interest net long, the most since 2016, but that hasn't been enough to turn many of the prior downtrends. Its 6-12 month returns were impressive, but inconsistent.
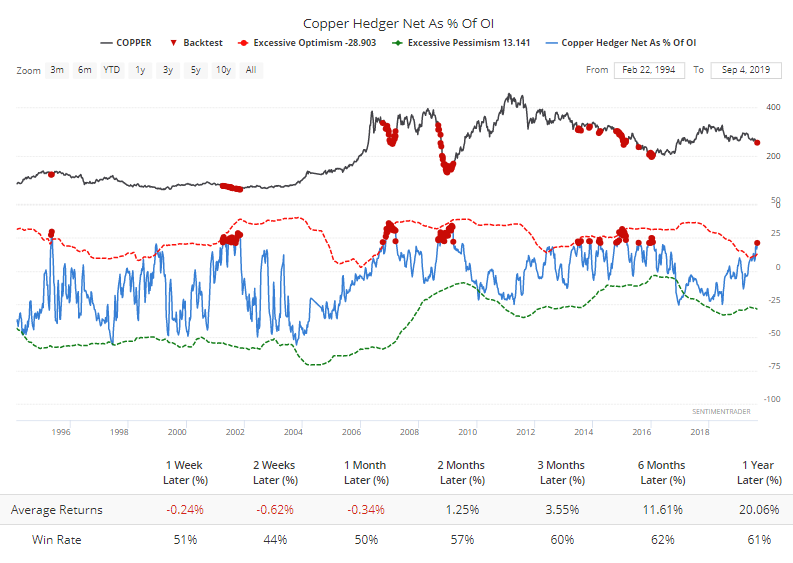
About the most positive aspect to this is that hedgers are also heavily short gold, and when that's happened, copper has done much better, especially relative to gold.