Wednesday Color - Tweets, Confidence Spread, Gold, Surprise Impact

Here's what's piquing my interest as stocks meekly try to recover from yesterday's selling.
Trump Tweets
Whatever your opinion of him, there is no arguing that the president is a careful monitor of the stock market and it's collective opinion of him. In the past week, he's taken an increased interest in the fact that it's doing well.
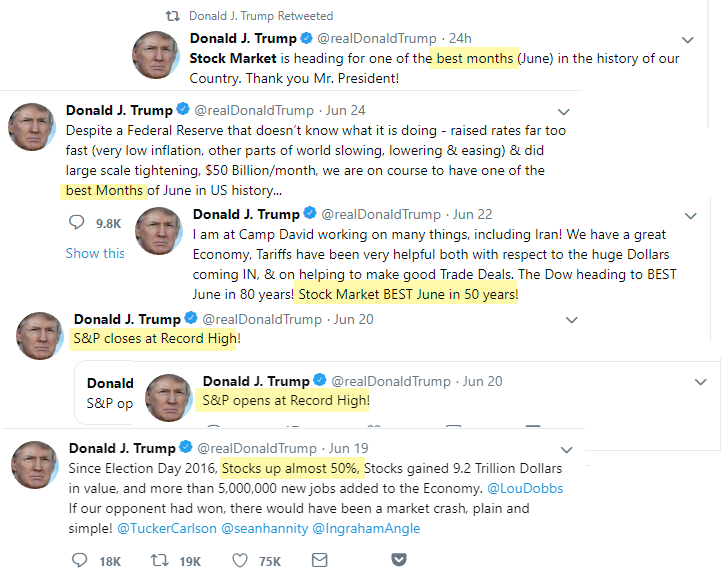
That has pushed our Trump Tweet-O-Meter to its highest level since early January 2018.
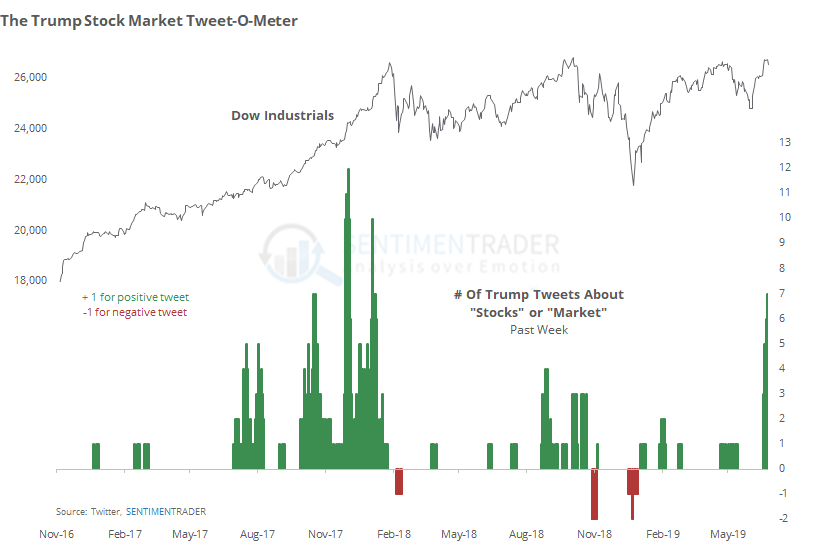
This is kind of tongue-in-cheek, but also kind of not. If perhaps the most influential, or at least famous, figure in the world today is touting the performance of the market, it could reflect the zeitgeist. And there has been a contrary nature to spikes either way.
Confidence Drop
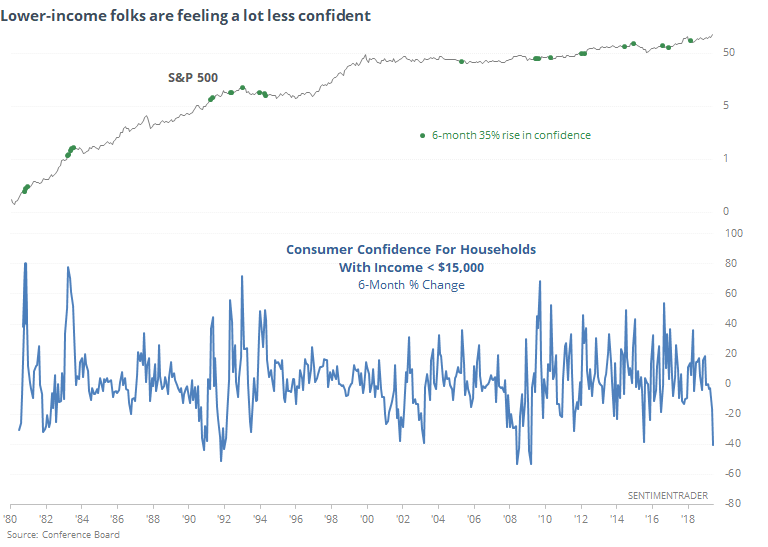
Yesterday we saw that there was a big miss in consumers' confidence about the economy. It wasn't evenly distributed, with plunging confidence among the lowest income levels as noted by the WSJ.
While this isn't a perfect gauge, there has been something of a correlation between big changes in lower-income confidence and future returns in stocks like Walmart.
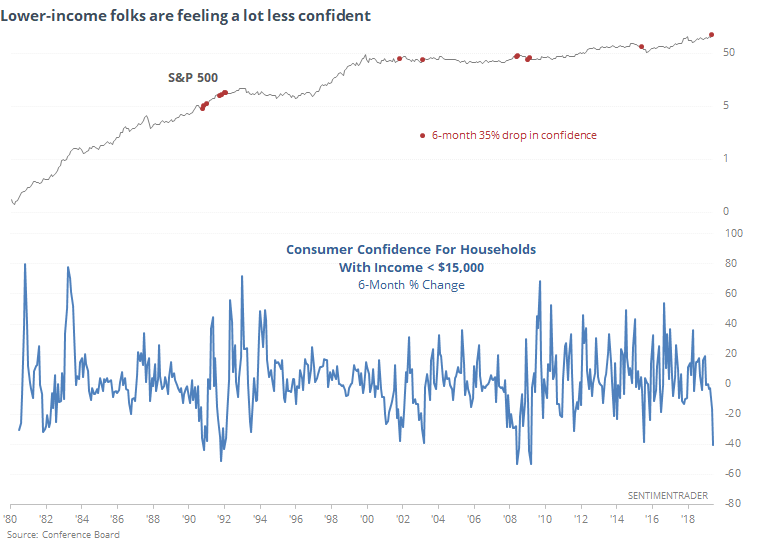
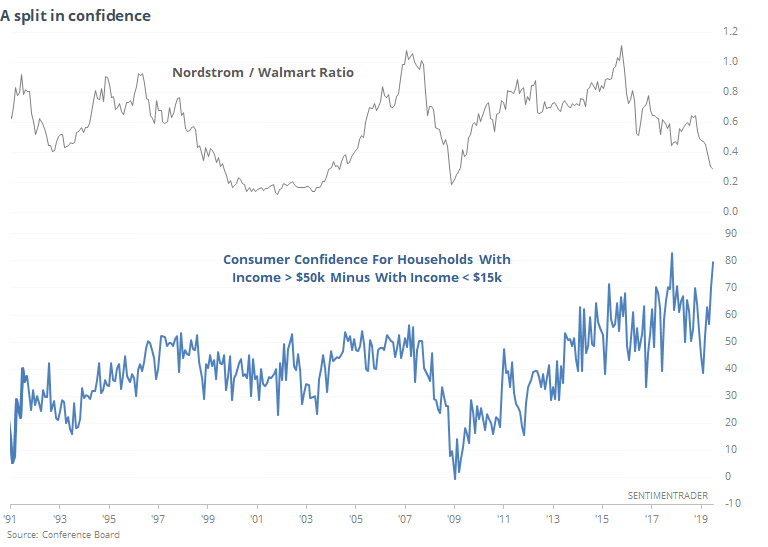
While lower-income consumers showed a plunge in confidence, higher-income households did not. That has pushed the spread between the two to the 2nd-highest on record, next to October 2017.
In years past, spread like this would have meant that a stock like Nordstroms would underperform Walmart, but that relationship hasn't held very well since the financial crisis.
Rushing In
Among other signs of a spike in interest in the breakout in gold, options traders have moved in. Over the past week, there have been an average of more than 350,000 contracts traded on GLD, the most in four years.
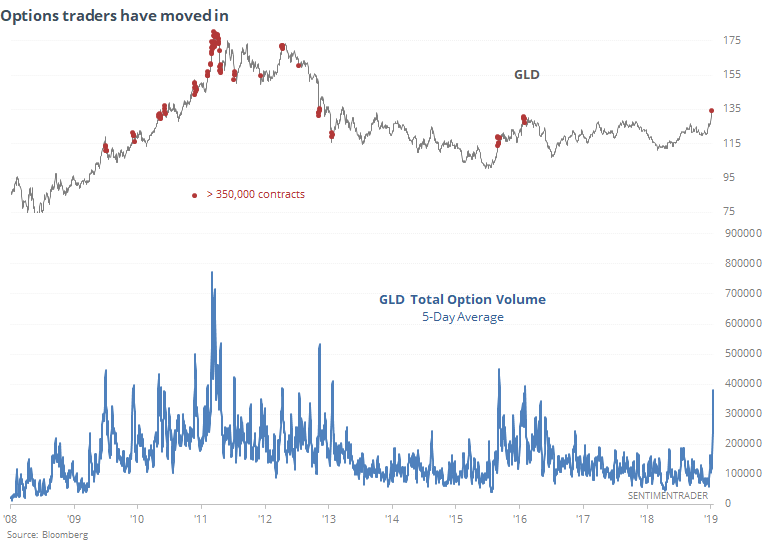
Options traders tend to get active when the underlying contract does, and we can see from the chart that these jumps in activity have typically occurred nearing turning points.
The increase in volume was in both puts and calls, but traders are really starting to pay up for the latter. The 3-month, 25-delta risk reversal has just jumped to its highest level since the financial crisis.
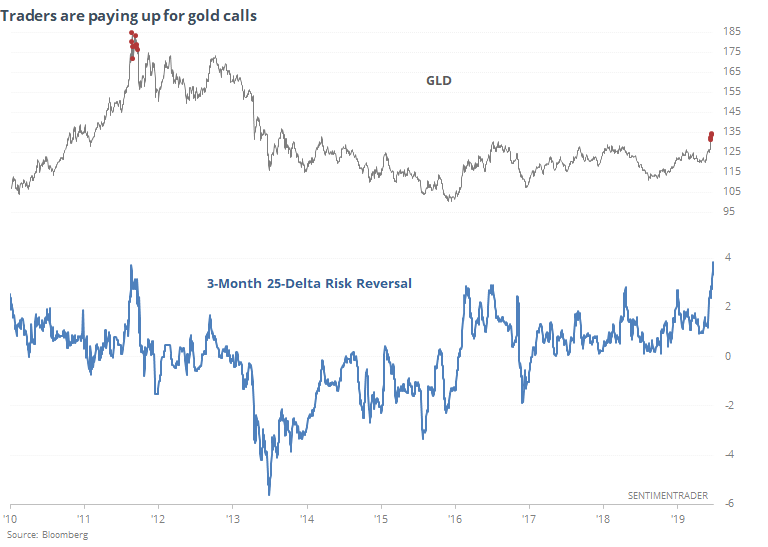
This means that the cost of buying a call is significantly higher than the proceeds from selling a put, and can be an effective measure of short- to medium-term sentiment. The chart clearly shows what happened the last time traders were willing to pay so much for potential upside.
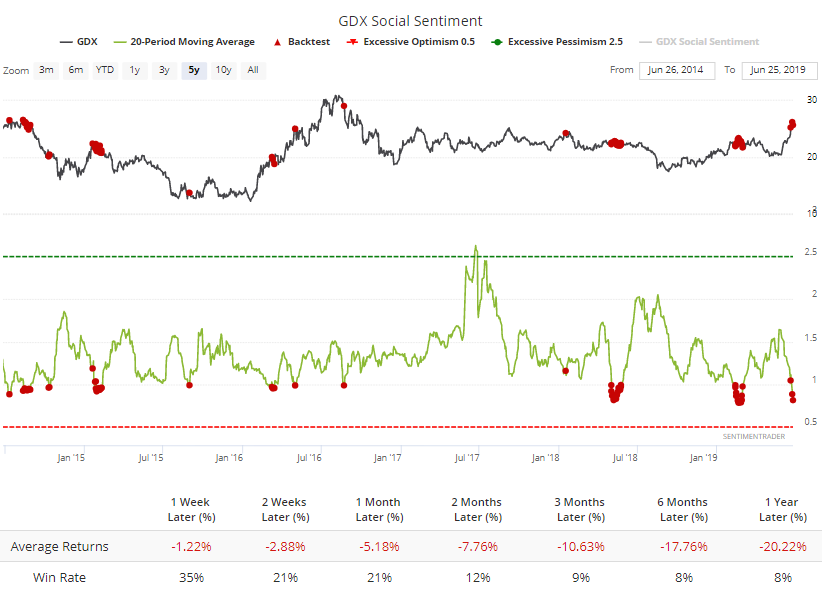
In yet another sign that gold bugs have to hope "this time is different", over the past month, Twitter users have been more likely to spout a positive message about gold miners than a negative one. Over the past 5 years, such enthusiasm has been hard to maintain.
Fundamental Difference
It's not often that we're presented with clear-cut, overwhelming evidence on one side or the other. There have been a couple times for stocks over the past year, as pessimism spiked despite what appeared to be decent fundamentals.
Most other markets have shown a conflict between one or the other. Gold is one of those right now. While the signs of enthusiasm we're seeing have had a strong record at preceding declines, at least over the short- to medium-term, there are potential fundamental tailwinds. One of those is that economic surprises in the U.S. continue to deteriorate.
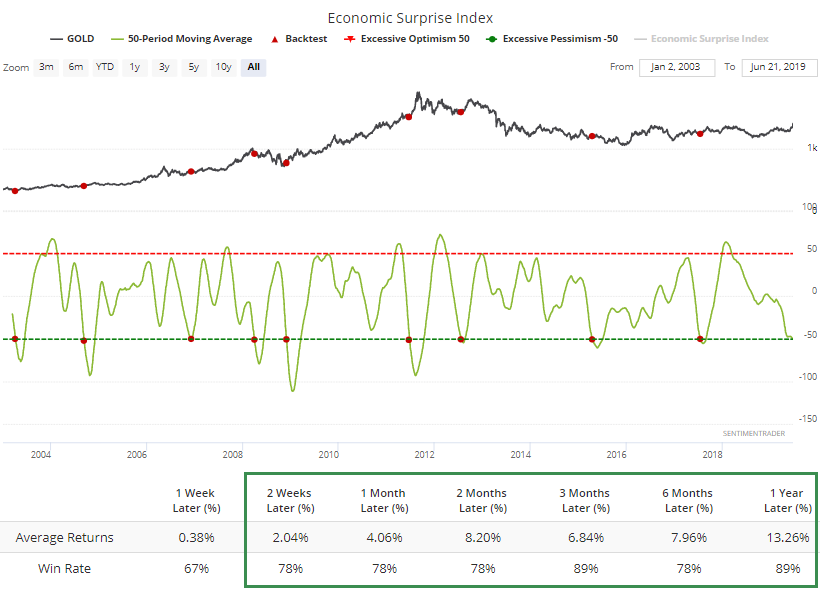
The 50-day average of the Citi Economic Surprise Index is about to cross below -50 for the first time in over a year. The other times it crosses this threshold, the dollar fell.
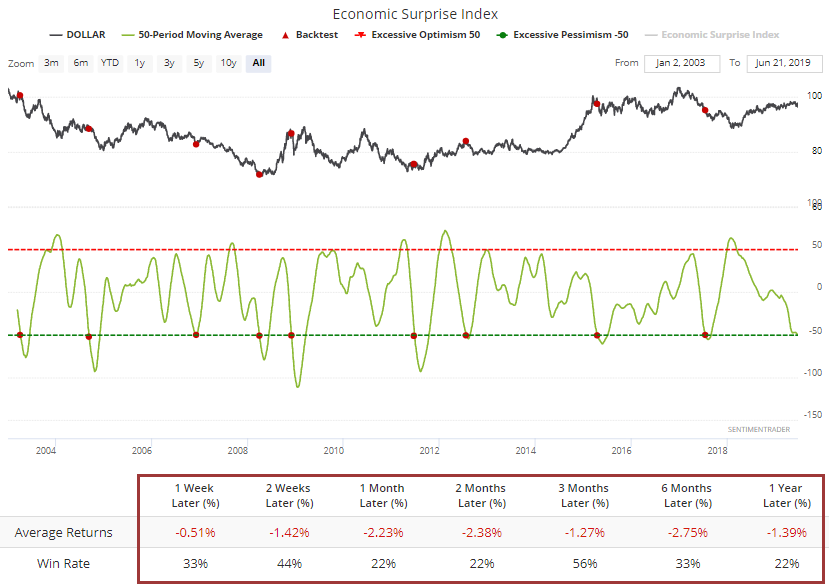
And that means gold had a better chance of rising, which it did.
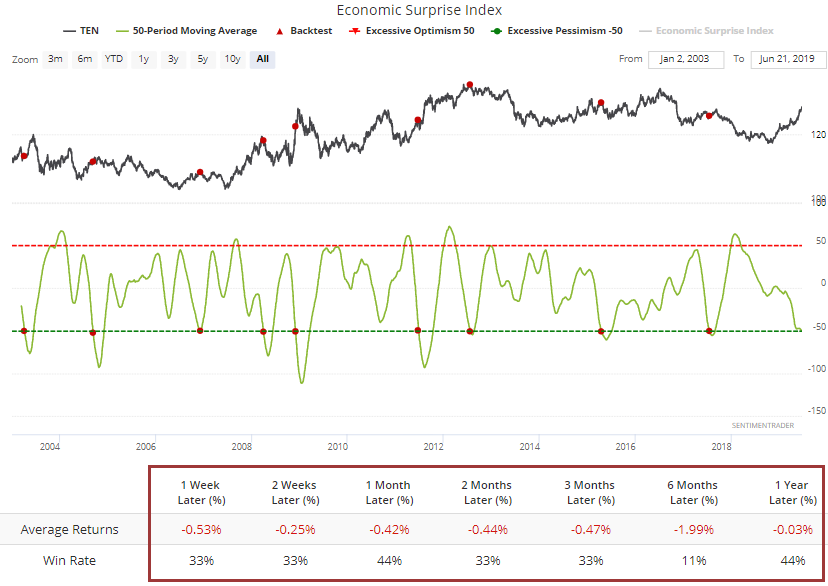
At least in bonds, there is more alignment. We saw yesterday that spikes in optimism like we've seen lately in Treasuries has had a consistent record at preceding declines.
Same goes for the drop in economic surprises.
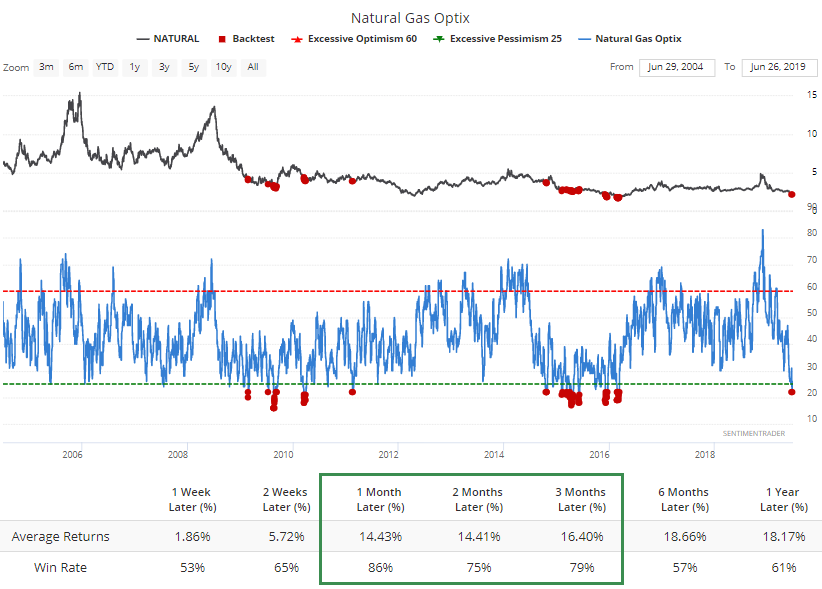
No Fuel
Bulls on natural gas have become scarce, and it's now the most-hated commodity.
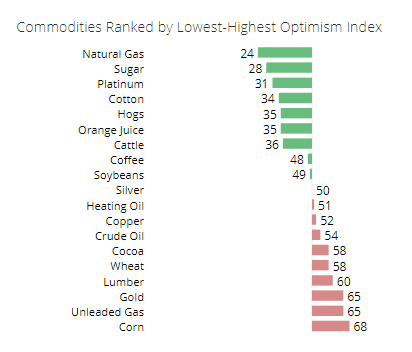
It's tried to stabilize in recent days, and has a chance to continue. Bears pressed so much that the Optimism Index sunk to its lowest level in three years.
Over the past 15 years, the contract has had a decent record of making up losses when sentiment was this depressed.